System Justification Enhances Well-being: A Longitudinal Analysis of the Palliative Function of System Justification in 18 Countries
Salvador Vargas
Facultad de Educación y Ciencias Sociales, Universidad Andres Bello, Chile Dario Paez
Department of Social Psychology and Methodology, University of the Basque Country, Spain
Sammyh S. Khan
School of Psychology, University of Keele, United Kingdom James H. Liu
School of Psychology, Massey University, New Zealand Homero Gil de Zúñiga
Media Innovation Lab, Department of Communication, University of Vienna, Austria
Facultad de Comunicación y Letras, Universidad Diego Portales, Chile This research was supported by Grant FA2386-15-1-0003 from the Asian Office of Aerospace Research and Development.
This article was partially supported by the grant PPSI2014-51923-P to Dario Paez.
System Justification Enhances Well-being: A Longitudinal Analysis of the Palliative Function of System Justification in 18 Countries
Abstract: According to the palliative function of ideology hypothesis proposed by System Justification Theory, endorsing system justifying beliefs is positively related to general psychological well-being, because this fulfils existential, epistemic, and relational needs. We discuss and address three main issues: (1) the role of societal inequality, (2) comparisons by social status, and (3) cross-sectional vs. longitudinal research. We used a longitudinal survey of representative on-line samples (N=5,901) from 18 countries. The results supported the main argument proposed by the theory, in that system justification was positively and significantly related to life satisfaction, and negatively related to anxiety and depression. The pattern of results suggested that the palliative function of system justification is more homogeneously distributed across individual and collective measures of social status than proposed by the theory, because the function was unaffected either by society-level inequality or by individual-level social status. These results allow us to infer that one of the reasons for the high stability of social arrangements is located in the psychological domain of palliative effects.
Previous studies have shown that perceiving societal arrangements as fair and legitimate, or believing that people get what they deserve, is positively associated with psychological well-being. Most of these studies have been informed by Belief in a Just World Theory (Lerner, 1980; for a review see Furnham, 2003). Within System Justification Theory – SJT (Jost & Banaji, 1994, 2004) this topic has attracted less attention, although theoretically there are clear hypotheses, which have been labeled as the palliative function of ideology (Jost & Hunyady, 2002). To date, there is still controversy over three main points, which are addressed in this article: (1) the role of contextual factors, such as societal inequality; (2) the effect of the palliative function among different status groups; and (3) the patterns found in cross-sectional vs. longitudinal studies.
We tested here the main theoretical hypotheses derived from SJT about the palliative function of ideology, with a particular focus on the three main controversial points mentioned, using a longitudinal survey conducted in 18 countries. In this article we first review the main theoretical statements about system justification and its effects on psychological well-being. Second, we consider theory regarding the impact of social status on the palliative function of ideology, incorporating cross-sectional and longitudinal findings. And, third, we outline the specific hypotheses to be tested here.
System Justification Theory and the Palliative Function of Ideology
However, the theory does not imply that people will always be motivated to perceive social arrangements as fair (Costa-Lopes, Dovidio, Pereira, & Jost, 2013; Gaucher & Jost, 2011; Jost, Gaucher, & Stern, 2015). Indeed, there are contextual factors that strengthen the system justifying motive (for a review, see Kay & Friesen, 2011; Kay & Zanna, 2009; Proudfoot & Kay, 2014), such as system inescapability (Laurin, Shepherd, & Kay, 2010), system dependence (e.g., Shepherd & Kay, 2012; for a critical review see Owuamalam, Rubin, & Spears, 2016), system threat (e.g., Bonanno & Jost, 2006; Ullrich & Cohrs, 2007; Wakslak, Jost, & Bauer, 2011), and control loss (e.g., Knight, Tobin, & Hornsey, 2014), among others.
The system justifying motive fulfills epistemic, existential, and relational needs (Hennes, Nam, Stern, & Jost, 2012). In other words, system justification allows people to have certainty about social arrangements, to feel reduced external threats, and to share a common reality with others. Regarding epistemic needs, van den Bos (2009) has argued that people need to perceive certainty in their social arrangements, and when this certainty is under threat, people react to restore it by justifying the system as a way to regain certainty (Whitson, Galisky, & Kay, 2015) In research on existential needs, Jost, Napier, Thorisdottir, Gosling, Palfai, and Ostafin (2007) showed that political conservatism, used as a proxy for system justification, was predicted by system threats. Finally, regarding relational needs, research has shown that individuals with conservative parents scored higher in system justification (Jost, Ledgerwood, & Hardin, 2008), which suggests that there is a relational motivation involved in system justification.
including variables theoretically related to system justification (e.g., rationalization of inequality), group membership, and positive adjustment, finding support for a SJT-based explanation.
Other studies have shown the palliative effect of endorsing system justification beliefs, when people are confronted with disadvantage (i.e., relative deprivation or life negative experiences). For example, Osborne and Sibley (2013) found that endorsing system justifying beliefs predicted less psychological distress. In addition, this study showed a significant interaction between individual relative deprivation and distress. In other words, when individuals with low scores on system justification were compared to those with high on this scale, the relationship between individual relative deprivation and psychological distress was positive and stronger among the former. Thus, Harding and Sibley (2013) argued that system justification acted as a buffer against life negative experiences (of harm) on life satisfaction, at least in the short term.
Given this discussion, we expect endorsing system justification beliefs will be positively associated with psychological well-being.
The Role of Societal Inequality in the Palliative Function of Ideology
highly unequal contexts, endorsing system justifying ideologies may help people cope with the negative social outcomes derived from inequality by providing an ideological justification for daily observations of other people’s suffering.
Given this discussion, our next research question tests whether endorsing system-justifying interacts with societal inequality. Specifically, we expect that among highly unequal countries the relationship between system justification and psychological well-being would be stronger than among more egalitarian countries.
The Palliative Function of System Justification by an Individual’s Social Status
According to SJT, self, collective, and system justifying motives are coherent for high-status people (Jost, Gaucher, & Stern, 2015). In other words, the motivation to maintain a positive individual and collective identity is consistent with the motivation to perceive social arrangements as fair and legitimate, for advantaged people. However, among disadvantaged people, these motivations are contradictory. If low-status individuals perceive the social arrangements as fair and endorse system-justifying beliefs, then they should blame themselves (and their ingroups) for their disadvantaged position, which contradicts the need to maintain a positive identity (Jost, Pelham, Sheldon, & Ni Sullivan, 2003). These differences by status have implications for the study of the palliative function of system justification, because its psychological benefits are hypothesized to be found among high-status, whereas among low-status people the relationship might be weaker or in the opposite direction (Jost, Banaji, Nosek, 2004; Jost & Hunyady, 2002).
Osborne, and Sibley (2017), found a positive and significant relationship between endorsing legitimizing ideologies (i.e., symbolic prejudice) and psychological well-being, but more importantly, this relationship was similar when comparing different ethnic groups rather than more prevalent in the dominant ethnic group. Quinn and Crocker (1999, Study 2) on the other hand showed that the priming of a Protestant work ethic increased depression levels among overweight women (as a proxy of low status); this same effect could not be found among non-overweight participants. The authors argued that the reason for these results was that the Protestant work ethic is an individualistic ideology, which emphasizes that people must work hard and avoid leisure (Jost & Hunyady, 2005), and endorsing it leads people to believe that they have control over their own outcomes. For this reason, low-status (overweight) individuals endorsing such ideologies are assuming responsibility for their depressed status, because they internalize reasons such as lack of self-discipline as a cause of their weight.
identification, and negatively among those with high identification. The opposite pattern was found in high-status groups.
Specifically, we expect a positive longitudinal association between endorsing system justifying beliefs and psychological well-being among high status individuals, but a negative relationship among low-status people when the relationship between the two is analyzed in a cross-lagged manner using longitudinal data.
Overview of the Study
In this study, we seek to confirm SJT’s predictions about the palliative function of ideology in longitudinal representative online samples collected from 18 countries. In addition, we tested whether the palliative function of system justifying beliefs interacted with an individual’s self-reported social status. Although SJT does not provide explicit arguments about the influence of contextual factors on the palliative function of system justification, we included the Gini (inequality) and Human Development Index (HDI) as country-level variables. We inferred that both in more developed, and in less egalitarian countries, the effect of system-justifying beliefs on well-being should be higher, as found by Sengupta, Greaves, Osborne, & Sibley, 2017 in regions within a country. In the case of national-level development, SJT does not provide specific hypotheses, but we included HDI as a “macro measure of status” in order to test if individual level predictions hold at the national level, as previous studies have done (e.g., Caricati, 2016; Caricati & Lorenzi-Cioldi, 2012). In sum, we tested the following hypothesis:
H1: System justification (at time 1) will be positively related to life satisfaction (at time 2), and negatively related to anxiety and depression (at time 2)1.
H2: National Income Inequality (GINI) at the country level will be negatively related to life satisfaction, and positively to anxiety and depression, so that in more egalitarian countries we will observe better psychological outcomes.
H3: The Human Development Index (HDI) at the country level will be positively associated with life satisfaction and interpersonal trust, and negatively with anxiety and depression, so that in more developed countries we will observe better psychological outcomes.
H4: The main effect of system justification on psychological outcomes will be qualified by an interaction with individual-subjective social status, so that the cross-lagged effect will be positive for high-status people and negative (or zero) for low-status people.
H5: The main effect of system justification on psychological outcomes will be qualified by cross-levels interactions with Human Development Index and National Income Inequality, so that the cross-lagged effect of system justification will be higher among more developed and less egalitarian countries2.
Methods
Sample
was to analyze the influence of mass media on political attitudes and behavior. Given these objectives, the longitudinal survey included many different measures, among them those used in this study. This project used online panels curated by Nielsen (a US based polling agency, that subcontracts panels from survey firms in other countries), collecting stratified samples representative on age, gender, and region (based on census data, see Gil de Zúñiga & Liu, 2017). In the survey were individuals from twenty-two countries, but we excluded those from India and South Africa, because these were only city samples. In addition, we ruled out Chile, because we obtained cases only for the first wave, and Taiwan, because of the lack of country-level variables. We selected cases from the remaining 18 countries that had no missing data for all the variables used in the analyses. This procedure retained 5,901 participants (52.18% women; Mage=47.19, DE=14.266) from Argentina, Brazil, China,
Estonia, Germany, Indonesia, Italy, Japan, South Korea, New Zealand, Philippines, Poland, Russia, Spain, Turkey, United Kingdom, Ukraine, and the United States. The sample sizes ranged from 83 (Ukraine) to 562 (Estonia), as shown in Table 1.
[TABLE 1 HERE]
Instruments
(α=.86 and .87, respectively), and were significantly related to each other (r=.784) over time.
Anxiety scale. We used the Generalized Anxiety Disorder scale (GAD; Spitzer, Kroenke, Williams, & Löwe, 2006), which asked to participants to rate the frequency by which they have felt bothered by “feeling nervous, anxious, or on edge”, “not being able to stop or control worrying”, “worrying too much about different things”, “having trouble relaxing, “being so restless that it’s hard to sit still”, “becoming easily annoyed or irritable”, and “feeling afraid as if something awful might happen”. The answers ranged from 1 (“never”) to 7 (“always”). The scale was highly reliable in both the first and the second waves (α=.94 and .94, respectively), being significantly related to each other over time (r=.719).
Depression scale. We chose two items from the Patient Health Questionnaire-4 (PHQ-4; Löwe et al., 2010), which are conceptually related to depression. The scale asked to participants to rate the frequency by which they have felt bothered by “having little interest or pleasure in doing things” and “feeling down, depressed, or hopeless”. This scale was highly reliable in both the first and the second waves (α=.86 and .87, respectively), and were significantly related to each other (r=.664).
completely”). The scale was highly reliable both in the first and second waves (α=.87 and .88, respectively), and was significantly related over time (r=.723).
Subjective Social Status. We included an item to assess subjective social status t time 1, “On a scale of 1 to 10, with 10 being people who are the most well off in society, and 1 being the people that are least well off, where would you describe your position?”.
National-level variables. The first national-level variable is the Gini coefficient (Yitzhaki, 1979), with higher values indicating higher income inequality. The data for this variable was obtained from the OECD (2017) and UNDP (2017a) databases. The second national-level variable is the Human Development Index (UNDP, 2017b), which globally measures quality of life within a country. This index is composed by measures of income, age expectancy, and educational level3.
Individual-level control variables. We included age and sex (1 female, 0 male), as individual-control variables.
Analyses
We conducted a series of multilevel-linear regression analyses (Gelman & Hill, 2007). This kind of model is appropriate for data collected within different countries, because it accounts for the hierarchical structure of data. For each dependent variable (t2), we estimated six models. In the first model, we only included the intercept, in order to obtain a baseline model to compare to the subsequent models, allowing computation of
inter- and intra-group r-squares. In the second model, we included the individual-level variables measured in the first wave, controlling for the dependent variable in that wave. In the third model, we added the Gini coefficient as a country-level variable. In the fourth model, we included the interaction terms (i.e., system justification by the individuals’ social status, and system justification by the country’s Gini coefficient). In the fifth model, we included HDI as a country-level variable instead of the Gini coefficient. Finally, in the sixth model, we included the interaction terms (i.e., system justification by social status, and system justification by HDI), in addition to HDI.
All the regressions were estimated using the restricted maximum likelihood estimator, because we had only 18 countries (Hox, 2010). In addition, we group-mean centered the individual predictors, and grand-mean centered the country-level predictors. All the analyses were performed using the software Stata v.13.
Results
Descriptive statistics are presented in Table 2. Regarding the first dependent variable of the study, there were significant differences in satisfaction with life (t2) among countries, F(17, 5883)=37.69, p=.000, η2=.098. The countries with higher means scores on
On the anxiety scale, the second dependent variable of the study, there were significant differences by country (t2), F(17, 5883)=27.14, p=.000, η2=.073. In Brazil we observed the highest mean scores on this scale, and in Japan and the United States the lowest values. The overall mean was 3.09 (SD=1.406), This significantly below 4, the mid-point of the scale, t(5900)=-49.79, p=.000. Between t1 and t2 there was no significant difference, t(5900)=.56, p=.577.
For the next dependent variable, the depression scale (t2), there were significant differences by country, F(17, 5883)=20.61, p=.000, η2=.056. The highest value was observed in Brazil, and the lowest in the United States. The overall mean (M=2.83, SD=1.543) was significantly lower than the mid-point of the scale, t(5900)=-58.49, p=.000, and was not different from the mean score in the first wave, t(5900)=-0.25, p=.801.
The main predictor in the models is the system justification scale (t1). In this variable there were significant differences by country, F(17, 5883)=60.66, p=.000, η2=.149. The highest value was observed in China, and the lowest values were found in Brazil, Italy, and Ukraine. The overall mean (M=3.24, SD=1.387) was significantly different from the mid-point of the scale, t(5900)=-42.16, p=.000, and also from the same scale in the second wave, t(5900)=-38.70, p=.000.
[TABLE 2 HERE]
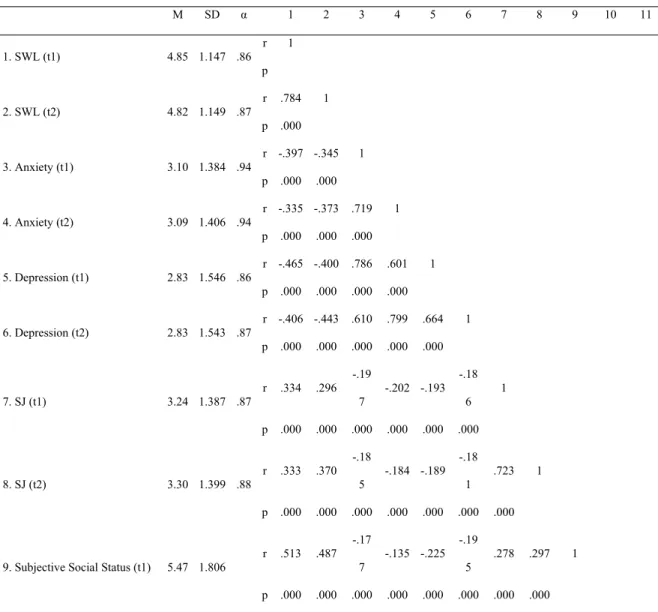
The correlation matrix is presented in Table 3. All the dependent variables were significantly and highly correlated across the two waves of measurement (all rs>.5). In
was expected. This pattern of results suggests that, at least in the bivariate correlations, we could observe the palliative function of system justification. In addition, subjective social status (t1) was significantly associated with the subjective well-being variables, so that high-status people were more satisfied with their lives (r=.487), less anxious (r=-.135), less depressed (r=-.195), and justified the system more (r=.297) at time 2. Finally, being older and female is associated with higher scores on the measures of well-being.
[TABLE 3 HERE]
Satisfaction with Life. The multilevel regression models for satisfaction with life are presented in Table 4. Model 1, in which we only included the intercept, showed that 9.96% of the variance was due to the nested structure of the data. This means that there was considerable variance at the country-level that could be potentially explained. In Model 2, we included the individual-level predictors, improving the goodness of fit with respect to Model 1 (∆-2Log=2660.91, ∆AIC=5311.83, ∆BIC=5278.42), with a significant likelihood ratio test χ2(5)=5321.83, p<.001. After controlling for satisfaction with life in the first wave, system justification and subjective social status were significantly and positively related to the dependent variable. Neither age nor gender was significant predictors in this model.
In Model 3, we included Gini as a group-level predictor, improving the goodness of fit according to -2Log (∆=1.74) and AIC (∆=1.47), although both BIC (∆=-5.21) and likelihood ratio test, χ2(1)=3.48, p=.062, indicated a worse fit. The results were similar to
In Model 4, we included the interaction terms, but the goodness of fit was worse than in Model 3, according to the likelihood ratio test, χ2(2)=2.38, p=.305, AIC (∆=-1.62) and BIC (∆=-14.99). The individual-level predictors maintained their significance, but neither Gini nor the interaction terms were significantly associated to satisfaction with life.
In Model 5, we included the individual-level predictors and the HDI as a national-level variable, but we did not obtain a better goodness of fit (χ2(1)=0.04, p=.8416, ∆AIC=-1.96, ∆BIC=-8.65). The pattern of results was similar to the previous models, so that the only significant predictors were system justification and subjective social status, after accounting for satisfaction with life in the first wave.
Finally, in Model 6, we included the interaction terms, obtaining a worse goodness of fit in comparison to Model 5 (χ2(2)=1.65, p=.437, ∆AIC=-2.35, ∆BIC=-15.71). The
results indicated that neither HDI nor the interaction terms significantly predicted satisfaction with life in our sample.
[TABLE 4 HERE]
Anxiety. The second dependent variable is anxiety, for which results are shown in Table 5. The results for Model 1 allow us to compute an intra-class correlation, which suggests that 6.95% of the variance is due to the hierarchical structure of the data. This means, there was less country-level variability in anxiety compared with life satisfaction. In Model 2, we included the individual-level predictors, improving the goodness of fit according to -2Log (∆=2016.09), the likelihood ratio test, χ2(5)=3946.77, p<.001, AIC
justification, age, and gender were significantly related to anxiety (t2). Thus, endorsing system-justifying beliefs, and being older and male were related to less anxiety.
In Model 3, we included Gini as a country-level predictor, improving the goodness of fit according to AIC (∆=3.03) and AIC (∆=.28), but not according the likelihood ratio test, χ2(1)=2.40, p=.122. The results were similar to Model 2, so that system justification and age were negatively related to anxiety, and gender was positively associated with this variable. Nevertheless, the Gini index was not significantly related to anxiety.
In Model 4, we included the interaction terms, and found the goodness of fit was worse than in Model 3 (χ2(2)=0.89, p=.639, ∆AIC=-3.03, ∆BIC=16.40). We obtained a similar pattern of results to previous models, so that the individual level-predictors were the same, but neither subjective social status nor Gini moderated the effect of system justification on anxiety.
In the Model 5, we included HDI as a country-level predictor, obtaining a better fit than in Model 2 (∆-2Log=2.11, ∆AIC=2.23), but not according the likelihood ratio test, χ2
(1)=3.39, p=.066. System justification and age were negatively and gender positively related to anxiety. In addition, HDI did approach significance at p<.05, so that the more developed a country, the less anxiety reported by its citizens.
[TABLE 5 HERE]
Depression. The results for the depression scale are presented in Table 6. The Model 1 indicated that the 5.37% of the variance was due to the hierarchical structure of the data. In Model 2, we included the individual-level predictors, improving the goodness of fit (∆-2Log=1320.45,χ2(5)=2894.36, p<.001, ∆AIC=2630.91, ∆BIC=2597.49). The results indicated that, after accounting for depression in the first wave, system justification, subjective social status, and age were significantly and negatively associated with depression in the second wave.
In Model 3, we included Gini as a country-level predictor. However, the goodness of fit was worse than in Model 2 (∆-2Log=1.11,χ2(1)=1.50, p=.220, and ∆BIC=-6.45). The
results were similar to previous models, so that system justification, subjective social status, and age cross-lagged predicted less depression. However, the Gini index was not significantly associated with depression.
In Model 4 we tested the significance of the interaction terms, but the goodness of fit was not better than in Model 3 (χ2(2)=3.80, p=.150, ∆AIC=-1.38, ∆BIC=-14.75). The results were similar to those obtained in Models 2 and 3, but neither subjective social status nor Gini moderated the main effect of system justification on depression.
Finally, in Model 6 we included the interaction terms, without obtaining a better fit (∆AIC=1.24 and ∆BIC=14.61), but not according to the likelihood ratio test, χ2(2)=4.61, p=.100. The results were similar to previous models, so that after accounting for depression in the first wave, system justification, subjective social status, gender, and HDI predicted less depression in the second wave. However neither subjective social status nor HDI moderated the effect of system justification on depression.
[TABLE 6 HERE]
Discussion
with a general positive effect of system justification beliefs on individual well-being, predicting satisfaction with life and positive affect balance (i.e. lower depression and anxiety).
Hypotheses 2 and 3 examined the influence of contextual factors on this relationship. Although we expected higher values in well-being measures within more developed and less equalitarian countries, we did not find this pattern of results. Indeed, all the regression coefficients for Gini index were non-significant, and HDI was not related to life satisfaction. However, we found a significant association between HDI and anxiety and depression, in the direction expected, so that in more developed countries there was less depression and anxiety. The overall pattern of results is congruent with studies that did not find a direct effect of inequality on well-being. Previous studies have found that it is GNP or high national level of income that is associated to well-being – and not the Gini index (Berg & Veenhoven, 2010, but see Sengupta, Greaves, Osborne, & Sibley, 2017; Oishi, Kesebir & Diener, 2011 for direct effects of inequality on well-being within regions within a country). In general, high national income or GNP, educational level and high life expectancy, that compose HDI, are related to higher subjective well-being (Diener, Diener & Diener, 1995; Basabe & Ross, 2005). In this vein, in our results HDI predicted significantly less depression, congruent with studies that found an association between national income and well-being (Basabe, Paez, Valencia, Gonzalez, Rimé, & Diener, 2002).
group-justification is coherent with system-group-justification, but among low-status people, these motivations are contradictory (Jost & Hunyady, 2002). For that reason, SJT proposes that the palliative function of system justification is likely to be more prevalent among high-status than among low-high-status people (Jost, Banaji, & Nosek, 2004; Jost & Hunyady, 2002). However, in our sample the expected interaction term between system justification and an individual’s social status was not significant. This general pattern of results, in which the palliative function of ideology tends to be similarly distributed across social-status positions, is similar to findings from New Zealand (Sengupta, Greaves, Obsborne, & Sibley, 2017) and Chile (Vargas-Salfate, 2017), providing support for an alternative view of the hedonic consequences of system justification beliefs.
Hypothesis 5 explored the relationship between individual and country-level factors. We expected to find stronger relationships between system justification and psychological well-being among high-developed and less egalitarian countries, extending the arguments proposed by SJT from the individual level to the country level (Jost & Banaji, 1994) and taking into account results from previous studies (Sengupta, Greaves, Osborne, & Sibley, 2017). However, this hypothesis was not confirmed.
system justification is less unequally distributed than the theory posits (e.g., Jost & Hunyady, 2002). Instead of robust interactions with status measures, both at individual- and collective-level, we found a homogeneous pattern of results with few significant interactions. Agreement with the dominant ideology, high false consciousness or sharing system justification beliefs increases well-being in general and not only amongst the ruling or dominant groups. Finally, these results were tested in a longitudinal sample, so both cross-sectionally, and after six months system justifying beliefs predicted enhanced subjective well-being, contradicting previous studies with longitudinal samples showing differences between cross-sectional and cross-lagged effects (e.g., Godfrey, Santos, & Burson, 2017; Osborne & Sibley, 2013).
There are four alternative explanations to those provided for SJT for these findings. First, according to McCoy, Wellman, Cosley, Saslow, and Epel (2013), the perception of control is a possible mechanism involved in the observed palliative function of ideology among low-status individuals. The authors proposed that endorsing system justifying ideologies would carry a perception of personal control over life outcomes, in a similar vein to the original statement of SJT (Hennes, Nam, Stern, & Jost, 2012). This perception of control, although illusory, would overcome the potential conflicts between ego and group identity, on the one hand, and system justification, on the other hand, among disadvantaged individuals.
Bahamondes Correa (2016) studied the relationship between system justifying beliefs and anxiety and depression symptoms among gay men and lesbian women, he found that homo-negativity, which would be interpreted as an opposite measure of pride, mediated that association. In other words, feelings of pride for sexual orientation identity would be a protective factor against anxiety and depression. Several studies have shown that most people self-identify as middle-class (Castillo, Miranda, & Cabib, 2013; Evans & Kelley, 2004) regardless of their objective social standing, so we may infer that the self-reported low status individuals in our study do not necessarily identify with this state as a group identity. This would lead to an absence of conflict between justification motivations.
Third, a different proposal was argued by Owuamalam, Paolini, and Rubin (2017), which posited a social identity approach to the studied phenomenon. According to these authors, individuals with a non-concealable central stigma may be involved in socially creative appraisals to maintain their positive in-group identity, despite being discriminated against. Specifically, those individuals may embrace positive elements of their identity and/ or may accommodate their low-status position within society, attributing discrimination as a behavior against their in-group, but not versus themselves personally. We suspect that our findings could be attributable to this last approach, paralleling the mechanism observed among ethnic populations.
others. In this article, we treated status as subjective social-economic status, because we were using a cross cultural sample. Future research must address this issue, searching for boundary conditions within this literature.
Limitations. In this article, we focused on a theoretical hypothesis proposed by SJT, namely the palliative function of ideology (Jost & Hunyady, 2002). Nevertheless, the rationale behind this idea is not completely coherent with other statements proposed by the same theoretical approach. According to SJT, ego and group justification motivations are in contradiction to system justification among low-status individuals. For the specific case of the palliative function of ideology, SJT proposes that endorsing system justifying beliefs should be negatively associated with psychological well-being among low-status individuals, because they would then blame themselves for their position within society (Jost, Banaji, & Nosek, 2004; Jost & Hunyady, 2002). On the other hand, SJT proposed that low-status individuals would be more motivated to justify social arrangements when the contradiction between ego/group justification motivation and system justification motivation are highly salient (Jost, Pelham, Sheldon, & Ni Sullivan, 2003). This last hypothesis is one of the most controversial within SJT, receiving both theoretical and empirical criticism (e.g., Brandt, 2013; Caricati, 2016; Caricati & Lorenzi-Cioldi, 2016; Owuamalam, Rubin, & Issmer, 2016; Owuamalam, Rubin, & Spears, 2016; Owuamalam, Rubin, Spears, & Weerabangsa, 2017). This rationale is completely different from the palliative function of ideology.
comparable, in order to confirm our results. In addition, a major caveat was the number of countries in our overall sample. We used 5,901 from 18 countries, but ideally we should have had more countries in order to obtain more robust results for the multilevel-linear regressions (Gelman & Hill, 2007). The small number of countries in our sample might explain the absence of significant cross-level interactions in our multilevel linear regression models. In addition, our country sample is skewed, so that we lacked more unequal and less developed countries, which could be also a reason for the nonsignificant cross-level interactions4. Finally, we obtained limited sample sizes within countries, which may
explain several discrepancies between our data and international reports on well-being or life satisfaction (e.g., Helliwell, Layard, & Sachs, 2017).
The second main limitation of the study is the short lag between the two waves. Previous longitudinal studies testing the palliative function of ideology have measured individuals with an eight-months lag (Godfrey, Santos, & Burson, 2017), or the second wave was conducted a year later the first (Harding & Sibley, 2013). This is particularly relevant to note, given that we used chronic measures of anxiety, depression, and life satisfaction, instead of state indexes, which may be less variable over a six-months period, and in turn may explain our pattern of results. In addition, to our knowledge only those studies have addressed the longitudinal effect of system justification on psychological well-being. For these reasons, we think it would be valuable to conduct new research focused on this topic, using more precise measures and a longer temporal scope.
previously, both theoretical statements and empirical findings suggest that these variables could moderate or mediate the palliative function of ideology by group status.
References
Allik, J., & Realo, A. (2004). Individualism-collectivism and social capital. Journal of Cross-cultural Psychology, 35(1), 29-49. doi: 10.1177/0022022103260381
Bahamondes-Correa, J. (2016). System Justification’s Opposite Effects on Psychological Well-Being: Testing a Moderated Mediation Model in a Gay and Lesbian Sample in Chile. Journal of Homosexuality, 63(11), 1537-1555. doi: 10.1080/00918369.2016.1223351
Basabe, N., Paez, D., Valencia, J., Gonzalez, J. L., Rimé, B., & Diener, E. (2002). Cultural dimensions, socioeconomic development, climate, and emotional hedonic level. Cognition & Emotion, 16(1), 103-125. doi: 10.1080/02699930143000158
Basabe, N., & Ros, M. (2005). Cultural dimensions and social behavior correlates: Individualism-Collectivism and Power Distance. International Review of Social Psychology, 18(1), 189-225.
Berg, M., & Veenhoven, R. (2010). Income inequality and happiness in 119 nations. In B. Greve (Ed.), Social Policy and Happiness in Europe (pp. 174–194). Cheltenham: Edward Elgar Publishing.
Bonanno, G. A., & Jost, J. T. (2006). Conservative Shift Among High-Exposure Survivors of the September 11th Terrorist Attacks. Basic and Applied Social Psychology, 28(4), 311-323. doi: 10.1207/s15324834basp2804_4
Brandt, M. J. (2013). Do the Disadvantaged Legitimize the Social System? A Large-Scale Test of the Status-Legitimacy Hypothesis. Journal of Personality and Social Psychology, 104(5), 765-785. doi: 10.1037/a0031751
Burton, C.M., Plaks, J.A. & Peterson, J.B. (2015) Why Do Conservatives Report Being Happier Than Liberals? The Contribution of Neuroticism. Journal of Social and Political Psychology, 3(1), 89–102. doi: 10.5964/jspp.v3i1.117
Butz, S., Kieslich, P., & Bless, H. (2017). Why are Conservatives Happier than Liberals? Comparing Different Explanations Based on System Justification, Multiple Group Membership, and Positive Adjustment. European Journal of Social Psychology. doi: 10.1002/ejsp.2283
Caricati, L. (2016). Testing the Status-Legitimizing Hypothesis: A Multilevel Modelling Approach to the Perception of Legitimacy in Income Distribution in 36 Nations. The Journal of Social Psychology, 1-9. doi: 1080/00224545.2016.1242472
Castillo, J. C., Miranda, D., & Madero-Cabib, I. (2013). Todos somos de clase media: Sobre el estatus social subjetivo en Chile. Latin American Research Review, 48(1), 155-173. doi: 10.1353/lar.2013.0006
Costa-Lopes, R., Dovidio, J. F., Pereira, C. R., & Jost, J. T. (2013). Social psychological perspectives on the legitimation of social inequality: Past, present and future. European Journal of Social Psychology, 43, 229-237. doi: 10.1002/ejsp.1966
Diener, E., Diener, M., & Diener, C. (1995). Factors predicting the subjective well-being of nations. Journal of Personality and Social Psychology, 69(5), 851–864. doi: 10.1037/0022-3514.69.5.851
Diener, E., Lucas, R., Schimmack, U., & Helliwell, J. (2009). Well-being for Public Policy.
Evans, M. D. R. & Kelley, J. (2004). Subjective Social Location: Data From 21 Nations. International Journal of Public Opinion Research, 16(1), 3-38. doi: 10.1093/ijpor/16.1.3
Furnham, A. (2003). Belief in a just world: research progress over the past decade. Personality and Individual Differences, 34(5), 795-817. doi: 10.1016/S0191-8869(02)00072-7
Helliwell, J., Layard, R., & Sachs, J. (2017). World Happiness Report 2017. New York: Sustainable Development Solutions Network.
Gelman, A. & Hill, J. (2007). Data Analysis Using Regression and Multilevel/Hierarchical Models. New York: Cambridge University Press.
Gil de Zúñiga, H., Diehl, T., Huber, B., & Liu, J. H. (2017). Personality Traits and Social Media Use in 20 Countries: How Personality Relates to Frequency of Social Media Use, Social Media News Use, and Social Media Use for social Interaction. Cyberpsychology, Behavior, and Social Networking, 20(9), 540-552. doi: 10.1089/cyber.2017.0295
Gil de Zúñiga, H., & Liu, J.H. (2017). Second screening politics in the social media sphere: Advancing research on dual screen use in political communication with evidence from 20 countries. Journal of Broadcasting & Electronic Media, 61(2), 193-219. doi: 10.108/08838151.2017.1309420
Godfrey, E. B., Santos, C. E., & Burson, E. (2017). For Better or Worse? System-Justifying Beliefs in Sixth-Grade Predict Trajectories of Self-Esteem and Behavior Across Early Adolescence. Child Development. doi: 10.1111/cdev.12854
Harding, J. F., & Sibley, C. G. (2013). The Palliative Function of System Justification: Concurrent Benefits Versus Longer-Term Costs to Well-being. Social Indicators Research, 113(1), 401-418. doi: 10.1007/s11205-012-0101-1
Hennes, E. P., Nam, H. H., Stern, C., & Jost, J. T. (2012). Not all ideologies are created equal: epistemic, existential, and relational needs predict system-justifying attitudes. Social Cognition, 30(6), 669-688. doi: 10.1521/soco.2012.30.6.669
Jost, J. T., & Banaji, M. R. (1994). The role of stereotyping in system-justification and the production of false consciousness. British Journal of Social Psychology, 33, 1-27. doi: 10.1111/j.2044-8309.1994.tb01008.x
Jost, J. T., & Banaji, M. R. (2004). The Role of Stereotyping in System Justification and the Production of False Consciousness. In J. T. Jost, & J. Sidanius (Eds.), Political Psychology (pp. 391-419). New York: Psychology Press.
Jost, J. T., Banaji, M. R., & Nosek, B. A. (2004). A Decade of System Justification Theory: Accumulated Evidence of Conscious and Unconscious Bolstering of the Status Quo. Political Psychology, 25(6), 881-919. doi: 10.1111/j.1467-9221.2004.00402.x
Jost, J. T., Glaser, J., Kruglanski, A. W., & Sulloway, F. J. (2003). Political Conservatism as Motivated Social Cognition. Psychological Bulletin, 129(3), 339-375. doi: 10.1037/0033-2909.129.3.339
Jost, J. T., Gaucher, D., & Stern, C. (2015). “The world isn’t fair”: A system justification perspective on social stratification and inequality. In M. Mikulincer, P. R. Shaver, J. F. Dovidio, & J. A. Simpson (Eds.), APA Handbook of Personality and Social Psychology (Vol. 2: Group Processes, pp. 317-340). Washington DC: American Psychological Association.
Jost, J. T., & Hunyady, O. (2005). Antecedents and Consequences of System-Justifying Ideologies. Current Directions in Psychological Science, 14(5), 260-265. doi: 10.1111/j.0963-7214.2005.00377.x
Jost, J. T., Ledgerwood, A., & Hardin, C. D. (2008). Shared Reality, System Justification, and the Relational Basis of Ideological Beliefs. Social and Personality Psychological Compass, 2(1), 171-186. doi: 10.1111/j.1751-9004.2007.00056.x
Jost, J. T., Napier, J. L., Thorisdottir, H., Gosling, S. D., Palfai, T. P., & Ostafin, B. (2007). Are Needs to Manage Uncertainty and Threat Associated With Political Conservatism or ideological Extremity? Personality and Social Psychology Bulletin, 33(7), 989-1007. doi: 10.1177/0146167207301028
Jost, J. T., Pelham, B. W., Sheldon, O., & Ni Sullivan, B. (2003). Social inequality and the reduction of ideological dissonance on behalf of the system: evidence of enhanced system justification among the disadvantaged. European Journal of Social Psychology, 33, 13-36. doi: 10.1002/ejsp.127
Kay, A. C., & Friesen, J. (2011). On Social Stability and Social Change: Understanding When System Justification Does and Does Not Occur. Current Directions in Psychological Science, 20(6), 360-364. doi: 10.1177/0963721411422059
Kay, A. C., & Zanna, M. P. (2009). A Contextual Analysis of the System Justification Motive and Its Societal Consequences. In J. T. Jost, A. C. Kay, & H. Thorisdottir (Eds.), Social and Psychological Bases of Ideology and System Justification (pp. 158-181). Oxford: Oxford University Press.
Knight, C. G., Tobin, S. J., & Hornsey, M. J. (2014). From fighting the system to embracing it: control loss promotes system justification among those high in psychological reactance. Journal of Experimental Social Psychology, 54, 139-146. doi: 10.1016/j.jesp.2014.04.012
Lerner, M. K. (1980). The Belief in a Just World: A Fundamental Delusion. New York: Springer.
Lau, A. L., Cummins, R. A., & McPherson, W. (2005). An Investigation into the Cross-Cultural Equivalence of the Personal Well-being Index. Social Indicators Research, 72(3), 403-430. doi: 10.1007/s11205-004-0561-z
Laurin, K., Shepherd, S., & Kay, A. C. (2010). Restricted Emigration, System Inescapability, and Defense of the Status Quo: Systen-Justifying Consequences of Restricted Exit Opportunities. Psychological Science, 21(8), 1075-1082. doi: 10.1177/0956797610375448
Löwe, B. et al. (2010). A 4-item measure of depression and anxiety; Validation and standardization of the Patient Health Questionnaire-4 (PHQ-4) in the general population. Journal of Affective Disorders, 122(1), 86-95. doi: 10.1016/j.jad.2009.06.019
McCoy, S. K., Wellman, J. D., Cosley, B., Saslow, L., & Epel, E. (2013). Is the belief in meritocracy palliative for members of low status groups? Evidence for a benefit for self-steem and physical health via perceived control. European Journal of Social Psychology, 43(4), 307-318. doi: 10.1002/ejsp.1959
Napier, J. L., & Jost, J. T. (2008). Why Are Conservatives Happier Than Liberals? Psychological Science, 19(6), 565-572. doi: 10.1111/j.1467-9280.2008.02124.x
O'Brien, L. T., & Major, B. (2005). System-Justifying Beliefs and Psychological Well-Being: The Roles of Group Status and Identity. Personality and Social Psychology Bulletin, 31(2), 1718-1729. doi: 10.1177/0146167205278261
OECD. (2017). OECD Income Distribution Database (IDD): Gini, poverty, income, Methods and Concepts. Retrieved January 17th, 2017, from OECD web site: http:// www.oecd.org/social/income-distribution-database.htm
Oishi, S., Kesebir, S., & Diener, E. (2011). Income inequality and happiness. Psychological Science, 22(9), 1095–1100. doi: 10.1177/0956797611417262
Osborne, D., & Sibley, C. G. (2013). Through Rose-Colored Glasses: System-Justifying Beliefs Dampen the Effects of Relative Deprivation on Well-Being and Political Mobilization. Personality and Social Psychology Bulletin, 39(8), 991-1004. doi: 10.1177/0146167213487997
Owuamalam, C. K., Paolini, S., & Rubin, M. (2017). Socially creative appraisals of rejection bolster ethnic migrants’ subjective well-being. Journal of Applied Social Psychology, 47(7), 366-376. doi: 10.1111/jasp.12444
Owualamam, C. K., Rubin, M., & Issmer, C. (2016). Reactions to Group Devaluation and Social Inequality: A Comparison of Social Identity and System Justification Predictions. Cogent Psychology, 3(1). doi: 10.1080/23311908.2016.1188442
Owamalam, C. K., Rubin, M., & Spears, R. (2016). The System Justification Conundrum: Re-Examining the Cognitive Dissonance Basis for System Justification. Frontiers in Psychology, 7. doi: 10.3389/fpsyg.2016.01889
Owuamalam, C. K., Rubin, M., Spears, R., & Weerabangsa, M. M. (2017). Why Do People from Low-Status Groups Support Class Systems that Disadvantage Them? A Test of Two Mainstream Explanations in Malaysia and Australia. Journal of Social Issues, 73(1), 80-98. doi: 10.1111/josi.12205
Proudfoot, D., & Kay, A. C. (2014). System justification in organizational contexts: How a Motivated preference for the status quo can affect organizational attitudes and behaviors. Research in Organizational Behavior, 34, 173-187. doi: 10.1016/j.riob.2014.03.001
Quinn, D. M. & Crocker, J. (1999). When Ideology Hurts: Effects of Belief in the Protestant Ethic and Feeling Overweight on the Psychological Well-Being of Women. Journal of Personality and Social Psychology, 77(2), 402-414. doi: 10.1037/0022-3514.77.2.402
Recchia, A. (2010). R-Squared Measures for Two-Level Hierarchical Linear Models Using SAS. Journal of Statistical Software, 32(2), 1-9. doi: 10.18637/jss.v032.c02
Schlenker, B. R., Chambers, J. R., & Le, B. M. (2012). Conservatives are happier than liberals, but why? Political ideology, personality, and life satisfaction. Journal of Research in Personality, 46, 127-146. doi: 10.1016/j.jrp.2011.12.009
Sengupta, N. K., Greaves, L. M., Osborne, D., & Sibley, C. G. (2017). The sigh of the oppressed: The palliative effects of ideology are stronger for people living in highly unequal neighbourhoods. British Journal of Social Psychology. doi: 10.1111/bjso.12192
Spitzer, R. L., Kroenke, K., Williams, J. B., & Löwe, B. (2006). A Brief Measure for Assessing Generalized Anxiety Disorder: The GAD-7. Archives of Internal Medicine, 166(10), 1092-1097. doi: 10.1001/archinte.166.10.1092
Stavrova, O. & Luhmann, M. (2016) Are Conservatives Happier than Liberals? Not Always and not Everywhere. Journal of Research in Personality, 63, 29-35. doi: 10.1016/j.jrp.2016.04.011
Ullrich, J., & Cohrs, J. C. (2007). Terrorism Salience increases System Justification: Experimental Evidence. Social Justice Research, 20(2), 117-139. doi: 10.1007/s11211-007-0035-y
UNDP. (2017a). Income Gini Coefficient. Retrieved January 17th, 2017, from UNDP web site: http://hdr.undp.org/es/content/income-gini-coefficient
UNDP. (2017b). Human Development Index. Retrieved January 17th, 2017, from UNDP web site: http://hdr.undp.org/en/content/human-development-index-hdi
van den Bos, K. (2009). The Social Psychology of Uncertainty Management and System Justification. In J. T. Jost, A. C. Kay, & H. Thorisdottir (Eds.), Social and Psychological Bases of Ideology and System Justification (pp. 185-209). Oxford: Oxford University Press.
Vargas-Salfate, S., Paez, D., Liu, J. H., Pratto, F., & Gil de Zúñiga, H. (in press). A Comparison of Social Dominance Theory and System Justification Theory: The Role of Social Status in 19 Nations. Personality and Social Psychology Bulletin.
Wakslak, C. J., Jost, J. T., & Bauer, P. (2011). Spreading rationalization: Increased support for large-scale and small-scale social systems following system threat. Social Cognition, 29(2), 288-302. doi: 10.1521/soco.2011.29.3.288
Whitson, J. A., Galinsky, A. D., & Kay, A. C. (2015). The emotional roots of conspirational perceptions, system justification, and belief in the paranormal. Journal of Experimental Social Psychology, 56, 89-95. doi: 10.1016/j.jesp.2014.09.002
Tables Table 1
Sample sizes by countries
Country Frequency
Argentina 230
Brazil 230
China 222
Estonia 562
Germany 430
Indonesia 227
Italy 481
Japan 399
South Korea 447
New Zealand 431
Philippines 111
Poland 260
Russia 422
Spain 230
Turkey 252
United Kingdom 470
Table 2
Descriptive Statistics
SWL (t1) SWL (t2) Anxiety (t1) Anxiety (t2) Depression (t1)
Depression
(t2) System Justification (t1) System Justification (t2)
M SD M SD M SD M SD M SD M SD M SD M SD
Argentina 5.1 6
1.058 5.13 0.990 3.20 1.505 3.18 1.423 2.89 1.584 2.84 1.577 2.61 1.283 2.79 1.228
Brazil 4.9
5
1.048 4.98 1.078 3.89 1.337 3.97 1.401 3.57 1.608 3.60 1.603 2.41 1.341 2.50 1.372
China
4.9
5 0.993 4.91 1.016 3.19 1.124 3.05 1.261 3.03 1.327 2.92 1.294 4.12 1.448 4.11 1.435
Estonia 4.8
6 0.990 4.86 0.991 2.90 1.243 2.75 1.192 2.65 1.266 2.55 1.284 3.58 1.197 3.62 1.196
Germany 5.1
1 1.144 5.12 1.093 3.05 1.416 3.01 1.396 2.53 1.541 2.53 1.466 3.47 1.316 3.59 1.433
Indonesia 5.2 3
1.152 5.22 1.311 3.20 1.303 3.39 1.336 3.09 1.469 3.31 1.518 3.62 1.354 3.84 1.396
Italy
4.8
Japan
4.1
2 1.150 4.14 1.179 2.68 1.318 2.63 1.317 2.51 1.548 2.40 1.509 3.58 1.023 3.59 1.078
South Korea 4.0
9 1.091 4.11 1.072 3.04 1.299 3.02 1.348 2.99 1.540 3.01 1.538 2.55 1.216 2.58 1.191
New Zealand 5.1
7 1.124 5.11 1.116 2.77 1.237 2.79 1.275 2.60 1.433 2.59 1.440 3.94 1.274 4.02 1.263
Philippines 5.0 8
1.037 5.18 1.187 2.94 1.254 2.93 1.306 2.64 1.482 2.78 1.481 3.35 1.327 3.59 1.364
Poland
4.8
0 1.095 4.74 1.031 3.55 1.458 3.53 1.431 3.26 1.656 3.31 1.580 2.67 1.164 2.69 1.178
Russia
4.7
0 1.016 4.55 1.052 3.15 1.388 3.25 1.342 2.66 1.472 2.75 1.464 3.61 1.354 3.46 1.319
Spain 5.1
3 1.065 5.18 1.046 3.28 1.461 3.29 1.517 3.05 1.558 2.97 1.545 2.58 1.240 2.61 1.249
Turkey 4.6
5
1.237 4.49 1.289 3.58 1.378 3.70 1.465 3.45 1.647 3.46 1.686 2.93 1.557 3.07 1.629
United Kingdom 5.0 6
1.122 5.02 1.137 2.86 1.506 2.79 1.492 2.64 1.625 2.63 1.618 3.56 1.367 3.65 1.397
9
United States 5.2 5
Table 3
Matrix Correlation
M SD α 1 2 3 4 5 6 7 8 9 10 11 12
1. SWL (t1) 4.85 1.147 .86
r 1
p
2. SWL (t2) 4.82 1.149 .87
r .784 1
p .000
3. Anxiety (t1) 3.10 1.384 .94
r -.397 -.345 1
p .000 .000
4. Anxiety (t2) 3.09 1.406 .94
r -.335 -.373 .719 1
p .000 .000 .000
5. Depression (t1) 2.83 1.546 .86 r -.465 -.400 .786 .601 1 p .000 .000 .000 .000
6. Depression (t2) 2.83 1.543 .87
r -.406 -.443 .610 .799 .664 1
p .000 .000 .000 .000 .000
7. SJ (t1) 3.24 1.387 .87
r .334 .296 -.19 7 -.202 -.193 -.18 6 1
p .000 .000 .000 .000 .000 .000
8. SJ (t2) 3.30 1.399 .88 r .333 .370
-.18
5 -.184 -.189 -.18
1 .723 1
p .000 .000 .000 .000 .000 .000 .000
9. Subjective Social Status (t1) 5.47 1.806
r .513 .487 -.17 7
-.135 -.225 -.19 5
.278 .297 1
10. Subjective Social Status
(t2)
5.35 1.853
r .480 .512 -.15
4
-.144 -.209 -.20
1
.257 .318 .713 1
p .000 .000 .000 .000 .000 .000 .000 .000 .000
11. Age
r .084 .087 -.26
6
-.270 -.217 -.23
1
.147 .134 -.01
8
-.062 1
p .000 .000 .000 .000 .000 .000 .000 .000 .165 .000
12. Gender
r .059 .041 .120 .119 .052 .056 -.092 -.070 -.04
4 -.027 -.113 1
p .000 .002 .000 .000 .000 .000 .000 .000 .001 .042 .000
Table 45
Multilevel linear-regressions: Satisfaction with Life Scale
Model 1 Model 2 Model 3 Model 4 Model 5 Model 6
b s.e. Z p b s.e. z p b s.e. z P b s.e. z p b s.e. z P b s.e. z p
Constant 4.83 .087 55.42 .000 4.82 .088 54.69 .000 4.82 .080 60.04 .000 4.82 .080 60.00 .000 4.82 .088 54.75 .000 4.82 .088 54.74 .000
SWL (t1) .68 .010 67.82 .000 .68 .010 67.81 .000 .68 .010 67.59 .000 .68 .010 67.82 .000 .68 .010 67.51 .000
SJ (t1) .02 .008 3.22 .001 .02 .008 3.22 .001 .02 .008 3.24 .001 .02 .008 3.22 .001 .03 .008 3.40 .001
Subjective Social Status
(t1)
.08 .006 13.48 .000 .08 .006 13.48 .000 .08 .006 13.38 .000 .08 .006 13.48 .000 .08 .006 13.47 .000
Age .00 .001 1.4 .161 .00 .001 1.41 .160 .00 .001 1.37 .171 .00 .001 1.40 .161 .00 .001 1.42 .155
Gender .02 .019 1.06 .288 .02 .019 1.08 .281 .02 .019 1.08 .281 .02 .019 1.06 .288 .02 .019 1.04 .299
Gini .02 .012 1.95 .051 .02 .012 1.95 .051
HDI -.22 1.086 -.20 .841 -.21 1.086 -.20 .845
SJ by Subjective Social
Status
.00 .004 -.79 .427 .00 .004 -.89 .374
SJ by Gini .00 .001 -1.28 .199
SJ by HDI -.09 .098 -.96 .338
Intragroup R2 .595 .595 .595 .595 .595
Intergroup R2 -.030 .150 .149 -.028 -.028
-2 Log likelihood -8926.7 -6265.786 -6264.05 -6262.86 -6265.77 -6264.94
AIC 17859.4 12547.57 12546.10 12547.72 12549.53 12551.88
BIC 17879.45 12601.03 12606.24 12621.23 12609.68 12625.39
Table 5
Multilevel linear-regressions: Anxiety
Model 1 Model 2 Model 3 Model 4 Model 5 Model 6
b s.e. z p b s.e. z p b s.e. z p b s.e. z p b s.e. z p b s.e. z p
Constant 3.15 .090 35.20 .000 3.12 .090 34.82 .000 3.12 .084 37.09 .000 3.12 .084 36.98 .000 3.12 .080 39.16 .000 3.12 .080 39.05 .000
Anxiety (t1) .68 .010 69.51 .000 .68 .010 69.50 .000 .68 .010 69.32 .000 .68 .010 69.51 .000 .68 .010 69.32 .000
SJ (t1) -.04 .010 -4.36 .000 -.04 .010 -4.36 .000 -.05 .010 -4.40 .000 -.04 .010 -4.36 .000 -.05 .011 -4.42 .000
Subjective Social Status
(t1)
-.01 .008 -1.24 .217 -.01 .008 -1.24 .217 -.01 .008 -1.19 .236 -.01 .008 -1.24 .217 -.01 .008 -1.20 .229
Age -.01 .001 -5.91 .000 -.01 .001 -5.91 .000 -.01 .001 -5.92 .000 -.01 .001 -5.91 .000 -.01 .001 -5.93 .000
Gender .06 .026 2.22 .027 .06 .026 2.24 .025 .06 .026 2.25 .024 .06 .026 2.23 .026 .06 .026 2.26 .024
Gini .02 .013 1.56 .118 .02 .013 1.57 .117
SJ by Subjective Social
Status
.00 .005 .89 .373 .00 .005 .90 .370
SJ by Gini .00 .002 -.45 .651
SJ by HDI .09 .135 .63 .529
Intragroup R2 .496 .496 .496 .496 .496
Intergroup R2 -.003 .123 .120 .217 .215
-2 Log likelihood -10197.06 -8180.97 -8179.83 -8179.35 -8178.86 -8178.27
AIC 20400.12 16377.94 16377.66 16380.69 16375.71 16378.54
BIC 20420.17 16431.4 16437.80 16454.20 16435.86 16452.06
Table 6
Multilevel linear-regressions: Depression
Model 1 Model 2 Model 3 Model 4 Model 5 Model 6
b s.e. z p b s.e. z p b s.e. Z p B s.e. z p b s.e. z P b s.e. z p
Constant 2.88 .087 33.12 .000 2.77 .095 29.29 .000 2.77 .089 31.06 .000 2.76 .089 30.89 .000 2.77 .083 33.54 .000 2.77 .083 33.37 .000
Depression (t1) .63 .012 51.1 .000 .63 .012 51.09 .000 .62 .012 50.91 .000 .63 .012 51.09 .000 .62 .012 50.91 .000
SJ (t1) -.04 .013 -2.89 .004 -.04 .013 -2.89 .004 -.04 .013 -2.94 .003 -.04 .013 -2.89 .004 -.04 .013 -3.04 .002
Subjective Social Status
(t1)
-.08 .010 -8.14 .000 -.08 .010 -8.14 .000 -.08 .010 -7.97 .000 -.08 .010 -8.14 .000 -.08 .010 -8.04 .000
Age -.01 .001 -4.93 .000 -.01 .001 -4.93 .000 -.01 .001 -4.93 .000 -.01 .001 -4.93 .000 -.01 .001 -4.96 .000
Gender -.10 .032 -3.01 .003 -.10 .032 -2.98 .003 -.10 .032 -2.97 .003 -.10 .032 -3.00 .003 -.10 .032 -2.96 .003
Gini .02 .013 1.54 .124 .02 .013 1.54 .123
SJ by Subjective Social
Status
.01 .007 1.44 .149 .01 .007 1.50 .133
SJ by Gini .00 .002 .67 .501
SJ by HDI .13 .169 .75 .454
Intragroup R2 .362 .362 .362 .362 .362
Intergroup R2 -.174 -.034 -.039 .123 .120
-2 Log likelihood -10795.38 -9474.93 -9473.81 -9472.50 -9472.49 -9471.12
AIC 21596.76 18965.85 18965.63 18967.01 18962.99 18964.23