Synthesis and Spectroscopic Characterization for
Bis (salysylaldehyde) Benzidine
Zeyad A. Saleh, Dhaidan Kh. Kafi*
Physics Department, College of Science, AL-Mustansiriyah University, Baghdad, Iraq
Abstract
In this paper, the synthesis and characterization of N, N’-Bis (salysylaldehyde) Benzidine, (C26H20N2O2) werereported. The spectroscopic investigations of the compound were studied by 1H NMR, FT-IR, UV/Vis and fluorescence
spectra techniques. The 1H NMR spectra were recorded in DMSO solution. FT-IR spectrum in solid state was observed in the
region 4000-400 cm-1. The UV/Vis absorption spectrum of the compound which dissolved in THF was recorded in the range
200-800 nm. The structural data, fundamental vibrational modes, 1H NMR isotropic chemical shifts, and UV/Vis spectrum of
the compound in the ground state were calculated using density functional theory(DFT) employing B3LYP/6-311G(d,p) basis set. Finally, a comparison between the experimental data and the calculated results appeared a good agreement.
Keywords
Bis (salysylaldehyde) Benzidine, Schiff bases, DFT, Theoretical electronic spectra, FT-IR spectra,1H NMR,Fluorescence spectra
1. Introduction
In recent years, organic photo luminescent materi-als draws the attention to researchers due to their widerange of potential applications of optical informationstorage, photo regulated molecular switches [1-3], cos-metics [4], textiles [5], organic light emitting devices(OLED) [6, 7], etc. At the same time, a photo switchableorganic fluorescent material has promising application of optoelectronic, fluorescent probe and fluorescent sensor devices working on the basis of fluorescence proper-ties and inter-conversion of chemical species under the influence of light irradiation [8-10]. Fluorescent compounds play an important role in solid state lighting, solar energy conversion and as biomarkers in the life sciences [11-12]. Fluorescence is a highly sensitive and useful method of detection that has altered the landscape of molecular biotechnology over the past few decades. An increasingly wide variety of fluorophores are used in biotechnology, genomics, immunoassays, array technologies, imaging, and drug discovery [13, 14]. Fluorescence is used as an analytical tool to determine the concentrations of various species, either neutral or ionic. When the analyte is fluorescent, direct determination is possible; otherwise, a variety of indirect methods using derivatisation, formation of a fluorescent complex or fluorescence quenching have been developed. Fluorescence sensing is the method of choice for the detection of analytes
* Corresponding author:
[email protected] (Dhaidan Kh. Kafi) Published online at http://journal.sapub.org/pc
Copyright © 2016 Scientific & Academic Publishing. All Rights Reserved
with a very high sensitivity, and often has an outstanding selectivity thanks to specially designed fluorescent molecular sensors [15-17]. Fluorescence is also a powerful tool for investigating the structure and dynamics of matter or living systems at a molecular or supramolecular level. Polymers, solutions of surfactants, solid surfaces, biological membranes, proteins, nucleic acids and living cells are well-known examples of systems in which estimates of local parameters such as polarity, fluidity, order, molecular mobility and electrical potential is possible by means of fluorescent molecules playing the role of probes [18-20]. In this paper the synthesis and efficient process for the facile production of new fluorescent schiff base compound by reaction of by the condensation benzidine and 2-Hydroxy benzylidene (salysylaldehyde). The Schiff bases called bis (2-hydroxy benzylidene) benzidine were prepared by standard methods and characterized by the determination of melting point and elemental analysis.
2. Materials and Methods
All Materials chemical used for the prepared were of Bis (salysylaldehyde) Benzidine. Benzidine (Fluka, Germany) with a stated purity of 99%, salysylaldehyde from sigma Chemical Co. (USA), all solvents like DMSO, benzene, THF, and Ethanol were of high purity and were used without further purification.
2.1. Synthesis
(3-4) drops of glacial acetic acid. This mixture was refluxed on water bath during 10-12 hrs. A product mass separated out on cooling, was filtered off. Chamical reaction is represented in Fig. 1 for same.
Figure 1. Prepration of Bis (salysylaldehyde) benzidine
3. Experimental Details
The Experimental spectroscopic investigations of the compound were studied by 1H NMR, FT-IR, UV/Vis and
fluorescence spectra techniques. Below is a description of these techniques.
3.1. FT-IR Spectrum
Fourier transform-infrared (FT-IR) measurements were carried out by the KBr method using a Shimadzu corporation 8400S FTIR spectrometer. FT-IR spectra are generated by the absorption of electromagnetic radiation in the frequency range 4000–400 cm-1.
3.2. UV–Vis Spectrum
All UV/Vis spectrum of the compound has been recorded in the region of 200–800 nm using a Perkin Elmer Lambda 35 UV–Vis spectrometer.
3.3. 1H NMR Spectrum
1H NMR spectrum was recorded (299K) on AV300 MHz
spectrometer. The compound was dissolved in DMSO. Chemical shifts were reported in ppm relative to tetramethylsilane (TMS) for 1H NMR. 1H NMR spectrum
was obtained at a base frequency of 300 MHz.
3.4. Florescence Measurements
A Shimadzu RF-5301PC spectrofluorophotometer was used in florescence measurements. Emission spectra of were obtained in THF solvents with the concentration of 2×10⁻⁵ M.
3.5. Computational Methods
The molecular geometry, with no symmetry constrains,
was optimized by Gaussian 09 package using density functional theory (DFT) calculations with a hybrid functional B3LYP (Becke's three parameter exchange functional combined with the LYP gradient corrected correlation functional) at the basis set 6-311G(d.p) by the Berny method [21] to characterized all stationary points as minimam. The calculated vibrational frequencies ascertained that the structure was stable (no imaginary frequency). TD-DFT method is usually found to be a strong and accurate method for describing low-lying excited states of conjugated molecules and has consequently been applied to solve countless chemical and physical problems. Based on the optimized geometry and by using time-dependent density functional theory (TD-DFT) methods in vacuum, the allowed excitation and oscillator strengths of electronic absorption spectrum were predicted. Finally the Nuclear Magnetic Resonance (NMR) chemical shifts were performed using Gauge Independent Atomic Orbital (GIAO) method [22, 23].
4. Results and Discussion
4.1. Solubility and Structure of Bis (salysylaldehyde) Benzidine
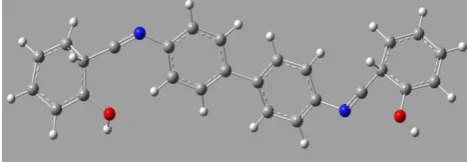
Figure 2. is Molecular structure and numbering scheme of Bis (salysylaldehyde) benzidine. The melting point of the title compound is determined, it was value 210°C. Physical, Characteristics and analytical data of the compound is given in the Table 1.
Figure 2. Molecular structure and numbering scheme of Bis (salysylaldehyde) benzidine
Table 1. Details of Physical characterization Name of the compound Bis (salysylaldehyde) benzidine
Molecular formula C26H20N2O2
Colour Yellow
M.P. 210oC
RF 0.64
Solubility THF,DMF, DMSO
4.2. Infrared Spectra
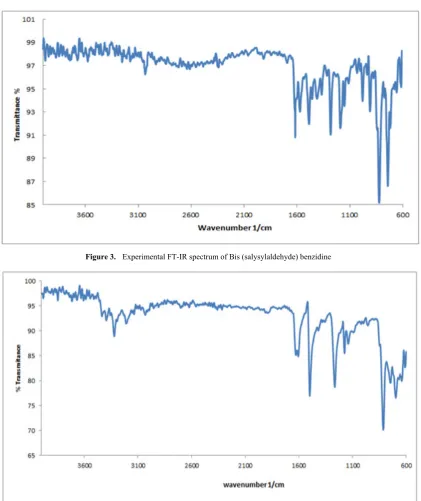
The FT-IR spectrum of Bis (salysylaldehyde) benzidine is shown in Fig. 3. This spectrum confirms the proposed structure. After the condensation reaction the new peak at 1616 cm−1 indicating imine (CH=N) bond appearsthese
fig.4.disappear in the FT-IR spectrum of Bis (salysylaldehyde) benzidine. The peak values of –OH, aromatic C-H, aromatic and C=C vibrations are seen at 3575, 3028, 1568 cm−1, respectively, these data are in good
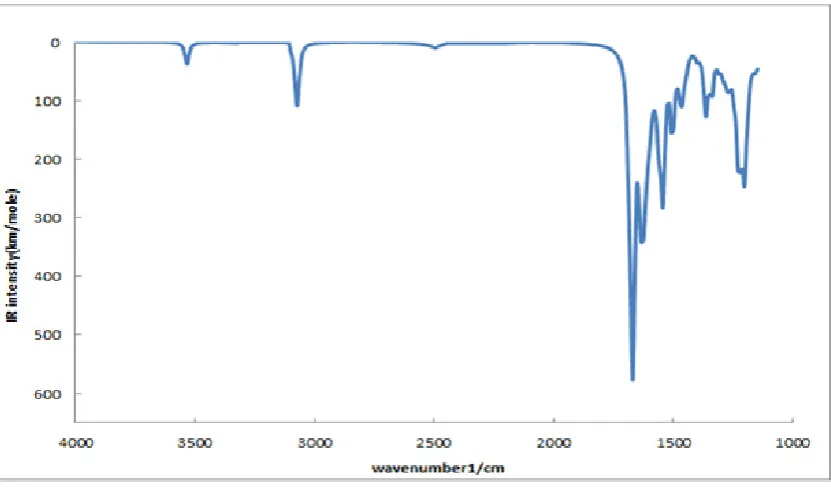
agreement with [25, 26]. For visual comparison, the simulated and observed FTIR spectra of the title compound at DFT/B3LYP level using 6-311G(d,p) basis set are given in Figure 5. Theoretical and Experimental FTIR spectroscopy for bis(salysylaldehyde) benzidine are listed in table 2. The observed vibrational frequencies of fundamental modes of Bis (salysylaldehyde) benzidine agree with with the simulated IR frequencies.
Table 2. Theoretical and Experimental FTIR spectroscopy for bis(salysylaldehyde) benzidine
Compounds υ(OH) υ(HC=N) (NH2) υ(C-H) υ(C=C)
Benzidine 3583 1604 3317 3024 1500
Experimental of bis(salysylaldehyde)
benzidine 3575 1616 - 3028 1568
Theoretical of bis(salysylaldehyde)
benzidine 3532 1696 - 3073 1542
Figure 3. Experimental FT-IR spectrum of Bis (salysylaldehyde) benzidine
Figure 5. Theoretical FT-IR spectrum of Bis (salysylaldehyde) benzidine
Figure 6. Experimental 1H NMR of synthesized compound in DMSO solvent
4.3. NMR Spectrum for the Bis (salysylaldehyde) Benzidine
Experimental 1H-NMR spectra of Bis (salysylaldehyde)
benzidine are given in Fig.6. The structure of Schiff bases is also confirmed by these spectra. NMR spectral data are summarized as follows: 1H NMR/DMSO/δ ppm: The proton
signals at 3.9, 6-8 and 8.8 ppm are due to the solvent,
aromatic protons and azomethine (-CH=N-) proton respectively, the proton signal around 12,3 ppm forphenolic (-OH) proton. these data agree with theoretical 1H-NMR
4.4. UV/Vis Spectrum
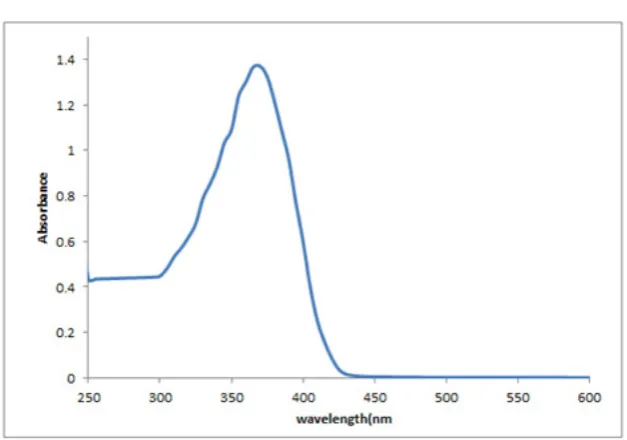
Quantum chemical computations were carried out to further investigate the electronic properties of title compound. The TD-DFT/B3LYP method using 6-311G(d,p) basis set, has been used to determine the excited states for investigate the UV-Vis absorption spectra of the title compound. The experimental and theoretical UV-Vis absorption spectra of the title compound are shown in Figure 8. As can be seen from the figure, electronic absorption spectrum of the title compound shows one band at 375 nm. From TD-DFT(C-PCM) /B3LYP calculation, the theoretical absorption bands are predicted at 390 nm at 6-311G(d,p) basis set and as well as can easily be seen that data is the closest with compared to the experimental absorption bands.
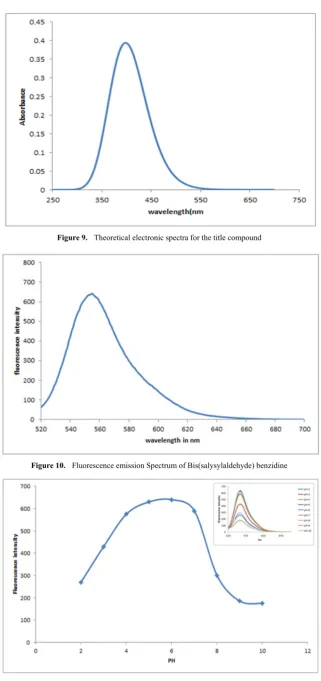
4.5. Florescence Characteristics
The fluorescence spectra of Bis (salysylaldehyde) benzidine in THF solvent with the concentration of 2×10⁻⁵
M. (Fig.10) were obtained at pH 6 and room temperature. Free reagent in aqueous solution shows an emission peak at 553 nm when excited at 400 nm. The fluorescence intensity was rather good, this is due to synthesized Organic compound typically consist of interconnected aromatic ringed structures with salysylaldehyde attached around the core structure, conjoining multiple ringed structures increases the density of states and allows for a lower band gap material, allowing electronic HOMO/LUMO excitation at lower energies [27].
Figure 7. Theoretical 1H NMR of synthesized compound
Figure 9. Theoretical electronic spectra for the title compound
Figure 10. Fluorescence emission Spectrum of Bis(salysylaldehyde) benzidine
4.6. Effect of pH on Fluorescence Spectral Properties
The fluorescence intensity of the System is affected greatly by the acidity of the medium [28]. The effect of pH on the spectral properties of Bis(salysylaldehyde) benzidine was investigated in aqueous medium by HCl and NaOH at room temperature (shown in Fig.11). The molecule can exist in the following forms at different pH: (i) High and stable form at pH = 5 to 7, (ii) Low form at pH = 8 to 10 and (iii) middle form at pH = 2 to 5. It can be seen that the fluorescence intensity increases with increasing of pH from 2 to 5 and then the intensity remains constant up to pH=5-7. Finally decreases up to pH=10, best value for Fluorescence intensity at ph=6, this mean that quantum efficiency be very good in this point.
5. Conclusions
The A new Schiff base Bis (salysylaldehyde) benzidine was synthesized. Characterization of the title compound was made by FT-IR, UV-vis, fluorescence spectra and NMR techniques. Theoretical calculation of FT-IR, UV-vis, and NMR using DFT/B3LYP method with 6-311G(d,p) basis set. Fluorescence intensity of compound in THF solvent was determined. The effect of pH on the Fluorescence intensity It was clear, the best value for Fluorescence intensity at pH = 5 to 7. This change in the value of the acidic lead to increased quantum efficiency.
REFERENCES
[1] G. Ashkenazi, D.R. Ripoll, N. Lotan, H.A. Scheraga, A molec-ular switch for biochemical logic gates: conformational studies,Biosens. Bioelectron. 12 (2009) 85–95.
[2] V.S. Elanchezhian, M. Kandaswamy, A ferrocene-based multi-signaling sensor molecule functions as a molecular switch, Inorg. Chem. Commun. 12 (2009) 161–165.
[3] S.M. Dirk, D.W. Price, S. Chanteau, D.V. Kosynkin, J.M. Tour,Accoutrements of a molecular computer: switches, memory com-ponents and alligator clips, Tetrahedron 57 (2001) 5109–5121.
[4] M.P. Bousquet, R.M. Willemot, P. Monsan, E. Boures, Lipase-catalyzed -butylglucoside lactate synthesis in organic solventfor dermo-cosmetic application, J. Biotechnol. 68 (1998) 61–69.
[5] N. Sarier, E. Onder, Organic phase change materials and theirtextile applications: an overview, Thermochim. Acta 540 (2012)7–60.
[6] B.M. Medina, J. Gierschner, Computational design of lowsinglet–triplet gap all-organic molecules for OLED application, Org. Electron. 13 (2012) 985–991.
[7] A.K. Havare, M. Can, S. Demic, S. Okur, M. Kus, H. Aydin, N. Yagmurcukardes, S. Tari, Modification of ITO surface using aromatic small molecules with carboxylic acid groups
for OLED applications, Synth. Met. 161 (2011) 2397–2404. [8] L. Chen, G. Wang, X. Zhao, A fluorescence switch based on
acontrollable photochromic naphthopyran group, J. Lumin. 131(2011) 1617–1620.
[9] Z. Dong, X. Tian, Y. Chen, J. Hou, J. Ma, Rhodamine groupmodified SBA-15 fluorescent sensor for highly selective detectionof Hg2+ and its application as an INHIBIT
logic device, RSC Adv.3 (2013) 2227–2233.
[10] Z. Dong, X. Le, P. Zhou, C. Dong, J. Ma, An “off–on–off” flu-orescent probe for the sequential detection of Zn2+ and
hydrogensulfide in aqueous solution, New J. Chem. 38 (2014) 1802–1808.
[11] Geddes, C. D. et al., Metal-Enhanced Fluorescence (MEF) Due to Silver Colloids on a Planar Surface: Potential Applications of Indocyanine Green to in Vivo Imaging, J. Phys.Chem. A. 107, 3443–3449 (2003).
[12] Aslan, K., Gryczynski, I., Malicka, J., Lakowicz, J.R. Geddes, C.D., Metal-Enhanced Fluorescence: An Emerging Trend in Biotechnology, Curr. Opin. Biotechnol. 16, 55–62 (2005). [13] E. Horiguchi, K. Shirai, J-y. Jaung, M. Furusyo, K. Takagi
and M. Matsuoka, Dyes Pigm., 2001, 50, 99.
[14] L. Zhiwei, Y. Qiwu, C. Ruixiang, M. Guochun, C. Mingxi and Z. Wenqin, Dyes Pigm., 2011, 88, 307.
[15] T. Lijun and L. Minghui, J. Chem. Res., 2011, 35, 465. [16] S.H. Kim, B. Kim, V.K. Yadavalli and M.V. Pishko, Anal.
Chem., 2005, 77, 6828.
[17] J. Zguris and M.V. Pishko, Sens. Lett., 2005, 3, 206.
[18] F. Szajdzinska-Pietek, M. Wolszczak and A. Plonka, S.J. Schlick, J. Am.Chem. Soc., 1998, 120, 4215.
[19] J.Y. Ye, M.T. Myaing, T.B. Norris, T.P. Thomas and J.R. Baker, OpticsLetters, 2002, 27, 1412.
[20] C.S. Mitsiades, N.S. Mitsiades, T.T. Bronson, D. Chauhan, N. Munshi, S.P. Treon, C.A. Maxwell, L. Pilarski, T. Hideshima, R.M. Hoffman and K.C. Anderson, Cancer Res., 2003, 63, 6689.
[21] C. Peng, P.Y. Ayala, H.B. Schlegel, M.J. Frisch, 1996, Using redundant internal coordinates to optimize equilibrium geometries and transition states, J. Comput. Chem. 17 (1), 49-56.
[22] M.J. Frisch, J.A. Pople, J.S. Binkley, 1984, " Self-Consistent molecular orbital methods25: supplementary function for Gaussian basis sets," J. Chem. Phys., 80 (7), 3265–3269. [23] R. Ditchfield, "Self-consistent perturbation theory of
diamagnetism. I. A Gauge-Invariant LCAO (Linear Combination of Atomic Orbitals) method for NMR chemical shifts," Mol. Phys., 27 (1974) 789–807.
[24] Mehmet Yıldırım, Ismet Kaya” Synthesis of a Novel Fluorescent Schiff Base as a Possible Cu(II) Ion Selective Sensor” J Fluoresc (2010) 20:771–777.
[25] R.M. Silverstein, F.X. Webster, Spectroscopic Identification of Organic Compound, sixth ed., John Willey & Sons, New York, 1998.
Govindarajan, 2009, "FTIR and FT Raman spectra, vibrational assignments, ab initio, DFT and normal coordinate analysis of α,α dichlorotoluene," Spectrochim. Acta, 73A(2), 277-280.
[27] R. Yuste, "Fluorescence microscopy today," Nat Meth, vol. 2, pp. 902-904, 12//print 2005.