BOSNIAN JOURNAL OF BASIC MEDICAL SCIENCES 2011; 11 (2): 124-128Abstract
Tissue velocity imaging (TVI) and strain rate imaging (SRI) were recently introduced to quantify myocardial mechanical activity in patients receiving cardiac resynchronization therapy. To clear whether atrial-demand-based (AAI) (R) atrial pacing can fully simulate the electro-mechanical conduction of physiological state and to clarify which one is more appropriate for the assessment of electroelectro-mechanical activity of the heart between TVI and SRI, normal subjects and patients with sick sinus syndrome (SSS) before and after AAI(R) pacemaker implantation (PI) were investigated in this study. Th e results showed that the time intervals (ms), P-SRa assessed by SRI (not P-Va assessed by TVI) prolonged step by step from the lateral wall of the right atrium (RA), the interatrial septum (IAS) and the left atrium (LA) in normal subjects(.±., .±. and .±., p<.). P-Va and P-SRa did not diff er at the RA, IAS and LA in patients with SSS before PI (p>.), and they were signifi cant longer than those of normal subjects (p<.). However, they shortened to normal levels in patients with SSS after PI and P-SRa showed again the trend of gradually prolonging from the RA, IAS to LA. At the same time, the peak velocities and the peak strain rates during atrial contraction also returned to normal values from lower levels. Th ese data suggested that AAI(R) atrial pacing can successfully reverse the abnormal interatrial electromechanical conduction in patients with SSS, and SRI is more appropriate for the assess-ment of the electromechanical activity of atrial wall than TVI. © Association of Basic Medical Sciences of FBIH. All rights reserved
KEY WORDS: sick sinus syndrome, atrial pacing, electromechanical conduction, tissue velocity imaging, strain rate imaging
in the assessment of interatrial electromechanical
conduction in patients with sick sinus syndrome
before and after pacemaker implantation
Xiaozhi Zheng1, Ping Ji1, Hongwei Mao1, Jianqun Hu2*
1 Department of Ultrasound, The Fourth Affi liated Hospital of Nantong University (The First People’s Hospital of Yancheng), Yancheng
224006, Jiangsu Province, P. R. China. 2 Department of Ultrasonic Diagnosis, The First Affi liated Hospital with Nanjing Medical University
(Jiangsu Province Hospital), Nanjing 210029, Jiangsu Province, P. R. China
INTRODUCTION
To maintain sinus rhythm and to synchronize the cardiac contraction and relaxation is an essential condition for a normal pump function. When myocardial damage exists, such as degeneration, fi brosis, infl ammation, ischemia and infarction, some electrical or/and mechanical dyssynchrony may occur, which often results in an irregular heart rhythm, an unstable hydrodynamics and an abnormal blood circula-tion. Sick sinus syndrome (SSS) is a syndrome of a variety of arrhythmias and multiple symptoms, which is due to the original organic diseases of sinus node or its surrounding tis-sues that cause the formation of sinus node impulse disorder, or sinus node to the atrial impulse conduction disturbances. To change the situation mentioned above, cardiac pace-makers have been used in clinic since about fi fty years ago.
Researchers are making their eff orts to gain the best physi-ological effects from optimizing different pacing modes, including atrioventrieular synchronization, cardiac chro-notropic pacing and ventricular synchronization. Atrial-demand-based (AAI) atrial pacing meets the physiological characteristics of cardiac pumping, which is mainly applied to patients with SSS (who have no atrioventricular block). Th is is equivalent to an implantation of artifi cial sinus node
for the patients. It has been reported that the incidence of atrial fibrillation, thrombus and heart failure is lower in AAI pacing than ventricular -demand-based (VVI) and DDD pacing mode []. Furthermore, the single lead atrial pacing mode, AAI(R) in SSS is mostly safe also in the long term compared to DDD(R) and VVI(R) []. In patients with SSS, DDD(R)-pacing, but not AAI(R)-pacing induces sig-nifi cant LV desynchronization and reduction of LVEF []. To our knowledge, the normal interatrial electrical impulse originates from the sinus node, transmit to right atrium (RA), interatrial septum (IAS) and left atrium(LA) in or-der. It is not clear whether AAI (R) atrial pacing can fully simulate the electromechanical conduction of physiologi-cal state, because mechaniphysiologi-cal dyssynchrony does not always * Corresponding author: Jianqun Hu,
Department of Ultrasonic Diagnosis, The First Affi liated Hospital with Nanjing Medical University (Jiangsu Province Hospital), 300 Guangzhou Road, Nanjing 210029, Jiangsu Province, P.R.China Tel:+86 025 83718836; Fax: +86 025 83780862
e-mail: [email protected]
BOSNIAN JOURNAL OF BASIC MEDICAL SCIENCES 2011; 11 (2): 125-128
correlate with electrical dyssynchrony []. Tissue velocity imaging (TVI) and strain rate imaging (SRI) were recently introduced to quantify mechanical dyssynchrony of the atria and ventricle in patients receiving cardiac resynchroniza-tion therapy [-]. But which one is more appropriate for the assessment of mechanical activity of the heart has not been clarifi ed. In this study, a comparison of TVI and SRI for the assessment of interatrial electromechanical conduc-tion was done in normal subjects and patients with SSS before and after AAI(R) pacemaker implantation (PI), in order to fi nd a simple, objective and repeatable method to assess the therapeutic eff ect of AAI(R) cardiac pacemaker.
MATERIALS AND METHODS
Study Population
Th e study was approved by the local human research ethics committee and free informed consent was obtained from all the subjects. Th irty-one patients (mean age: . ± . years, range: - years) who accepted AAI(R) pacemaker im-plantation participated in this study during the period from August to July . Th ey all met the clinical inclusion
criteria (syncope, dizzy spells or heart failure) and the elec-trocardiographic criteria [(sinus arrest > s, tachy-brady syn-drome with sinus pauses > s or sinus bradycardia (beats/ min in awake hour] without atrioventricular/bundle branch block and atrial fi brillation. Th irty normal subjects (mean age: . ± . years, range: - years) were enrolled in the study. Th e inclusion criteria were absence of any history of disease
at any of the examined organs, assessed by subject’s his-tory, clinical symptoms, electrocardiogram, laboratory data, radiology, echocardiography and computer tomography.
Echocardiographic protocol
Echocardiographic examinations were done within hours before pacemaker implantation and after days using a commercially available ultrasonic system (Vivid ; Gen-eral Electric Medical Systems, Milwaukee, WI, USA) with a harmonic .-. MHz variable frequency phased array transducer. Th is ultrasonic system was equipped with a Q-analyze quantitative analysis software for the TVI and SRI. All the subjects were lying in left lateral decubitus position with the electrocardiography recorded simultaneously. First of all, the standard apical four-chamber view was obtained.
Normal SSS before PI SSS after PI
P-Va(ms) P-SRa (ms) P-Va(ms) P-SRa (ms) P-Va(ms) P-SRa (ms) RA 40.02±14.14 5.01±0.62 175.29±63.22a 148.68±56.57a 44.78±13.26b 9.04±2.83b
IAS 35.13±7.07 17.05±3.54d 178.13±65.39a 139.54±62.83a 36.13±15.17b 25.30±17.41b,d
LA 55.02±13.04c 45.09±12.26d 179.02±73.04a 180.09±70.73a 52.02±13.04b,c 55.09±12.26b,d TABLE 1. Time intervals from initiation of the P wave on the electrocardiogram to peak velocity (P-Va) and to peak strain rate (P-SRa) at mid segments of lateral wall of the left atrium (LA) and right atrium (RA) and the interatrial septum (IAS) in the apical four-chamber view in normal subjects (Normal) and the patients with sick sinus syndrome (SSS) before and after pacemaker implantation (PI).
ap<0.01 compared to normal, bp<0.01 compared to SSS before PI, cp<0.05 compared to the values of RA in the same group, dp<0.01 compared to the values of
RA in the same group.
FIGURE 1. Measurement methods of time intervals. The image was obtained from the apical four-chamber view of the heart of a normal subject. The time interval (P-Va) was measured from the initiation of the P wave on the electrocardiogram to peak velocity during atrial contraction (A), and the time interval (P-SRa) was measured from the initiation of the P wave on the electrocardiogram to peak strain rate during atrial contraction (B). The measurement sites were at mid segments of lateral wall of the left atrium,right atrium and the interatrial septum, respectively.
BOSNIAN JOURNAL OF BASIC MEDICAL SCIENCES 2011; 11 (2): 126-128 Th en, the TVI and SRI function were activated and theirdy-namic images of three cardiac cycles were stored at a frame rate of frames per second for subsequent analysis. In this process, gains were adjusted at the minimal optimal level to minimize noise, and the fi lter settings were kept low ( Hz). Finally, a region of interest was placed at mid segments of lateral wall of the right atrium (RA), left atrium (LA) and the interatrial septum (IAS), respectively. Th e peak velocities (Va) and the peak strain rates (SRa) during atrial contraction were measured with reference to the P wave on the electro-cardiogram during ventricular late diastole (atrial contrac-tion). Th e time interval (P-Va) was measured from the initia-tion of the P wave on the electrocardiogram to peak velocity during atrial contraction, and the time interval (P-SRa) was measured from the initiation of the P wave on the electro-cardiogram to peak strain rate during atrial contraction (Fig-ure ). All values for each parameter were obtained by aver-aging measurements from three successive cardiac cycles.
Reproducibility
Intraobserver variability was assessed in subjects by re-peating the measurements on two occasions ( days apart) under the same basal conditions. To test the interobserver variability, the measurements were performed on the same subject by a second observer who was unknown of the fi rst observer’s results. Variability was calculated as the mean
percentage error, derived as the diff erence between the two sets of measurements, divided by the mean observations.
Statistical Analysis
Data were expressed as the mean±SD. Differences be-tween the mean values of the two groups were ana-lyzed by unpaired t-test. Differences were consid-ered significant at p<.. SPSS version . (SPSS, Chicago, IL, USA) was used for all statistical analysis.
RESULTS
Time intervals are shown in Table and Figure . As as-sessed by TVI, the P-Va intervals were longer at mid seg-ment of lateral wall of the LA than at the RA and the IAS, and no diff erences were found between the P-Va intervals of RA and IAS in normal subjects. However, as assessed by SRI, the P-SRa interval at mid segment prolonged step by step from the RA, IAS to LA in these healthy individuals. In patients with SSS before PI, no significant differences were found for any time intervals among atrial walls or IAS, no matter assessed by SRI or TVI. All time inter-vals were significant longer than that of normal subjects. In patients with SSS after PI, both P-Va and P-SRa in-tervals shortened to normal levels, or were closed to normal levels. The tendency of prolong progressively
Normal SSS before PI SSS after PI Va (cm/s) SRa (1/s) Va (cm/s) SRa (1/s) Va (cm/s) SRa (1/s) RA -5.97±2.87 -2.96±0.88 -4.37±1.91a -1.57±1.03a -6.13±2.48 -2.65±0.97b
IAS -4.55±2.71 -1.65±0.33c -3.06±1.64a -1.21±0.29a,c -4.89±2.92 -1.59±0.42b,c
LA -6.11±2.16 -3.08±1.21 -4.34±1.72a -1.73±0.95a -6.43±2.69 -2.78±1.43b TABLE 2. Peak velocities (Va) and peak strain rates(SRa) during atrial contraction at mid segments of lateral wall of the left atrium(LA), right atrium (RA) and the interatrial septum (IAS) in the apical four-chamber view of normal subjects (Normal) and the patients with sick sinus syndrome (SSS) before and after pacemaker implantation(PI)
ap<0.05 compared to normal, bp<0.05 compared to SSS before PI, cp<0.05 compared to the values of RA in the same group
FIGURE 2. Comparison of time intervals among the mid segments of lateral wall of the left atrium(LA), right atrium (RA)and the interatrial septum (IAS) in normal subjects (Normal) and the patients with sick sinus syndrome (SSS) before and after pacemaker implantation (PI)
assessed by tissue velocity imaging (A) and strain rate imaging (B). (*p<0.05, **p<0.01).
BOSNIAN JOURNAL OF BASIC MEDICAL SCIENCES 2011; 11 (2): 127-128
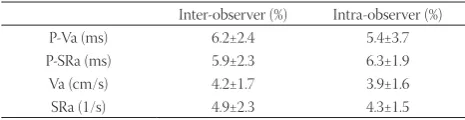
of P-SRa intervals from RA, IAS to LA showed again. Peak velocities and peak strain rates are shown in Table . The peak velocities and peak strain rates of atrial walls or IAS were lower in patients with SSS before PI than in normal subjects. But the patients with SSS after PI and the normal subjects did not diff er at these variables. No signifi -cant diff erences among atrial walls or IAS were found for any peak velocities in the normal subjects, patients with SSS before PI and after PI. Of interest, the peak strain rates were all smaller at mid segment of the IAS than at the RA and the LA in the normal subjects and patients with SSS. Th e inter-and intra-observer measurement repeatability are
presented in Table . Intraobserver and interobserver vari-ability for P-Va, P-SRa, Va and SRa were all smaller than .
DISCUSSION
Our results showed that time intervals were signifi cant longer in patients with SSS before PI than those of normal subjects, and they did not diff er at the RA, IAS and LA. However, they shortened to normal levels in patients with SSS after PI and prolonged step by step from the RA, IAS to LA. Th is is en-tirely consistent with normal interatrial electromechanical conduction mode. At the same time, the peak velocities and the peak strain rates during atrial contraction also returned to normal values from lower levels. Th ese fi ndings demon-strates that AAI(R) atrial pacing can successfully reverse the abnormal interatrial electromechanical conduction in patients with SSS, by fully simulating the interatrial electro-mechanical conduction of physiological state. Meanwhile, it can eff ectively improve the atrial myocardial contraction and deformation in patients with SSS. Th is can also partly ex-plain the lower incidence of atrial fi brillation, thrombus and heart failure in AAI pacing than VVI and DDD pacing mode. TVI is a developed technique for the quantification of re-gional myocardial motion by measuring its velocity and di-rection []. But TVI is angle-dependent, and overall heart motion, rotation and contraction of adjacent myocardial segments influence the measurement of regional velocity []. SRI has been recently developed for the quantifi cation of regional myocardial deformation by estimating spatial
gradients in myocardial velocities. In our study, although no significant difference was found between the ability of TVI and SRI to assess the mechanical function (peak veloc-ity and strain rate) of atrial wall, the process of interatrial electromechanical conduction (the change of time inter-vals) was only well assessed by SRI (not by TVI). SRI is more sensitive for the assessment of the time intervals of atrial wall than TVI. Th is is maybe because SRI can overcome the influence of adjacent myocardial segments to objectively reflect the myocardial movement characteristics [-]. In our study, the longitudinal motion of the atrial wall and IAS was gained from the apical four-chamber view. On ac-count of the infl uence of tethering and the motion of ven-tricular segments, the atrial segments adjacent to the mitral or tricuspid annulus had not been chosen, although these segments always have highest velocities or strain rates [,]. In addition, we found an interesting thing, i.e. the peak strain rates during atrial contraction were all smaller at mid segment of the IAS than at the RA and the LA in the normal subjects and patients with SSS. We speculate the special structure of IAS (combination of fibrous and muscular tissue) can partly account for this finding [].
CONCLUSION
This study has demonstrated the ability of TVI and SRI in evaluation of interatrial electromechanical conduc-tion in patients with SSS before PI and after PI. AAI(R) atrial pacing can successfully reverse the abnormal in-teratrial electromechanical conduction in patients with SSS. SRI is sensitive both for the assessment of the time intervals and the regional mechanical function of atrial wall, which is more appropriate than TVI for the assess-ment of the therapeutic eff ect of AAI(R) cardiac pacemaker.
ACKNOWLEDGMENTS
This work was partly supported by Yancheng second batch of health science and technology projects, Jiangsu province, P.R.China (Grant No.YK). The authors gratefully acknowledge technical assistance and help-ful discussion of Xia Enhui, Jiang XL, Lin L,Wang JW, Qiao XL at the department of ultrasound, The First Peo-ple’s Hospital of Yancheng, Jiangsu Province, P.R.China.
DECLARATION OF INTEREST
Th e authors have no confl ict of interest to declare.
Inter-observer (%) Intra-observer (%) P-Va (ms) 6.2±2.4 5.4±3.7 P-SRa (ms) 5.9±2.3 6.3±1.9 Va (cm/s) 4.2±1.7 3.9±1.6 SRa (1/s) 4.9±2.3 4.3±1.5
BOSNIAN JOURNAL OF BASIC MEDICAL SCIENCES 2011; 11 (2): 128-128REFERENCES
[] Xue-Jun R, Zhihong H, Ye W, Huifeng D, Jinrong Z, Fang C, et al. A clinical comparison between a new dual-chamber pacing mode-AAIsafeR and DDD mode. Am J Med Sci ; :-. [] Wunderlich E, Schindler H, Hetze A, Wunderlich C. Maintenance
of AAI (R) mode at the time of generator replacement. Herzschrit-tmacherther Elektrophysiol ; : -.
[] Albertsen AE, Nielsen JC, Poulsen SH, Mortensen PT, Pedersen AK, Hansen PS, et al. DDD(R)-pacing, but not AAI(R)-pacing in-duces left ventricular desynchronization in patients with sick sinus syndrome: tissue-Doppler and D echocardiographic evaluation in a randomized controlled comparison. Europace ;:-. [] Bader H, Garrigue S, Lafi tte S, Reuter S, Jaïs P, Haïssaguerre M, et al.
Intra-left ventricular electromechanical asynchrony. A new inde-pendent predictor of severe cardiac events in heart failure patients. J Am Coll Cardiol ; :-.
[] Sogaard P, Egeblad H, Kim WY, Jensen HK, Pedersen AK, Kris-tensen Bo, et al. Tissue Doppler imaging predicts improved systolic performance and reversed left ventricular remodeling during long-term cardiac resynchronization therapy. J Am Coll Cardiol ; :-.
[] Lamia B, Tanabe M, Kim HK, Johnson L, Gorcsan J rd, Pinsky MR.
Quantifying the role of regional dyssynchrony on global left ven-tricular performance. JACC Cardiovasc Imaging ; :-. [] Cho GY, Jo SH, Kim MK, Kim HS, Park WJ, Choi YJ, et al. Left atrial dyssynchrony assessed by strain imaging in predicting future development of atrial fi brillation in patients with heart failure. Int J Cardiol ;: -.
[] Sakabe K, Fukuda N, Fukuda Y, Morishita S, Shinohara H, Tamura Y. Relation of gender and interatrial dyssynchrony on tissue Dop-pler imaging to the prediction of the progression to chronic atrial fi brillation in patients with nonvalvular paroxysmal atrial fi brilla-tion. Heart Vessels ; :-.
[] Boyd AC, Schiller NB, Ross D L, Th omas L. Segmental atrial con-traction in patients restored to sinus rhythm after cardioversion for chronic atrial fi brillation: a colour Doppler tissue imaging study. Eur J Echocardiogr ; :-.
[] D'hooge J, Heimdal A, Jamal F, Kukulski T, Bijnens B, Rademak-ers F, et al. Regional strain and strain rate measurements by cardiac ultrasound: principles, implementation and limitations. Eur J Echo-cardiogr ;:-.
[] Kowalski M, Kukulski T, Jamal F, D'hooge J, Weidemann F, Rade-makers F, et al. Can natural strain and strain rate quantify regional myocardial deformation? A study in healthy subjects. Ultrasound Med Biol ;:-.
[] Saraiva RM, Demirkol S, Buakhamsri A, Greenberg N, Popović ZB, Th omas JD, et al. Left atrial strain measured by two-dimensional speckle tracking represents a new tool to evaluate left atrial func-tion. J Am Soc Echocardiogr ; :-.
[] Thomas L, Levett K, Boyd A, Leung DY, Schiller NB, Ross DL. Changes in regional left atria function with aging evaluation by Doppler tissue imaging. Eur J Echocardiography ; :-. [] Sirbu C, Herbots L, D'hooge J, Claus P, Marciniak A, Langeland T,