1535-9778/06/$08.00⫹0 doi:10.1128/EC.5.1.45–53.2006
Copyright © 2006, American Society for Microbiology. All Rights Reserved.
ATP Synthase Is Responsible for Maintaining Mitochondrial
Membrane Potential in Bloodstream Form
Trypanosoma brucei
Silvia V. Brown, Paul Hosking, Jinlei Li, and Noreen Williams*
Department of Microbiology and Immunology and Witebsky Center for Microbial Pathogenesis and Immunology, 253 Biomedical Research Building, University at Buffalo, Buffalo, New York 14214
Received 25 July 2005/Accepted 4 November 2005
The mitochondrion ofTrypanosoma bruceibloodstream form maintains a membrane potential, although it lacks cytochromes and several Krebs cycle enzymes. At this stage, the ATP synthase is present at reduced, although significant, levels. To test whether the ATP synthase at this stage is important for maintaining the mitochondrial membrane potential, we used RNA interference (RNAi) to knock down the levels of the ATP synthase by targeting the F1-ATPase ␣and subunits. RNAi-induced cells grew significantly slower than uninduced cells but were not morphologically altered. RNAi of thesubunit decreased the mRNA and protein levels for thesubunit, as well as the mRNA and protein levels of the␣subunit. Similarly, RNAi of␣subunit decreased the␣subunit transcript and protein levels, as well as the-subunit transcript and protein levels. In contrast,␣andRNAi knockdown resulted in a 60% increase in the F0complex subunit 9 protein levels without a significant change in the steady-state transcript levels of this subunit. The F0–32-kDa subunit protein expression, however, remained stable throughout induction of RNAi for␣orsubunits. Oligomycin-sensitive ATP hydrolytic and synthetic activities were decreased by 43 and 44%, respectively. Significantly, the mito-chondrial membrane potential of␣andRNAi cells was decreased compared to wild-type cells, as detected by MitoTracker Red CMXRos fluorescence microscopy and flow cytometry. These results support the role of the ATP synthase in the maintenance of the mitochondrial membrane potential in bloodstream formT. brucei.
The mitochondrial ATP synthase couples the electrochem-ical proton gradient to the synthesis or hydrolysis of ATP (5, 11, 26, 39). The ATP synthase is composed of the soluble F1
moiety, which contains the catalytic sites and the membrane-bound F0 moiety, which is involved in proton translocation.
The F1 moiety of the mitochondrial ATP synthase is highly
conserved and is composed of five subunits present in a stoi-chiometry of␣33␥1␦1ε1. The F0moiety inEscherichia coliis
composed of three subunits, a1b2c10-14, but in eukaryotes its
subunit composition increases in complexity to include up to eight additional subunit types (5, 22, 26). TheTrypanosoma
bruceimitochondrial ATP synthase has been isolated and
char-acterized. The molecular composition of the enzyme complex is similar to that of other eukaryotic mitochondrial ATP syn-thases (43). Both functional assays and analysis of protein levels indicate that the complex is developmentally regulated through the life cycle of the organism (7, 41, 42).
A striking feature ofT. bruceiis its ability to adapt to diverse environments encountered through the stages of its life cycle (21, 34). In the tsetse fly, the mitochondrion of the procyclic trypanosomes is fully developed with many cristae, a complete respiratory chain, Krebs cycle enzymes, and abundant levels of mitochondrial ATP synthase. In contrast, the sparse and tubu-lar mitochondrion of the early (slender) mammalian blood-stream trypanosomes lacks a functional respiratory chain, and energy production at this stage occurs via glycolysis. Although the expression of some mitochondrial components is upregu-lated in late (stumpy) bloodstream form trypanosomes,
oxida-tive phosphorylation does not occur until the parasite trans-forms into the procyclic stage in the midgut of the tsetse fly (9, 17, 24, 29) Despite the absence of cytochrome mediated elec-tron transport coupled to ATP production, a mitochondrial membrane potential in bloodstream forms exists and has been found to be comparable to that in mitochondria of procyclic trypanosomes (18, 20, 33). In the bloodstream stage, electrons flow from ubiquinol to the trypanosome alternative oxidase, but this electron flow is not coupled to ATP production and does not generate a membrane potential (8, 20).
The ATP synthase, in contrast to the cytochromes, can be detected in all life cycle stages but is most abundant during the procyclic stage, where it functions in ATP generation through oxidative phosphorylation (2, 42). We and others have hypoth-esized that the ATP synthase in bloodstream form trypano-somes is responsible for the generation of the mitochondrial membrane potential by hydrolyzing ATP generated by sub-strate level phosphorylation (2, 20, 42). The mechanism by which this reversible enzyme switches from the ATP synthetic to the ATP hydrolytic activity is still not well understood, but
inE. coli, yeast, and mammalian cells it has been suggested to
be a response to the proton motive force and the ADP/ATP balance. ATP hydrolytic activity, therefore, predominates at high ATP levels and low membrane potential, forcing the re-verse pumping of protons to generate a membrane potential (28, 35, 38). The membrane potential of the bloodstream form is presumably essential for the transport of ions and nutrients, as well as for the import of nuclearly encoded proteins re-quired as the bloodstream trypanosomes transform to the pro-cyclic form (19, 20). To test this hypothesis, we have used RNA interference (RNAi) to decrease the levels of the ATP syn-thase in bloodstream form trypanosomes by targeting the F1␣
* Corresponding author. Mailing address: 253 Biomedical Research Building, Department of Microbiology, University at Buffalo, Buffalo, NY 14214. Phone: (716) 829-2279. Fax: (716) 829-2158. E-mail: nw1 @acsu.buffalo.edu.
45
on September 8, 2020 by guest
http://ec.asm.org/
orsubunits, which together comprise the catalytic site of the ATP synthase. Our results indicate that the decrease in expres-sion of the␣ orsubunits is reflected in a significantly de-crease in the oligomycin-sensitive activities of this enzyme and results in a parallel decrease in the mitochondrial membrane potential of bloodstream trypanosomes. These results support the role of the ATP synthase in the maintenance of the mem-brane potential in bloodstream trypanosomes.
MATERIALS AND METHODS
pZJM-SB RNAi vector.A 289-bp fragment from nucleotides 171 to 460 of the
subunit gene was amplified by PCR from the ATP synthasesubunit cDNA clone (4) with the forward primer containing an XhoI site (underlined), 5⬘-GCC TCG AGG ACT GCC CTT GAC GTT GTT GAC AAA CT-3⬘, and the reverse primer containing a HindIII site (underlined), 5⬘-GCA AGC TTC CTG GTC CGC AAG CTT GGG AGC CAC GG-3⬘. The 289-bp fragment was ligated into the XhoI/HindIII sites between two head to head T7 promoters of the pZJM vector (37) to generate the pZJM-SubunitBeta (pZJM-SB) construct.
pLewLoop-SA vector.The pLewLoop-SA vector produced a double-stranded RNA as a stem-loop construct to target the ATP synthase␣subunit and was constructed as described by Wang et al. (37). Briefly, a 445-bp fragment from nucleotides 169 to 614 was amplified by PCR from the ATPase␣subunit cDNA clone (4) by using the primer CAAGCTTGGGCGACGCGTCGATCGATG GCACCATTGCCAC containing the HindIII and MluI linkers (underlined), respectively, and the reverse primer GCTCTAGAGCAAATTAATTCACGTT GACC containing the XbaI linker (underlined). This product was first ligated into pCRIITopo (Invitrogen), liberated by XbaI/HindIII digestion, and ligated into the NheI/HindIII sites of pJM326 vector. The construct was then digested with HindIII/XbaI to liberate an⬃1,000-bp fragment containing the target gene and the⬃550-bp stuffer fragment. The pLew100 vector was then digested with XbaI/MluI to release the luciferase reporter. The same ATPase␣subunit frag-ment was amplified by PCR and digested with XbaI/MluI, followed by ligation into the prepared pLew100 vector to generate the pLewLoop-SubunitAlpha (pLewLoop-SA) construct. The resulting stem-loop plasmid contains two copies of the␣subunit fragment in opposite orientation separated by the stuffer frag-ment.
Cell growth, transfection, and RNAi induction.BloodstreamT. bruceisingle marker strain, BSSM (a gift from George Cross, Rockefeller University), hence-forth referred to as wild type, was grown in HMI-9 medium supplemented with 10% fetal bovine serum (15). This cell line previously engineered to express T7 polymerase and the tetracycline repressor allows the regulatable expression of double-stranded RNA (dsRNA) from the T7 promoters. Parasites were cultured in the presence of G418 (2.5g/ml) to maintain the T7 polymerase and the tetracycline repressor constructs. For transfection, 108mid-log-phase cells were
washed once with 1 ml of Cytomix (31) and resuspended in 0.5 ml of Cytomix containing 10 g of either the NotI-linearized pZJM-SB construct or the EcoRV-linearized pLewLoop-SA vector to target the rRNA gene spacer region by homologous recombination. Transfections were performed in 4-mm cuvettes by using a BTX electroporator (ECM 630) with peak discharge at 1.6 kV in resistance timing mode R2 (25⍀) at a capacitance of 50F. Immediately after transfection, cells were transferred into 10 ml of fresh medium supplemented with 10% fetal bovine serum. After 1 day, selection of stable transformants was achieved by the addition of phleomycin (2.5g/ml) (37). Clonal cell lines of the pLewLoop-SA were generated by extreme dilution. Extreme dilution was also attempted to generate clonal cell lines of the pZJM-SB but were not successful (36).
To induce RNAi expression, cells growing at mid-log phase were diluted to 3
⫻105cells/ml, cultured in the medium described above supplemented with 1.0
g of tetracycline/ml, and maintained at a density of less than 5⫻106
cells/ml throughout the induction. Growth curves were determined as the product of cell density and total dilution. The morphology of the cells was examined by micro-scopic analysis at the end of all experiments to determine the extent of viability, mobility, and morphology. For Giemsa-Wright-stained cells, micrographs were collected by using a Nikon Microphot-FXA microscope equipped with a Nikon FX-35DX camera.
Reverse transcription-PCR (RT-PCR) analysis.Total RNA was isolated from 5⫻106
cell aliquots collected for samples of ATPase-subunit RNAi inductions on days 0, 2, and 4 postinduction and days 0, 2, 3, and 4 postinduction of ATPase
␣-subunit RNAi. Total RNA was extracted TRIzol Reagent (Invitrogen) accord-ing to the manufacturer’s protocol. Total RNA was treated with DNase I and
reverse transcribed by using the Thermoscript RT-PCR system (Invitrogen). The cDNA pool was used as the template to amplify the␣andsubunits by PCR. Amplification of the ATP synthase␣subunit was performed with the miniexon primer and NW73 (reverse primer to the NW72), and amplification thesubunit was performed with miniexon primer (NW25) and an internal primer, (NW 90R), which amplifies the transcript, as previously described (4). Amplification of Subunit 9 was performed with the miniexon primer and an internal primer (NW89) (6). The-actin transcript was amplified with primers (NW77 forward and NW78 reverse) (27), and the RNA-binding protein p34 and p37 transcripts were amplified with the miniexon primer and the reverse primer JZ2R (44). The latter two were amplified from the same cDNA pool as internal controls for transcripts whose stability should not be affected by the expression of␣- or
-subunit dsRNA. The PCR products were analyzed by agarose gel electro-phoresis, followed by ethidium bromide staining. RT-PCR results for each sub-unit were quantified by densitometric analysis with a GS-700 imaging densitom-eter in combination with the Multi-Analyst software (Bio-Rad) with the corresponding day 0 set at 100% reference. Quantitative results were derived from a minimum of three independent experiments.
Western blot analysis of RNAi cells.Bloodstream RNAi cell cultures were induced and harvested as described above. For protein samples, 5⫻106
cells were collected per time point. Whole-cell extract from half the sample (2.5⫻106
cells) was separated by sodium dodecyl sulfate-polyacrylamide gel electrophore-sis, followed by Western blot analysis with antibodies directed against theT. bruceicomplete F1complex,subunit, subunit 9, and the F0complex as
previ-ously described (4, 6, 43). An aliquot of equal cell number was used for Western blot analysis probed with a monoclonal antibody against-tubulin (Chemicon International) as a loading control. Western blot results for each subunit were quantified by densitometric analysis as described above, and the corresponding day 0 was used as the 100% reference. Quantitative results are derived from a minimum of three independent experiments.
Determination of ATPase and ATP synthase activity.An enhanced mitochon-drial fraction was prepared from 3 to 5⫻109wild type, day 4-induced-subunit
RNAi cell lines, and day 3-induced␣-subunit RNAi, as previously described (43). The ATPase activity was determined spectrophotometrically at 340 nm by using a coupled enzyme assay, with 100g of protein by the method of Pullman as previously described (43). To determine the specificity of the ATPase activity, oligomycin (5g/mg of protein) was added to the mitochondria and preincu-bated for 45 min prior to the assay. The ATP synthetic activity was determined spectrophotometrically at 340 nm by the method of Pullman and Racker, as previously described (43).
Fluorescent microscopic detection of mitochondrial membrane potential.The membrane potential-dependent stain MitoTracker Red CMXRos (Molecular Probes) was used to assess the mitochondrial membrane potential in blood-stream form trypanosomes. A total of 5⫻106
wild type, day 4-inducedRNAi, and day 3-induced␣RNAi cells were incubated in HMI-9 media containing a 0.1
M final concentration of MitoTracker Red CMXRos dissolved in dimethyl sulfoxide for 20 min in a 37°C, 5% CO2gas incubator. The cells were sedimented
and washed in 150 mM NaCl–20 mM phosphate (pH 7.4; PBS) and then incu-bated in HMI-9 without dye for 30 min. Cells were sedimented, washed with PBS, and fixed with 4% paraformaldehyde in PBS for 10 min at 4°C. After another wash in PBS, the cells were loaded on slides and mounted with Cytoseal 60 mounting media (32). In parallel experiments, cells were treated with 100M CCCP (carbonyl cyanidem-chlorophenylhydrazone; Sigma) and incubated for 15 min in a 37°C, 5% CO2incubator, either before or after the addition of
Mito-Tracker Red CMXRos, and cells were sedimented and resuspended in fresh HMI-9 medium after treatment with the uncoupler. Images were captured with a Bio-Rad MRC 1024 confocal microscope on a Nikon optiphot with absorption at 578 nm, emission at 599 nm and using identical exposures for all samples. For the nonclonalRNAi population, cell counts from an average of 400 counts per sample were scored on the basis of fluorescence intensity. Cells showing intensity similar to that of the wild type were scored as high, and cells showing fluores-cence intensity similar to CCCP treated samples were scored as low. Counts were determined for RNAi-induced cells from at least three independent inductions.
Fluorescent activated cell sorting (FACS).Wild-type bloodstream form cells, uninduced cells, and induced␣andRNAi cells were sedimented, resuspended in HMI-9 medium at 2.5⫻106
/ml, and incubated in HMI-9 medium containing 2.5M MitoTracker Red CMXRos (Molecular Probes) for 30 min at 37°C and 5% CO2. Staining of the␣RNAi cells was decreased to 1M MitoTracker with
similar results. In parallel experiments, cells were treated with 50M CCCP (Sigma) and incubated for 15 min in a 37°C–5% CO2incubator, either before or
after the addition of MitoTracker Red CMXRos, and cells were sedimented and resuspended in fresh HMI-9 medium after treatment with the uncoupler. Cells were washed with 2⫻volume of PBS and sedimented, and the pellet was
on September 8, 2020 by guest
http://ec.asm.org/
pended in 1 ml of PBS. Changes in mitochondrial fluorescence intensity were analyzed with a FACSCalibur (Becton Dickinson) analytical flow cytometer using absorption at 578 nm and emission at 599 nm. CellQuest software (Becton Dickinson) was used to analyze the results.
RESULTS
Expression of␣- and-subunit dsRNAi in the bloodstream stage resulted in a change in cell growth.RNAi was used to knock down the ATP synthase␣ and subunits in order to study the function of the mitochondrial ATP synthase in the bloodstream stages ofT. brucei. The RNAi of the ATP syn-thasesubunit was mediated by the dsRNA construct, pZJM-SB, which contains a 289-bp fragment of the ATP synthase -subunit coding region. This vector allows the regulatable expression of dsRNA of the-subunit fragment from opposing T7 promoters in cell lines previously engineered to express the T7 polymerase and the tetracycline repressor. The RNAi of the ATP synthase ␣ subunit was mediated by a tetracycline-in-duced stem-loop construct (pLewLoop-SA), containing a 445-bp fragment of the ␣-subunit coding region. Clonal cell lines of bloodstream trypanosomes transfected with the␣ -sub-unit stem-loop construct (pLewLoop-SA) were established by limiting dilution. Although several attempts were made to de-velop clonal cell lines of the pZJM-SB expressingRNAi, no viable lines could be maintained. We believe that expression of dsRNA without induction in pZJM (30, 37) acted to select against the establishment of a cell line capable of a more complete knock down. Thus, two nonclonal-subunit RNAi cell lines that showed a substantial decrease in the-subunit protein, relative to the uninduced, were used to monitor effects of RNAi expression of thesubunit.
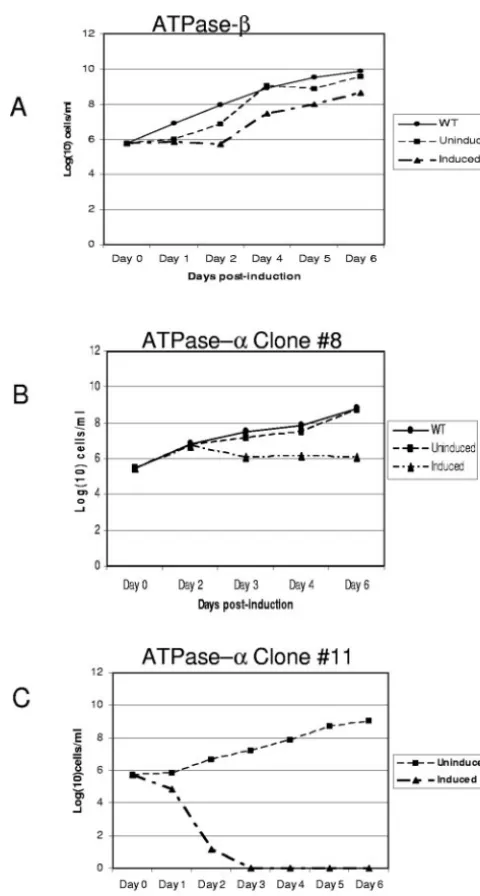
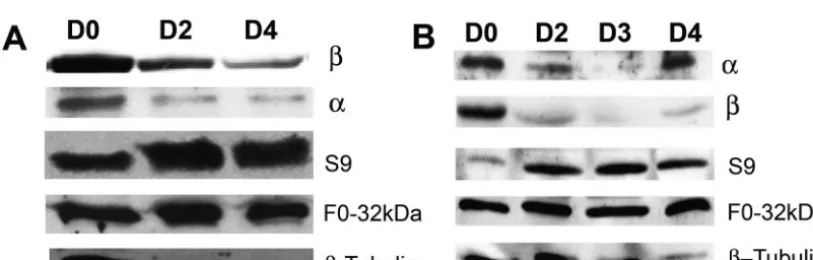
The pZJM-SB cell lines were induced for the expression of -subunit RNAi for up to 6 days and showed a 50% decrease and a lag in cell growth compared to wild-type and uninduced cells starting at day 3 postinduction (Fig. 1A). Similarly, cell lines expressing␣-subunit RNAi induced with tetracycline for up to 6 days showed a decrease in cell grown of⬃50% starting at day 3 postinduction compared to wild-type and uninduced cells (Fig. 1B). Despite a decrease in the rate of cell growth, microscopic analysis of the␣andRNAi induced cell lines did not show significant changes in motility or morphology. We also obtained an␣stem-loop clone (pLewloop-SA clone 11) in which induction with tetracycline resulted in cell death within 24 h of induction (Fig. 1C). This phenotype, however, could not be maintained in continued culture. Both cell lines were monitored for effects on the transcript and protein expression for 4 days after induction. Induction of the-subunit RNAi resulted in a 50% decrease in the-subunit transcript (Fig. 2A) and protein expression (Fig. 3A) on day 4 postinduction. Induction of the␣-subunit RNAi resulted in a 50% decrease in the␣-subunit transcript (Fig. 2B) by day 3 and protein (Fig. 3B) by day 2 postinduction. By day 3 postinduction, the␣clone showed 90% decrease in protein expression and began to re-cover by day 4 (Fig. 3B) Thus, in all subsequent experiments the pZJM-SB cells were induced for 4 days forRNAi and the pLewloop-SA cells were induced for 3 days for␣RNAi, with cell densities maintained at less than 5 ⫻106. These results
indicated that a decrease in the levels of the ATP synthase␣ andsubunits was limiting for cell proliferation after day 3 of
tetracycline addition. After this lag in cell growth, the cells began to recover, as is often seen inT. bruceiRNAi cell lines (13, 14, 40), but did not reach wild-type or uninduced levels during the days observed (Fig. 1A and B). This suggests that the ATP synthase plays an important role in the growth and proliferation of the bloodstream form trypanosomes. More-over, attempts to differentiate the pZJM-SB cells into the procyclic stage resulted in multinucleation, aggregation, and cell death (data not shown). This latter result suggests that RNAi-induced cells are already weakened, such that they are FIG. 1. RNAi knockdown of the ATP synthase␣andsubunits results in a decrease in cell growth. The effect of decreased␣or  expression on cell growth was determined after induction of RNAi with 1M tetracycline compared to uninduced and wild-type cells. (A) Effect of subunitRNAi induction on cell growth. (B and C)␣ subunit clones 8 and 11, respectively, showing the effects of the subunit ␣RNAi expression on cell growth. Growth curves were determined as the product of cell density and total dilution.
on September 8, 2020 by guest
http://ec.asm.org/
unable to keep up with the cellular demands required for differentiation to the procyclic stage. Moreover, since the ATP synthase is required for metabolism in procyclic trypanosomes, even the reduced content of ATP synthase may be too low to allow sufficient energy generation for cell survival.
Expression of␣- and-subunit RNAi resulted in a signifi-cant change of the mRNA and protein steady-state levels of ATP synthase subunits.Cells induced for 4 days forand 3 days subunit␣RNAi were analyzed by RT-PCR and Western blot to determine the effect on their respective ATP synthase subunit steady-state transcript and protein levels. RNAi knock-down of thesubunit resulted in a 50% decrease in-subunit mRNA steady-state levels by day 2 and a 73% decrease by day 4 postinduction relative to the uninduced day 0 levels (Fig. 2A). RNAi knockdown of the subunit also decreased the steady-state transcript levels of the␣subunit by 65% on day 2 and by 58% on day 4 postinduction. RNAi induction of the␣ subunit decreased the␣-subunit mRNA steady-state levels by 50% on day 3 and was further decreased to by 80% on day 4 postinduction relative to the uninduced day 0 levels (Fig. 2B).
RNAi knockdown of the␣subunit also decreased the -sub-unit steady-state transcript levels, similar to the effect of  RNAi on the ␣ subunit. It is not surprising that  RNAi knockdown has an effect on the␣subunit of the ATP synthase and vice versa, since these two subunits are highly homologous. The 289-bp fragment used in the pZJM-SB vector shares 45% identity to the same region of the␣subunit, and the␣subunit 445-bp fragment used in the pLewloop-SA stem-loop construct shares 45% identity to the same region of thesubunit. To determine whether this effect was due to sequence homology or if this was a global effect on the ATP synthase, we examined other subunits of the complex. The steady-state mRNA levels of the ATPase F0 complex subunit 9 (S9) decreased only by
10% on day 2 and by 15% on day 4 postinduction upon  RNAi knockdown. Similarly, steady-state mRNA levels of the ATPase F0 complex S9 remained relatively stable upon ␣
RNAi induction. The actin (Fig. 2) and p34/p37 (data not shown) control levels remained constant throughout induction of either␣orRNAi (Fig. 2).
The effect of␣andRNAi induction on the steady protein FIG. 2. RNAi knockdown of the ATP synthase␣andsubunits affects the steady-state transcript expression of ATP synthase complex subunits. RNA extracted from 5⫻106cells of RNAi-induced cells from each day 0, day 2, day 3, and day 4 postinduction and used in RT-PCR to analyze
the steady-state transcript levels of the F1complex␣andsubunits and the F0complex subunit 9, using the respective internal subunit primers
with the miniexon primer. (A) Effect ofRNAi induction on the steady-state transcript levels of ATP synthase subunits,␣, and 9. (B) Effect of␣RNAi induction on steady-state transcript levels of ATP synthase subunits␣,, and 9. Day 0 was set as the 100% reference point. Actin was used as the control.
FIG. 3. RNAi knockdown of the ATP synthase␣andsubunits affects the steady-state protein expression of ATP synthase complex subunits. Steady-state protein levels of the F1complex␣andsubunits and the F0complex subunits 9 and the 32 kDa, were analyzed by using Western
blots of total protein from 2.5⫻106cells from each day 0, day 2, day 3, and day 4 postinduction. Thesubunit was detected with anti-subunit
antibodies, the␣subunit was detected with anti-F1complex antibodies, subunit 9 was detected with anti-subunit 9 antibodies, and the 32-kDa
subunit was detected with anti-F0complex antibodies. The levels of-tubulin expression were used as the loading control. (A) Effect ofRNAi
on the steady-state protein levels of ATP synthase␣,, S9, and F0complex 32-kDa subunits. (B) Effect of␣RNAi on the steady-state protein levels
of ATP synthase␣,, S9, and F0complex 32-kDa subunits. Day 0 was set as the 100% reference point.-Tubulin was used as the control.
on September 8, 2020 by guest
http://ec.asm.org/
levels of the ATP synthase complex subunits was monitored by Western blot analysis with the antibodies specific forT. brucei
subunits. RNAi knockdown resulted in a 47% decrease in the steady-state protein level for the F1complexsubunit on
day 2 and a 54% decrease on day 4 postinduction relative to day 0 (Fig. 3A). The steady-state protein levels of the F1
complex␣subunit were significantly decreased by 63% on day 2 and 84% on day 4 postinduction. Similarly, RNAi knock-down of the␣ subunit resulted a 65% decrease in the ATP synthase F1complex␣subunit and a similar 60% decrease of
thesubunit by day 3 postinduction. Surprisingly, knockdown of either the␣orsubunits resulted in a significant increase of the steady-state protein of the F0complex subunit 9. Upon
RNAi of thesubunit, the steady-state protein levels of the F0
complex subunit 9 was significantly increased by 87% on day 2 and by 61% on day 4 postinduction. These results were paral-leled upon RNAi induction of the ␣ subunit (Fig. 3). The inverse effect of F1complex␣orsubunit knockdown on the
F0complex subunit 9 was highest on day 2 postinduction (87%
increase), suggesting that as␣- or -subunit transcript levels were targeted by RNAi, the subunit 9 transcript stability and/or protein stability increased, leading to an increase in the overall level of expression of this subunit. This effect peaked on day 2 and decreased on day 4 (61% increase) as the cells began to recover (Fig. 1). In contrast, knockdown of the␣orsubunits did not significantly change the steady-state levels of the F0
complex 32-kDa subunit (Fig. 3).
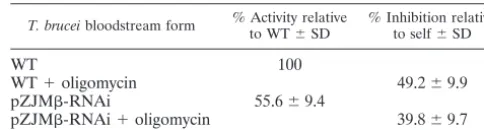
RNAi of the␣orsubunit resulted in a decrease in oligo-mycin-sensitive ATP hydrolytic and ATP synthetic activities. Previous work from this laboratory measured ATP hydrolytic and ATP synthetic activities in an enhanced mitochondrial fraction from bloodstream cells. In the results reported here, 42% of the ATP hydrolytic and 49% of the ATP synthetic activity of wild-type mitochondria was sensitive to inhibition by oligomycin, similar to that previously reported (43). The mi-tochondrial fraction from cells induced forRNAi showed a 43% decrease in ATP hydrolytic activity and a 44% decrease in ATP synthetic activity, relative to the wild-type controls. The sensitivity to oligomycin fromRNAi-induced cells was 54% for ATP hydrolytic activity (Table 1) and 40% for ATP syn-thetic activity (Table 2) compared to RNAi cells. ATP hydro-lytic and synthetic activities were similarly affected by RNAi knockdown of the ATPase␣ subunit (data not shown). This suggests that the ATP synthase complexes that form after␣or RNAi knockdown are fully functional and show similar oli-gomycin sensitivity to that of wild type.
␣- or-subunit RNAi knockdown affects the mitochondrial membrane potential of bloodstreamT. brucei. To determine whether knock down of the␣ orsubunits affects the
mito-chondrial membrane potential, we used the mitomito-chondrial membrane potential-sensitive dye MitoTracker Red CMXRos to stain the mitochondria of wild type and induced cells with or without treatment with the respiratory uncoupler CCCP (32). The uptake of the MitoTracker Red CMXRos stain is depen-dent on mitochondrial membrane potential (23); inT. brucei
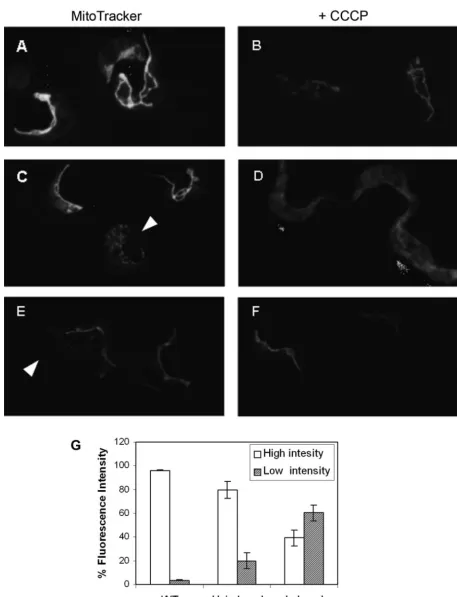
cells a single MitoTracker-stained mitochondrion spans the length of the entire cell (10). Fluorescence microscopic anal-ysis of theRNAi-induced cells showed a population of cells showing different degrees of intensity of the MitoTracker flu-orescent staining compared to wild-type cells (Fig. 4A and C). These cells were largely of two groups showing intense Mito-Tracker staining similar to those in the wild-type cells (Fig. 4A and C) or showing decreased staining similar to wild-type or RNAi cells pretreated with the uncoupler CCCP (Fig. 4C, arrowhead). Cells treated with the uncoupler CCCP before or after staining with the MitoTracker Red showed equal inten-sity of staining. In cells induced forRNAi, 60% of the cell population showed low fluorescence intensity, whereas 40% showed fluorescent intensity similar to wild type (Fig. 4G), indicating that RNAi in this nonclonal cell line leads to a decrease in the mitochondrial membrane potential of the RNAi targeted cells within this cell population. Cells induced for ␣ RNAi expression showed a decrease in fluorescence similar to that seen for cells expressing  RNAi. For cells expressing ␣ RNAi, two cell lines were followed; clone 8 showed a mixed population of cells showing various degrees of fluorescent intensity similar to what was seen in theRNAi nonclonal cell population (Fig. 4E, the arrowhead indicates a cell of lower intensity). Treatment with the uncoupler CCCP also resulted in a decrease in the mitochondrion membrane potential of this cell population (Fig. 4F).
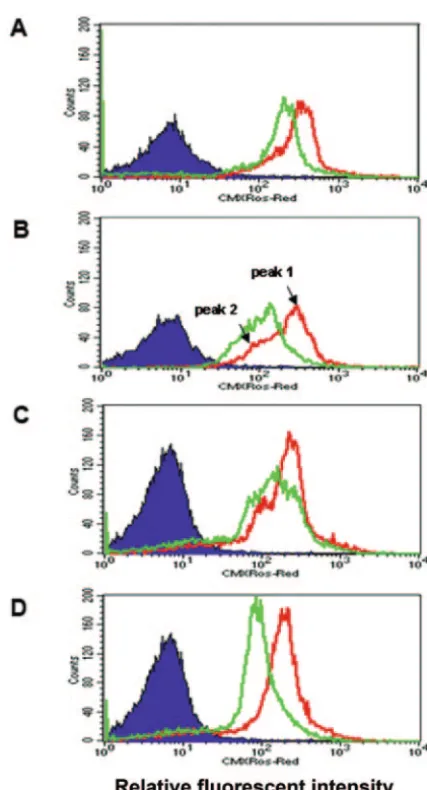
Quantitative analysis of the ␣ and  RNAi effect on the mitochondrial membrane potential by FACS.To further quan-tify the effect of␣andRNAi knockdown on the mitochon-drial membrane potential, uptake of the MitoTracker Red CMXRos dye was analyzed by flow cytometry. Flow cytometry of theRNAi-induced cells showed a consistent decrease in fluorescent intensity compared to the wild-type cells high threshold, as indicated by a leftward shift in the fluorescence intensity of the RNAi cells (Fig. 5A, B, C, and D, red trace) (16). Significantly, the fluorescent trace of the RNAi cells showed a double peak, one of higher fluorescent intensity (Fig. 5B, peak 1, red trace) and one of lower fluorescent intensity which predominantly overlapped with the CCCP-treated peak (Fig. 5B, peak 2 of red trace and green trace). Each of the double peaks represents 50% of the cell population based on the area under the curve. All of the cells treated with the uncoupler CCCP lose their mitochondrion membrane poten-TABLE 1. Mitochondrial ATP hydrolysis activitya
T. bruceibloodstream form % Activity relative to WT⫾SD
% Inhibition relative to self⫾SD
WT 100
WT⫹oligomycin 42.0⫾9.7
pZJM-RNAi 57.0⫾7.2
pZJM-RNAi⫹oligomycin 53.7⫾7.0
aMitochondrion samples (100g) were assayed for ATP hydrolytic activity with or without treatment with oligomycin (5g/mg of protein). WT, wild type.
TABLE 2. Mitochondrial ATP synthase activitya
T. bruceibloodstream form % Activity relative to WT⫾SD
% Inhibition relative to self⫾SD
WT 100
WT⫹oligomycin 49.2⫾9.9
pZJM-RNAi 55.6⫾9.4
pZJM-RNAi⫹oligomycin 39.8⫾9.7
aMitochondrion samples (100g) were assayed for ATP synthesis activity with or without treatment with oligomycin (5g/mg of protein). WT, wild type.
on September 8, 2020 by guest
http://ec.asm.org/
FIG. 4. RNAi knockdown of the ATP synthase␣andsubunit affects the mitochondrial membrane potential. For each cell line, 5⫻106cells
were stained with 0.1M MitoTracker Red CMXRos. Cells treated with CCCP were either treated with 50 mM CCCP for 15 min before or after staining with MitoTracker Red CMXRos, fixed with 4% paraformaldehyde, and analyzed by using confocal microscopy. (A) Wild-type bloodstream form cells; (B) wild-type cells treated with CCCP; (C)RNAi-induced cells (the arrowhead shows cells with low fluorescent intensity); (D) RNAi-induced cells treated with CCCP; (E)␣RNAi-induced cells stained with MitoTracker; (F)␣RNAi-induced cells treated with CCCP. (G) Quantitative analysis ofRNAi-induced cells scored on the basis of relative fluorescence intensity.
on September 8, 2020 by guest
http://ec.asm.org/
tial and thus show a decrease in the fluorescence intensity as seen in both CCCP-treated wild-type andRNAi cells (Fig. 5A to D, green trace). In all cell lines, after treatment with CCCP the cells retained a low level of nonspecific fluorescence higher than the unstained background levels (Fig. 5A to D, blue shaded peak), parallel to the results obtained by fluores-cence microscopy (Fig. 4B, D, and F). These results confirmed the results seen with fluorescence microscopy (Fig. 4E), which showed that 60% of the RNAi induced cell population has
lower fluorescence intensity due to a decrease in the mitochon-drial membrane potential. Flow cytometry of␣-subunit RNAi induced cell lines also showed a consistent decrease in the relative fluorescence intensity. The pLewloop-SA clone 8 showed a shifted peak of decreased fluorescence intensity (Fig. 5C). Flow cytometry of clone 11, which showed the most severe growth phenotype, showed a single peak of decreased fluores-cence intensity (Fig. 5D). In both cases, treatment with CCCP resulted in the further decrease in fluorescence intensity, re-flecting the decrease in mitochondrial membrane potential.
DISCUSSION
The mitochondrial ATP synthase is a reversible enzyme with both hydrolytic and synthetic activities. In most organisms and in procyclic trypanosomes, the proton motive force generated by the electron transport chain is coupled to the synthesis of ATP via the mitochondrial ATP synthase (oxidative phosphor-ylation). Changes in theT. bruceimitochondrial structure and function throughout the stages of its life cycle have been well documented (9, 24, 29, 41, 42). The mitochondrion of the procyclic form trypanosome is fully developed with many tu-bular cristae. A fully functional respiratory chain is present, the ATP synthase is abundant, and ATP is generated by oxidative phosphorylation. The mitochondrion of the early bloodstream form, however, is tubular and contains few cristae, and the electron transport chain and several Krebs cycle enzymes are missing. The levels of ATP synthase are also substantially re-duced at this stage, and ATP synthesis is achieved solely via glycolysis.
Differentiation into the late bloodstream form is accompa-nied by the upregulation of these mitochondrial components, pre-adapting the trypanosome to transition to the tsetse fly. Interestingly, in early bloodstream form trypanosomes where the cytochromes are completely absent, the ATP synthase is still present, although at somewhat decreased levels. In fact, the ATP synthase can be detected in all stages of the life cycle
ofT. brucei(3, 42), indicating that it may have a unique role in
this organism’s ability to function in the bloodstream of its host. Despite the changes that have been observed in the mitochondrion of the bloodstream forms, the membrane po-tential is maintained at levels comparable to those found in the procyclic form (20). In the bloodstream form, electron flow is accomplished via the glycerol-3-phosphate shuttle to the try-panosome alternative oxidase but is not coupled to ATP pro-duction and does not generate a membrane potential (2, 8, 20). Therefore, it has been hypothesized that the ATP synthase in the bloodstream form acts in reverse as an ATP hydrolase to generate the proton motive force at the expense of ATP de-rived through substrate level phosphorylation (19, 20).
To test this hypothesis, we used RNAi to knock down the ATP synthase by targeting the expression of the ␣ and  subunits which comprise the catalytic site of the ATP synthase. Nonclonal cell lines expressingRNAi were recovered after phleomycin selection and subsequently characterized for the reduction of the mRNA and protein expression for the  subunit by using RT-PCR and Western blot analyses, respec-tively. Knockdown of the catalyticsubunit also significantly reduced the levels of the F1-ATPase␣-subunit transcript and
protein levels (Fig. 2 and 3). Similarly, when the ATPase ␣ FIG. 5. FACS analysis of the effect of␣andRNAi knockdown on
the mitochondrial membrane potential. Analysis of 2.5⫻106cells/ml
each of wild type (WT) and RNAi-induced cells stained with a 2.5M concentration of the membrane potential sensitive MitoTracker Red is shown. CMXRos (red trace of each panel) and treated with 50M CCCP prior to MitoTracker staining (green trace of each panel) were analyzed with the FACSCalibur flow cytometer to monitor the changes in fluorescence intensity. Theyaxis of the graphs represents the total cell counts (⫻10) per sample, and thex axis indicates the relative fluorescence intensity of the samples. (A) Relative fluorescence inten-sity of wild-type stained cells. (B) Relative fluorescence inteninten-sity of RNAi-induced cells. Arrows point to peak 1 (high fluorescence) and peak 2 (low fluorescence) of theRNAi cells. (C) Relative fluores-cence intensity of␣RNAi-induced cells from clone 8. (D) Relative fluorescence intensity of␣RNAi-induced cells from clone 11. Blue shaded peak, background intensity.
on September 8, 2020 by guest
http://ec.asm.org/
subunit is targeted by RNAi, the steady-state transcript and protein levels of the  subunit are also decreased. RNAi knockdown of the␣orsubunit may directly knock down the expression of theor␣subunit, respectively, due to the high degree of homology shared between these two genes. The nucleic acid sequences of␣andsubunits are 50% identical overall; the region used to construct the RNAi vectors shows 45% identity to the same region of the other subunit. It is also possible that the decrease in theor␣subunits may be due to differences in the stability of the subunit protein due to the loss of the partner subunit to form the␣33 catalytic core of the
enzyme.
RNAi knockdown of the ␣orsubunit did not affect the steady-state transcript levels of the F0complex subunit 9.
Sur-prisingly, the steady-state protein levels of this subunit are increased in induced cells, suggesting a possible effect on the posttranscriptional regulation of this subunit. The results shown here support our previous results in which the differ-ence in stability of subunit 9 transcript was not proportional to its steady-state protein level, suggesting further posttranscrip-tional regulation of this protein (3). However, not all ATP synthase subunits were affected since the protein levels of the
T. bruceiF0–32-kDa subunit did not change when either the␣
orsubunit were knocked down. Taken together, these results suggest that a common transacting regulatory factor of some of the ATP synthase genes may help to enhance stability of some but not all ATP synthase subunits at the transcriptional level, thus contributing to the coordination of gene expression. When the levels of the␣andtranscripts are decreased, as is the case in both the␣and RNAi cells, this common regu-latory factor would presumably be available in higher amounts to further enhance the stability of the subunit 9 transcript and or protein, leading to increased abundance of this protein. We are continuing to examine the mechanism of gene expression that controls the expression of the ATP synthase complex. Thus far, we have identified a common 13-nucleotide AG-rich element found in the 3⬘ untranslated region of these three genes which may help direct regulation of gene expression of this complex (3).
RNAi knockdown of the␣orsubunit resulted in ca. 50% decrease in catalytically active ATP synthase complex formed (Tables 1 and 2). The ATP synthase complex that assembled after␣orRNAi induction functioned similarly to the wild type, showing ATP hydrolytic and synthetic oligomycin-sensi-tive activities similar to those previously reported (43). The levels of catalytically active complexes formed paralleled the amount of either subunit present after RNAi knockdown. In yeast and mammalian cells, assembly of the ATP synthase complex has been shown to be dependent on the concentration of either␣orsubunit; therefore, a decrease in the␣or subunit leads to a decrease in overall complex formation. In contrast, the loss of other subunits (␥,␦, andε) results in the formation of partial complexes. The F1and F0complexes
ap-pear to form independently of each other. However, if the F0
complex forms in the absence of F1, it does not appear to be
proton permeable (18). This may account for our observation that in the␣andRNAi-induced cell lines, the F0proteins are
either unaffected (32-kDa protein) or are increased, as was seen for subunit 9.
The effect of ATP synthase depletion on the mitochondrial
membrane potential was determined by using MitoTracker Red CMXRos. The MitoTracker probes are similar to rhoda-mine-123 in their selective sequestration in active mitochon-dria. Rhodamine-123 has been previously used to stainT. bru-cei mitochondria; however, rhodamine-123-stained cells cannot be fixed, making it more difficult to obtain microscopic images (1, 12). The MitoTracker probes have the advantage of being retained in the mitochondria after fixation and perme-abilization of the cells (32). Moreover, the MitoTracker Red CMXRos probe has also been shown to be selectively retained based on mitochondrion membrane potential (23). The mem-brane potential of the RNAi-induced cells was substantially diminished when the␣- or-subunit expression was decreased, similar to what was seen in cells treated with the uncoupler CCCP. Knockdowns of other mitochondrial complex subunits in the procyclic stage have shown a similar decrease in the mitochondrial membrane potential (16). These effects resulted in a decrease in the growth rate compared to the uninduced and wild-type controls. InT. brucei, as in other organisms, a proton-motive force has been shown to be required for the import of nuclearly encoded mitochondrial proteins and tRNA (25). In these␣andRNAi cells where reduced levels of the ATP synthase resulted in a decrease in membrane potential, the cells were likely decreased in the ability maintain func-tional requirements for differentiation, leading to a decrease in growth rate. Cellular differentiation requires upregulation of mitochondrial function and hence increased import of the nu-clear encoded components into the mitochondria. Thus, the failure of these cells to be transformed to the procyclic stage was likely due to the inability of these cells to keep up with the cellular requirements for differentiation due to reduced func-tional mitochondria. These results support the hypothesis that the ATP synthase is responsible in part or in whole for the maintenance of membrane potential in bloodstream form try-panosomes.
ACKNOWLEDGMENTS
We thank Shelby Bidwell for generating the pZJM-SB construct, Chioma Okeoma for generating the pLewloop-SA clones, Wade Sig-urson for expert assistance in the confocal microscopy, George Cross for providing the bloodstream form single marker BSSM cell line, Akhil Vaidya and Michael Mather for helpful assistance in the mito-chondrial membrane potential assays, and William T. Ruyechan for critical reading of the manuscript and helpful scientific discussion.
This study was supported by an NIH grant AI-48845 to N.W.
REFERENCES
1.Bienen, E. J., M. Saric, G. Pollakis, R. W. Grady, and A. B. Clarkson, Jr.
1991. Mitochondrial development inTrypanosoma brucei bruceitransitional bloodstream forms. Mol. Biochem. Parasitol.45:185–192.
2.Bienen, E. J., and M. K. Shaw.1991. Differential expression of the oligomy-cin-sensitive ATPase in bloodstream forms ofTrypanosoma brucei brucei. Mol. Biochem. Parasitol.48:59–66.
3.Brown, B., S. V., T. B. Chi, and N. Williams.2001. TheTrypanosoma brucei mitochondrial ATP synthase is developmentally regulated at the level of transcript stability. Mol. Biochem. Parasitol.115:177–187.
4.Brown, B., S. V., A. Stanislawski, Q. L. Perry, and N. Williams.2001. Cloning and characterization of the subunits comprising the catalytic core of the Trypanosoma bruceimitochondrial ATP synthase. Mol. Biochem. Parasitol.
113:289–301.
5.Capaldi, R. A.2002. Mechanism of the F1F0-type ATP synthase, a biological
rotary motor. Trends Biochem. Sci.27:154–160.
6.Chi, T. B., S. V. Brown, and N. Williams.1998. Subunit 9 of the mitochon-drial ATP synthase ofTrypanosoma bruceiis nuclearly encoded and devel-opmentally regulated. Mol. Biochem. Parasitol.92:29–38.
7.Chi, T. B., S. Y. Choi, and N. Williams.1996. The ATP synthase of
on September 8, 2020 by guest
http://ec.asm.org/
soma bruceiis developmentally regulated by an inhibitor peptide. Arch. Biochem. Biophys.333:291–297.
8.Clarkson, A. B., Jr., E. J. Bienen, G. Pollakis, and R. W. Grady.1989. Respiration of bloodstream forms of the parasiteTrypanosoma brucei brucei is dependent on a plant-like alternative oxidase. J. Biol. Chem.264:17770– 17776.
9.Clayton, C. E., and P. Michels.1996. Metabolic compartmentation in Afri-can trypanosomes. Parasitol. Today12:465–471.
10.Coustou, V., S. Besteiro, L. Riviere, M. Biran, N. Biteau, J.-M. Franconi, M. Boshart, T. Baltz, and F. Bringaud.2005. A mitochondrial NADH-depen-dent fumarate reductase involved in the production of succinate excreted by procyclicTrypanosoma brucei. J. Biol. Chem.280:16559–16570.
11.Cross, R. L., and V. Muller.2004. The evolution of A-, F-, and V-type ATP synthases and ATPases: reversals in function and changes in the H⫹/ATP coupling ratio. FEBS Lett.576:1–4.
12.Divo, A. A., C. L. Patton, and A. C. Sartorelli.1993. Evaluation of Rhoda-mine 123 as a probe for monitoring mitochondrial function inTrypanosoma bruceispp. J. Eukaryot. Microbiol.40:329–335.
13.Drozdz, M., S. S. Palazzo, R. Salavati, J. O’Rear, C. Clayton, and K. Stuart.
2002. TbMP81 is required for RNA editing inTrypanosoma brucei. EMBO J.
21:1791–1799.
14.Faruya, T., P. Kessler, A. Jardim, A. Schnaufer, C. Crudder, and M. Par-sons.2002. Glucose is toxic to glycosome-deficient trypanosomes. Proc. Natl. Acad. Sci. USA99:14177–14182.
15.Hirumi, H., and K. Hirumi.1989. Continuous cultivation ofTrypanosoma bruceiblood stream forms in a medium containing a low concentration of serum protein without feeder cell layers. J. Parasitol.75:985–989. 16.Horvath, A., E. Horakova, P. Dunajcikova, Z. Verner, E. Pravdova, I.
Sla-petova, L. Cuninkova, and J. Lukes.2005. Downregulation of the nuclear-encoded subunits of the complexes III and IV disrupts their respective complexes but not complex I in procyclicTrypanosoma brucei. Mol. Micro-biol.58:116–130.
17.Michelotti, E. F., and S. L. Hajduk. 1987. Developmental regulation of trypanosome mitochondrial gene expression. J. Biol. Chem.262:927–932. 18.Mueller, D.2000. Partial assembly of the yeast mitochondrial ATP synthase.
J. Bioenerg. Biomembr.32:391–400.
19.Nolan, D. P., and H. P. Voorheis.1991. Bioenergetic studies of bloodstream forms ofTrypanosoma bruceielectrical H⫹gradients. Biochem. Soc. Trans.
18:735–739.
20.Nolan, D. P., and H. P. Voorheis.1992. The mitochondrion in bloodstream forms ofTrypanosoma bruceiis energized by the electrogenic pumping of protons catalyzed by the F1F0-ATPase. Eur. J. Biochem.209:207–216.
21.Opperdoes, F. R.1987. Compartmentation of carbohydrate metabolism in trypanosomes. Annu. Rev. Microbiol.41:127–151.
22.Pedersen, P. L., and L. M. Amzel.1993. ATP synthases: structure, reaction center, mechanism, and regulation of one of nature’s most unique machines. J. Biol. Chem.268:9937–9940.
23.Pendergrass, W., N. Wolf, and M. Poot.2004. Efficacy of MitoTracker Green and CMXrosamine to measure changes in mitochondrial membrane poten-tials in living cells and tissues. Cytometry61A:162–169.
24.Priest, J. W., and S. L. Hajduk.1994. Developmental regulation of mito-chondrial biogenesis inTrypanosoma brucei. J. Bioenerg. Biomembr.26:179– 191.
25.Priest, J. W., and S. L. Hajduk.1996. In vitro import of the Rieske iron-sulfur protein by trypanosome mitochondria. J. Biol. Chem. 271:20060– 20069.
26.Senior, A. E., S. Nadanaciva, and J. Weber.2002. The molecular mechanism of ATP synthesis by F1F0-ATP synthase. Biochim. et Biophys. Acta1553:
188–211.
27.Stojdl, D. F., and M. W. Clarke.1996.Trypanosoma brucei: analysis of cytoplasmic Ca2⫹during differentiation of bloodstream stages in vitro. Exp.
Parasitol.83:134–146.
28.Suzuki, T., T. Murakami, R. Iino, J. Suzuki, S. Ono, Y. Shirakihara, and M. Yoshida.2003. F1F0-ATPase/synthase is geared to the synthesis mode by
conformational rearrangement of theεsubunit in response to proton motive force and ADP/ATP balance. J. Biol. Chem.278:46840–46846.
29.Tielens, A. G., and J. J. van Hellemond.1998. Differences in energy metab-olism betweenTrypanosomatidae. Parasitol. Today14:265–271.
30.Ullu, E., A. Djikeng, H. Shi, and C. Tschudi. 2002. RNA interference: advances and questions. Phil. Trans. R. Soc. Lond. B357:65–70. 31.van den Hoff, M. J. B., A. F. M. Moorman, and W. H. Lamers.1992.
Electroporation in “intracellular” buffer increases cell survival. Nucleic Ac-ids Res.20:2902.
32.Vassella, E., K. Straesser, and M. Boshart.1997. A mitochondrion-specific dye for multicolour fluorescent imaging ofTrypanosoma brucei. Mol. Bio-chem. Parasitol.90:381–385.
33.Vercesi, A. E., R. Docampo, and S. N. Moreno.1992. Energization-depen-dent Ca2⫹accumulation inTrypanosoma bruceibloodstream and procyclic
trypomastigotes mitochondria. Mol. Biochem. Parasitol.56:251–257. 34.Vickerman, K.1985. Developmental cycles and biology of pathogenic
try-panosomes. Br. Med. Bull.41:105–114.
35.Vinogradov, A. D.2000. Steady-state and pre-steady-state kinetics of the mitochondrial F1F0ATPase: is ATP synthase a reversible molecular
ma-chine. J. Exp. Biol.203:41–49.
36.Wang, Z., M. E. Drew, J. C. Morris, and P. T. Englund.2002. Asymmetrical division of the kinetoplast DNA network of the trypanosome. EMBO J.
21:4998–5005.
37.Wang, Z., J. C. Morris, M. E. Drew, and P. T. Englund.2000. Inhibition of Trypanosoma bruceigene expression by RNA interference using an integrat-able vector with opposing T7 promoters. J. Biol. Chem.275:40174–40179. 38.Weber, J., and A. E. Senior.2000. ATP synthase: what we know about ATP
hydrolysis and what we do not know about ATP synthesis. Biochim. Biophys. Acta1458:300–309.
39.Weber, J., and A. E. Senior.2003. ATP synthesis driven by proton transport in F1F0-ATP synthase. FEBS Lett.545:61–70.
40.Wilkinson, S. R., D. Horn, S. R. Prathalingam, and J. M. Kelly.2003. RNA interference identifies two hydroperoxide metabolizing enzymes that are essential to the bloodstream form of the African trypanosome. J. Biol. Chem.
278:31640–31646.
41.Williams, N.1994. The mitochondrial ATP synthase ofTrypanosoma brucei: structure and regulation. J. Bioenerg. Biomembr.26:173–178.
42.Williams, N., S. Y. Choi, W. T. Ruyechan, and P. H. Frank.1991. The mitochondrial ATP synthase ofTrypanosoma brucei: developmental regula-tion through the life cycle. Arch. Biochem. Biophys.288:509–515. 43.Williams, N., and P. H. Frank.1990. The mitochondrial ATP synthase of
Trypanosoma brucei: isolation and characterization of the intact F1moiety.
Mol. Biochem. Parasitol.43:125–132.
44.Zhang, J., and N. Williams.1997. Purification, cloning, and expression of two closely relatedTrypanosoma bruceinucleic acid binding proteins. Mol. Bio-chem. Parasitol.87:145–158.