12 |
P a g e
IMPLEMENTATION OF “CONTRAST ENHANCEMENT &
FUZZIFICATION HISTOGRAM EQUALIZATION” AND
COMPARISON WITH OTHER CONTRAST
ENHANCEMENT
TECHNIQUES
Shubhanshi Gupta
Ashutosh Gupta
M.Tech (ECE) scholar Assistant Professor ASET, Amity University ASET, Amity UniversityAbstract
Image Enhancement is technique where we enhance the quality of degraded images and make it visual with the help of different kind of Histogram equalization [1]. In this technique, the image is collected in the gray scale allocation. The image is then partitioning and applying adaptive Histogram equalization (AHE. Fuzzy logic provides a set of logics which enhance the contrast and visibility of any image. In this technique, the visual quality and the contrast of image will change and then compare these results with previous techniques. The performance of several established image enhancement techniques is presented in terms of different parameters like Absolute mean brightness error (AMBE), Peak signal to noise ratio (PSNR), contrast and Visual quality [2].
.
Key words: Histogram equalization, Image Enhancement, Fuzzy Logic, AMBE, PSNR
I. Introduction
Digital Image Processing (DIP) involves the modification of digital data for improving the image qualities with the aid of computer. The processing helps in maximising clarity sharpness and details of features of interest towards information extraction and further analysis[1]. This form of remote sensing actually began in 1960s with a limited number of researchers analysing airborne multispectral scanner data and digitised aerial photographs. However, it was not until the launch of Landsat-1, in 1972, that digital image data became widely available for land remote sensing applications [1].
Digital image processing is a broad subject and often involves procedures which can be mathematically complex, but central idea behind digital image processing is quite simple. The digital image is fed into a computer and computer is programmed to manipulate these data using an equation, or series of equations and then store the results of the computation for each pixel (picture element). These results form a new digital image that may be displayed or recorded in pictorial format or may it be further manipulated by additional computer programs. The possible forms o f the digital image manipulation are literally infinite. The raw digital data when viewed on the display will make it difficult to distinguish fine features. Depending on the quality of a given degraded image, each of these improvement factors becomes an important subtopic separately, namely, de noising, contrast enhancement, white balance, de blurring, de mosaic king, de blocking, super-resolution, imprinting, sharpening, smoothing, interpolation, gamma correction, chromaticity enhancement, and so forth[1].
13 |
P a g e
II. Adaptive Histogram Equalization
This is an extension to traditional Histogram Equalization technique. It enhances the contrast of images by transforming the values in the intensity image I [5]. Unlike HISTEQ, it operates on small data regions (tiles), rather than the entire image. Each tile's contrast is enhanced, so that the histogram of the output region approximately matches the specified histogram. The neighbouring tiles are then combined using bilinear interpolation in order to eliminate artificially induced boundaries. The contrast, especially in homogeneous
areas, can be limited in order to avoid amplifying the noise which might be present in the image [2].
III. Fuzzy Logic Implantation
Fuzzy image enhancement is based on gray level mapping into a fuzzy plane, using a transformation function. The aim is to generate an image with higher contrast than the original image by giving a larger weight to the gray levels that are closer to the mean gray level of the image rather than to those that are farther from the mean. In recent years, many
researchers have applied the fuzzy set theory to develop new techniques for contrast improvement. An image I of size
M x N and L gray levels can be considered as an array of
fuzzy singletons, each having a value of membership denoting its degree of brightness relative to some brightness levels. For an image I, the notation of fuzzy sets can be written as:
mn
mn mn
I
g
where mn g is the intensity of (m,n)th pixel and nm μ is its membership value[7].
Fig 1 Fuzzy Histogram image enhancement
IV. Technique Based Contrast preserving Methods Available
There are so many techniques from which we can improve the contrast of an image, in which some methods are time domain based; some are frequency domain based and some method approaches fuzzy domain. But the most effective methods of contrast enhancement are going to discuss here, and then compare these with my proposed algorithm [2].
A. Contrast Limited adaptive Histogram Equalization (CLAHE)
This method is the improvement over traditional Histogram Equalization method. It improve the contrast of image by Transforming the value in the intensity image I. unlike HISTEQ it operate on small data region (tiles) rather than the entire image each tiles’ contrast is enhanced, so that the histogram of the Output region approximately matches the specified histogram. The neighbouring tiles are then combined using bilinear interpolation in order to eliminate artificially induced boundaries [2].
B. Dynamic Histogram Equalization (DHE)
Contrast defines the difference between lowest and highest Intensity level. Higher the value of contrast means more difference between lowest and highest intensity level. Clip the histogram using clip limit, and create a mapping (Transformation function) for this region [4].
14 |
P a g e
One of the improved histogram based method is Dualistic Sub Image Histogram Equalization (DSIHE). In this method first Histogram is divided to segment based on entropy and then Histogram equalization method is applied on each segment separately This is a novel histogram equalization technique in which the original image is decomposed into two equal area sub-images based on its gray level probability density function. Then the two subimages are equalized respectively[3]. At last, we get the result after the processed sub-images are composed into one image. In fact, the algorithm can not only enhance the image visual information effectively, but also constrain the original image's average luminance from great shift.
V. Proposed Methodology
The Proposed method is named as “Contrast enhancement and fuzzification histogram equalization (CEFHE)” in which a gray scale or colour image has been taken and passes through various steps to enhance the contrast of the given image.
A. Working Process
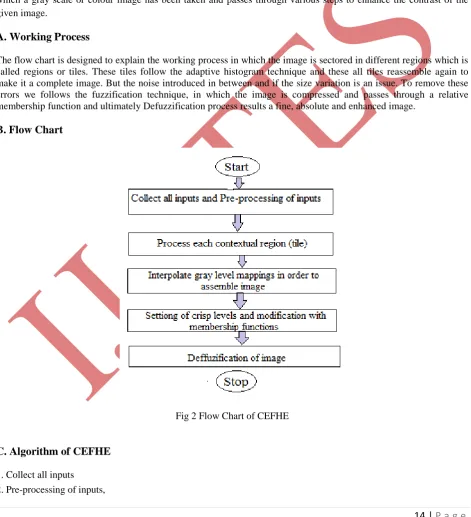
The flow chart is designed to explain the working process in which the image is sectored in different regions which is called regions or tiles. These tiles follow the adaptive histogram technique and these all tiles reassemble again to make it a complete image. But the noise introduced in between and if the size variation is an issue. To remove these errors we follows the fuzzification technique, in which the image is compressed and passes through a relative membership function and ultimately Defuzzification process results a fine, absolute and enhanced image.
B. Flow Chart
Fig 2 Flow Chart of CEFHE
C. Algorithm of CEFHE
15 |
P a g e
3. Process each contextual region (tile) thus producing gray level mappings. Extract a single image region, make a histogram for this region using the specified number of bins, clip the histogram using clip limit, create a mapping (transformation function) for this region.
4. Interpolate gray level mappings in order to assemble image. 5. Represent the image in dark gray level with fuzzy crisp set.
6. Modification of image using membership modification or members set logic 7. Defuzzification of final CEFHE image.
Step 1: Collect all inputs:
Image, Number of regions in row and column directions, Number of bins for the histograms used in building image transform function (dynamic range), Clip limit for contrast limiting (normalized from 0 to 1).
Step 2: Pre-processing of inputs:
Determine real clip limit from the normalized value if necessary, pad the image before splitting it into regions.
Step 3: Process all contextual region:
Producing gray level mappings. Extract a single image region, make a histogram for this region using the specified number of bins, clip the histogram using clip limit, create a mapping (transformation function) for this region.
Step 4: Interpolate gray level mappings
Extract cluster of four neighbouring mapping functions, process image region partly overlapping each of the mapping tiles, extract a single pixel, apply four mappings to that pixel, and interpolate between the results to obtain the output pixel; repeat over the entire image.
Step 5: Fuzzy crisp set:
A fuzzy or crisp input is generated of linguistic levels, and combines through fuzzy set.
Step 6: Modification of image:
The crisp image is passed through a membership function, like, triangular or Gaussian.
Step 7: Defuzzification:
The crisp are aggregated to create crisp output according to define method, or, the conversion of fuzzy set to single crisp.
VI. Comparison Parameters
A. Peak-signal-to-noise-ratio (PSNR)
PSNR is the evaluation standard of the reconstructed image quality, and is important measurement feature. PSNR is measured in decibels (dB) and is given by:
2
255
10 log
PSNR
MSE
where the value 255 is maximum possible value that can be attained by the image signal. Mean square error (MSE) is defined as Where M*N is the size of the original image [5]. Higher
the PSNR value is, better the reconstructed image is.
B. Absolute mean brightness error (AMBE)
16 |
P a g e
Where E(x)= average intensity of input image E(y)=average intensity of enhanced image [5]
C. Contrast:
Contrast defines the difference between lowest and highest intensity level. Higher the value of contrast means more difference between lowest and highest intensity level.
D. Visual Quality
By looking at the enhanced image, one can easily determine the difference between the input image and the enhanced image and hence, performance of the enhancement technique is evaluated.
VII. Experimental Results and Comparison
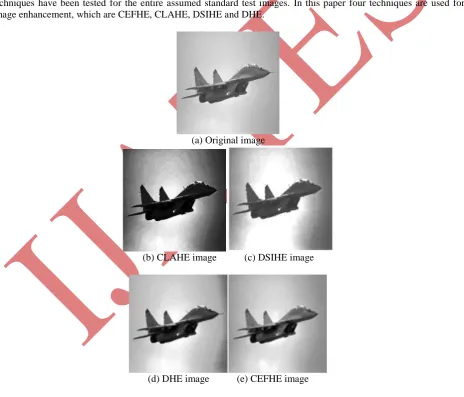
To verify the efficiency of the proposed method obtained after following the Different enhancement Algorithms. After the comparison tables, a graphical representation has also been done for a quick analysis of results. All the techniques have been tested for the entire assumed standard test images. In this paper four techniques are used for image enhancement, which are CEFHE, CLAHE, DSIHE and DHE.
(a) Original image
(b) CLAHE image (c) DSIHE image
(d) DHE image (e) CEFHE image
17 |
P a g e
The Experimental results shown in Fig 3, in which the image of a plane is compare with different techniques. As per result, CLAHE is a good method for image enhancement but the best result is achieved by proposed methodology “CEFHE”. A Comparative approach of merits and parameters are shown below:
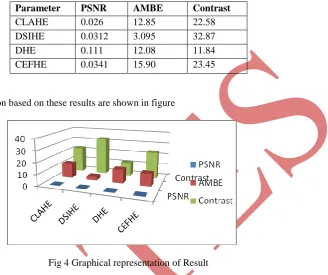
Parameter PSNR AMBE Contrast
CLAHE 0.026 12.85 22.58 DSIHE 0.0312 3.095 32.87 DHE 0.111 12.08 11.84 CEFHE 0.0341 15.90 23.45
The graphical representation based on these results are shown in figure
Fig 4 Graphical representation of Result
As per the comparison shown in table, the PSNR level is good for CLAHE but the AMBE is not so good, In CEFHE psnr is not very different from CLAHE but AMBE is best. All in all the CLAHE and CEFHE method is near to close and we can adopt any one technique for image enhancement.
Conclusion
In this Paper, a frame work for image enhancement based on prior knowledge on the Histogram Equalization has been presented. Many image enhancement schemes like Contrast limited Adaptive Histogram Equalization (CLAHE), Equal area dualistic sub-image histogram equalization (DSIHE), Dynamic Histogram equalization (DHE) Algorithm and Contrast enhancement and fuzzification histogram equalization (CEFHE) has been implemented and compared. The Performance of all these Methods has been analyzed and a number of Practical experiments of real time images have been presented. From the experimental results, it is found that all the three techniques yields Different aspects for different parameters. The result shows that the CEFHE method can be implemented for image enhancement in future.
References
[1] R.C Gonzalez and R.E Woods Digital Image Processing New Jersey: Prentice-Hall, Inc., 2001
[2] A paper on “Comparative Analysis of Various Image Enhancement Techniques”published in IJECT Vol. 2, Issue 3, Sept. 2011.
18 |
P a g e
[4] “Image Enhancement Techniques Based on Histogram Equalization” by Rahul Jaiswal 1, A.G. Rao 2 , H.P. Shukla 3 published in International Journal of Advances in Electrical and Electronics Engineering.[5] “Histogram Equalization Techniques For
Image Enhancement” by Rajesh Garg, Bhawna Mittal, Sheetal Garg published in IJECT Vol. 2, Issue 1, March 2011.
[6] N. Otsu, “A threshold selection method from gray-level histograms,” IEEE Trans. on Systems, Man and Cyb, vol. 9, no. 1, pp. 41-47, 1979.
[7] A paper on “Fuzzy Hyperbolization Image Enhancement and Artificial Neural Network for Anomaly Detection” on World Academy of Science, Engineering and Technology 32 2009
Author