Available online at http://www.ijabbr.com
Corresponding Author: Maziar Haidari, E-mail: [email protected] 96 | Page
Evaluation of different sampling method to study of Diameter at Breath
Height in the Zagros forest
Maziar Haidari*1, Nabiollah Yarali 2 and Naghi Shabanian 3
1
Ph.D. student of forestry, Department of forestry, Sari University of Agricultural Sciences and Natural Resources, sari, Iran
2
Assistant professor of forestry, Faculty of Natural Resources, University of Shahrekord, Shahrekord, Iran
3
Assistant professor of forestry, Faculty of Natural Resources, University of Kurdistan, Sanandaj, Iran
ABSTRACT
For maintaining of Zagros forests role in wild life, water and soil conservation, the suitable solutions and methods for assessing the existing conditions and planning for management of this forests should be given. To detection of suitable sampling method to study tree Diameter at Breath Height in the northern Zagros forest, Blake forest, in Baneeh region, Kurdistan province, and west of Iran was selected. 40 square sample plots one hectare (100×100 m) were selected and perfect inventoried. In every sample plot the position of tree, kind of species and Diameter at Breath Height (DBH) were recorded. In order to study of tree density (tree/ha) different sampling methods (rectangular sample with 20×50 m and 10×50, random sampling method with 40, 50 and 60 circle sample plots which everyone was 1000 m2) compered the prefect inventory. To determination of suitable sampling for study of tree Diameter at Breath Height (DBH) used the %E2 ×T indexes. To compere the Diameter at Breath Height (DBH) in the every sampling methods and perfect inventory used the t-test analysis. Data analyzing was done by SPSS16 software’s. Results showed that the rectangular sample with 20×50 m sample methods was the best methods and have maximum of accuracy. Overall results showed that the rectangular sample with 20×50 m sampling methods was (have minimum of time and %E2×T criteria) the suitable methods to study of density (tree/ha). Authors suggested to study of tree density (tree/ha) in the northern zagros forest used the rectangular sample with 20×50 m sampling methods.
Key words: kurdestan province, Sample methods, Tree density northern zagros forest INTRODUCTION
97 | Page northern Zagros is wetter and cooler than the southern one (Pourbabaei and Navgran, 2011, Bazyar et al, 2013a; Bazyar et al, 2013b; Haidari et al, 2012d). The researcher studied and Comparison of Randomized-Systematic Sampling with Circle Shape Plot and Transect Method, Based on Precision and Cost. Parameters evaluated were number per hectare, crown cover and basal area. Results showed that random-systematic sampling with circle shape plots is of less error than transect method in all cases (Nimvari et al, 2002) researcher determination of the most appropriate transect length for estimation of quantitative characteristics in Zagros forests and results showed that transects with 140m length had the most precision for estimating the above-mentioned parameters (Naghavi et al, 2009). The researcher Comparison of circular plot and transect sampling methods in the Zagros Oak Forests, for this purpose and based on cost and precision (E%2 × T) criterion. Results showed that the more suitable method for these forests in west of Iran is the circular sample plot with 1000m2 area (Heidari et al, 2009). The researcher studied the estimation of Basal Area in west Oak forests of Iran using remote sensing imagery and results showed that the square root of basal area without consideration of aspects has a high correlation with band B1 (r = –0.60). The consideration of aspects resulted in corre-lation of different indices with square root of basal area such that in northern forests, band B1 had higher correlation coefficient(r = –0.67) among other indices. In Eastern forests, the same band showed correlation of basal area with dif-ferent correlation coefficient (r = –0.65). In southern and western forests, the square root of basal area had higher corre-lation (r = –0.68) with RVI. The use of the square root of basal area as a dependent variable in multivariate linear regression improved the results (Gharamani et al, 2012). The researcher studied different sampling method to study of tree density (tree/hectare) in the Zagros forest and Results showed that the rectangular sample with 20×50 m sample methods was the best methods and have maximum of accuracy. Overall results showed that the rectangular sample with 20×50 m sampling methods was (have minimum of time and %E2×T criteria) the suitable methods to study of density (Haidari et al, 2013a). The researcher study of vertical and horizontal forest structure in Northern Zagros Forest and results showed that Overall results showed Blake forest was two forest story and Quercus libani Oliv and Quercus infectoria Oliv were the most dominant woody plants and located in over story (Haidari et al, 2013). The aim of our study was comparing the accuracy and precision of several of the sampling methods to study of tree diversity and tree parameters in northern zagros forest.
MATERIALS AND METHODS
Site description
98 | Page Figure 1. Study site location in the Kurdistan Province, Zagros region, Western Iranian state
of Iran. Analysis
In this study 40 square sample plots one hectare (100×100 m) were selected and perfect inventoried (Figure 2) and in every sample plot the position of tree, kind of species and Diameter at Breath Height (DBH) were recorded.
Figure 2: dispersion of tree in the study area (600×675 m)
99 | Page to study of tree parameter different sampling methods include: rectangular sample with 20×50 m and 10×50 in the 100× 100 m net, random sampling method with 40, 50 and 60 circle sample plots which everyone was 1000 m2 and Transect (with 100 meter length in the 100× 100 m NET, and this sampling methods compared with perfect inventory. To determination of suitable sampling for study of Diameter at Breath Height (DBH) used the %E2 ×T criteria. To study of Diameter at Breath Height (DBH) in the study area, tree characters include kind of species and Diameter at Breath Height (DBH) was recorded. To compere the Diameter at Breath Height (DBH) in the every sampling methods and perfect inventory used the t-test analysis.
Compere the different sampling methods by used the accuracy and costs index:
After the statistical analysis and detected of significant and non-significant different between sampling methods use the compering the accuracy and costs index in the base of below formula:
T × %E2 A=
T: total time of sampling E: Standard error
Each of sampling methods was lowest A (%E2× T) index is suitable sampling methods. Data analyzing was done by SPSS16 software’s.
Result and Discussion
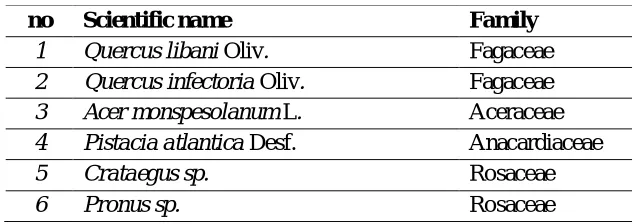
Results of perfect inventory showed that five tree and shrub species observed in the study area. Species in the study area include the Quercus libani Oliv, Quercus infectoria Oliv, Acer monspesolanum L, Pistacia atlantica Desf, Crataegus sp and Pronus sp. Quercus libani Oliv was the most dominant tree and shrub plants.
Table 1. List of Shrub species in the studied areas
no Scientific name Family
1 Quercus libani Oliv. Fagaceae
2 Quercus infectoria Oliv. Fagaceae
3 Acer monspesolanum L. Aceraceae
4 Pistacia atlantica Desf. Anacardiaceae
5 Crataegus sp. Rosaceae
6 Pronus sp. Rosaceae
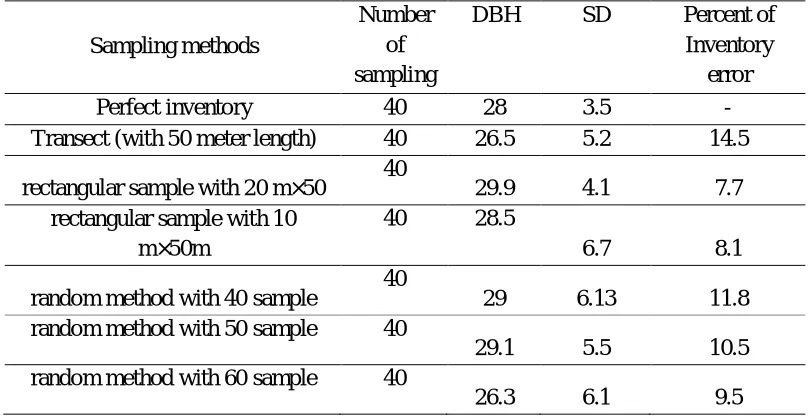
100 | Page Table 2: results of Diameter at Breath Height (DBH) in the different sampling methods
Sampling methods
Number of sampling
DBH SD Percent of
Inventory error
Perfect inventory 40 28 3.5 -
Transect (with 50 meter length) 40 26.5 5.2 14.5
rectangular sample with 20 m×50 40 29.9 4.1 7.7
rectangular sample with 10 m×50m
40 28.5
6.7 8.1
random method with 40 sample 40 29 6.13 11.8
random method with 50 sample 40
29.1 5.5 10.5
random method with 60 sample 40
26.3 6.1 9.5
Table 2 showed that the rectangular sample with (20 ×50m) and (10 ×50m) have a maximum of accuracy, minimum of inventory error and nearest of Diameter at Breath Height (DBH) in compere of real quantity (Perfect inventory). These sampling methods are suitable methods for study of Diameter at Breath Height (DBH).
Table 3: results of t-test analysis to study of Diameter at Breath Height (DBH) Compere means
Sampling methods
t Sig. results
Transect (with 50 meter length) - 3.331 0.032 * rectangular sample with (20 m)
×
50 -2.123 0.065 ns
rectangular sample with (10 m) ×
50 -0.567 0.354 ns
random method with 40 sample -0.657 0.435 ns random method with 50 sample -0.789
0.514 ns
random method with 60 sample -1.123
0.087 ns
* Different letters indicate significant differences in 5% level ns. no significant different
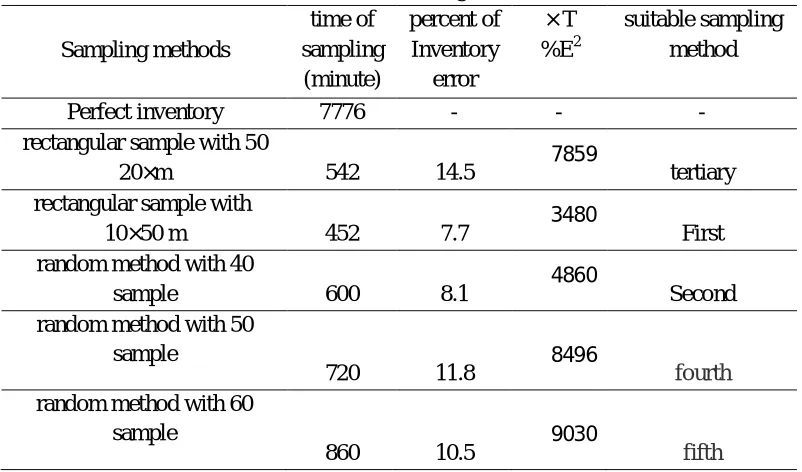
101 | Page Table 4: compering of the accuracy and cost between different sampling methods to study the
Diameter at Breath Height (DBH) Sampling methods time of sampling (minute) percent of Inventory error T × %E2 suitable sampling method
Perfect inventory 7776 - - -
rectangular sample with 50 m
× 20
542 14.5 7859 tertiary
rectangular sample with
50 m × 10
452 7.7 3480 First
random method with 40
sample 600 8.1 4860 Second
random method with 50 sample
720 11.8 8496 fourth
random method with 60 sample
860 10.5 9030 fifth
102 | Page CONCLUSION
Overall results showed that to study of Diameter at Breath Height (DBH) in the northern zagros forest used the rectangular sample with 20 m×50m sampling methods.
Acknowledgements
We thank Mr. Sorosh Zabiholahii and Sasan Vafaei for their help in the field and we thank Dr. Foad Fatehii for their help in the analysis of data.
REFERENCES
Askari. Y., Parsapour. M.K., hosseni. Z. (2013). Modeling of Suitability Iranian Oak site for establish of coppice regeneration in Zagros forest. International journal of Advanced Biological and Biomedical Research, 1(1): 61-70.
Bazyar. M., Haidari. M., Shabanian. N., Haidari. R.H. (2013a). Impact of physiographical factors on the plant species diversity in the Northern Zagros Forest (Case study, Kurdistan Province, Marivan region). Annals of Biological Research, 4 (1):317-324.
Bazyar. M., Bonyad. A., Babaie Kafaki. S. (2013b). Study of most element of forest destruction by used the IRS-1C and LANDSAT image in the southern zagros forest (Case study: Kohkeloeye and Boveirahmad province). International journal of Advanced Biological and Biomedical Research, 1(1): 35-44.
Heidari. R.H., Zobeiri. M., Namiranian. M., Sobhani. H. (2009). Comparison of circular plot and transect sampling methods in the Zagros Oak Forests (Case study: Educational and research forest of Razi University, Kermanshah province). Iranian Journal of Forest and Poplar Research, 17(3): 358-368.
Karamshahi. A., Zobeiri. M., Namiranian. M., Feghhi. J. (2012). Investigation on application of k-nn (k- nearest neighbor) sampling method in Zagros forests (Case study: Karzan forest, Ilam). Iranian Journal of Forest and Poplar Research, 19(4): 452-465.
Pourbabaei. H., Navgran. S. (2011), Biocenose Journal, 3 (1), 15-22. Ehle. D.S., Baker W.L. (1998). Ecol. Monogr. 73: 543–566.
Peet. R.K. (1974). the measurement of species diversity. Ann. Rev. Ecol, Systematics 5: 285-307.
Hosseini. S.A. O., Haidari. M., Shabanian. N., Haidari. R.H., Fathizadeh. O. (2012). The impact of single selection method logging on the tree and shrub diversity in the Hyrcanian forests. European Journal of Experimental Biology, 2 (6):2229-2237.
103 | Page Haidari. M (2013b). Study of herb diversity in the zagros forest (Case study: Kurdistan province). International journal of Advanced Biological and Biomedical Research, 1(1): 25-34.
Haidari. M., Namiranian. M., Zobeiri. M and Ghahramany L. (2013c). Evaluation of different sampling method to study of tree density (tree/hectare) in the Zagros forest. International journal of Advanced Biological and Biomedical Research, 1(1): 11-17.
Haidari. M., Rezaei. D. (2013d). Study of plant diversity in the Northern Zagros forest (Case study: Marivan region). International journal of Advanced Biological and Biomedical Research, 1(1): 1-10.
Haidari. M., Etemad. V. Khosropour. E. (2013e). Study of tree regeneration in the grazed and non-grazed areas in the Iran-o- Turanian Ecological Zones. International journal of Advanced Biological and Biomedical Research, 1(1): 18-24.
Haidari. M., Namiranian. M., Gahramani. L., Zobeiri. M., Shabanian. N. (2013f). Study of vertical and horizontal forest structure in Northern Zagros Forest (Case study: West of Iran, Oak forest). European Journal of Experimental Biology, 3(1):268-278.
Haidari. M., Jalilvand. H., Haidari. R.H., Shabanian. N. (2012g). Study of Plant Biodiversity in Grazed and Non-grazed Areas in the Iran-o-Turanian Ecological Zones (Case Study: Yazd Province, IRAN). Annals of Biological Research, 3 (11):5019-5027.
Haidari. M., Shabanian. N., Haidari. R.H., Bazyar. M. (2012c). Structural diversity of oak forests in Kurdistan Province (Case study: Oak forest). IOSR Journal of Pharmacy and Biological Sciences (IOSR-JPBS), 4(3): 37-43.
Ghahramany. L., Fatehi. P., Ghazanfari. H. (2012). Estimation of Basal Area in West Oak Forests of Iran Using Remote Sensing Imagery. International Journal of Geosciences, 3: 398-403.
Magurran. A.E. (1988). Ecological Diversity and its Measurement. Princeton University Press, Princeton, U.S.A.
Naghavi. H., Fallah. A., Jalilvand. H., Soosani. J. (2009). Determinations of the most appropriate transect length for estimation of quantitative characteristics in Zagros forests. Iranian Journal of Forest, 1(3):228-238.
Nimvari. J.E., Zobeiri. M., Sobhani. H., Zangeneh. H. P. (2002). A Comparison of Randomized-Systematic Sampling with Circle Shape Plot and Transect Method, Based on Precision and Cost, (Case Study in Sorkhedizeh of Kermanshah). Iranian Journal of Forest and Poplar Research, 12,134-146..