R E S E A R C H
Open Access
Cabinet Tree: an orthogonal enclosure
approach to visualizing and exploring big data
Yalong Yang
2,3, Kang Zhang
4, Jianrong Wang
1*and Quang Vinh Nguyen
5*Correspondence: [email protected] 1School of Computer Science and Technology, Tianjin University, 92 Weijin Road, 300072 Tianjin, China Full list of author information is available at the end of the article
Abstract
Treemaps are well-known for visualizing hierarchical data. Most related approaches have been focused on layout algorithms and paid little attention to other display properties and interactions. Furthermore, the structural information in conventional Treemaps is too implicit for viewers to perceive. This paper presents Cabinet Tree, an approach that: i) draws branches explicitly to show relational structures, ii) adapts a space-optimized layout for leaves and maximizes the space utilization, iii) uses coloring and labeling strategies to clearly reveal patterns and contrast different attributes intuitively. We also apply the continuous node selection and detail window techniques to support user interaction with different levels of the hierarchies. Our quantitative evaluations demonstrate that Cabinet Tree achieves good scalability for increased resolutions and big datasets.
Keywords: Orthogonal enclosure; Tree drawing; Hierarchical visualization; Big data
Introduction
Much of data we use today has a hierarchical structure. Examples of hierarchical struc-tures include university-department structure, family tree, library catalogues and so on. Such structures not only play significant roles in their own right, but also provide means for representing a complex domain in a manageable form. Current GUI tools, such as tra-ditional node-link diagrams or file browsers, are an effective means for users to locate information, however one major drawback of common node-link representations is that they do not use screen real estate very efficiently [1, 2].
In the real world, hierarchical structures are often very large with thousands or even millions of elements and relationships. Therefore, a capability of visualizing the entire structure while supporting deep exploration at different levels of granularity is urgently needed for effective knowledge discovery [3]. Enclosure or space-filling visualization, such as Treemaps techniques [4, 5] propose an interesting approach to solve this prob-lem. The Treemap algorithm ensures almost 100 % use of the space by dividing it into a nested sequence of rectangles whose areas correspond to an attribute of the dataset, effectively combining features of a Venn diagram and a pie chart [6]. Originally designed to visualize files on a hard drive [7], Treemaps have been applied to a wide variety of areas ranging from financial analysis, sport reporting [8], image browsing [9] and software and file system analysis [10].
As an important application issue, scalability refers to the capability of effectively dis-playing large amounts of data [11]. Pixel is the smallest addressable element in a display device, so screen resolutions become the limiting factor for scalable visualizations. Larger displays with higher resolutions are being developed for visualization [12] (e.g. the large wall at the AT&T Global Network Operations Center [13]). Therefore, scalability for high resolutions and large data sets become crucial for visualizing big data.
Much attention has been devoted in recent years to enhance the layout algorithm of Treemaps (e.g., [4–6, 14, 15]). Few studies, however, paid attention to the improvement of interaction techniques for navigating Treemaps or other display properties. Yet, Treemaps are not very convenient for exploring large hierarchies, especially when it is necessary to get access to details [2]. It also requires extra cognitive effort for viewers to perceive and understand the relational structures that are implicit in the enclosure [16]. Hence, the use of other display properties (e.g. color, label) is important for an intuitive visualization and efficient interaction techniques are necessary for navigating large Treemap to view details. This paper presents a space-filling technique, called Cabinet Tree, for visualizing big hierarchical data. Our contributions include the following aspects in the design of Cabinet Tree:
• Interleaved Horizontal-Vertical and explicit drawing of branches and
space-optimized layout for leaves, generating a highly compact and intuitive view;
• A contrast-enhanced color strategy and color-coded sorting of leaves to reveal visual patterns;
• Focus+context based interaction support at different levels of hierarchy;
• Quantitative evaluation of scalability for big data (including hundreds of thousands of nodes) with increased resolutions.
Background and literature review
The design of an interactive visualization is often considered as two steps.The first step is to map the relational data into a geometrical plane. i.e.layout. The second step is inter-action, i.e. changing views interactively to reach the desired information [17]. However, display properties are also very helpful in providing insights in the hierarchical struc-ture [18]. We review related work on layout design, the use of display properties and interaction design.
Layout
Table 1Related work of layout
Method Main properties
S&D Treemap interleaved horizontal-vertical
Squarified Treemap good space utilization and aspect ratios, but lost ordering
Pivot Treemap partially ordered
Strip Treemap completely ordered
Spiral Treemap better spatial continuity
Voronoi Treemap polygons are used to enhance the visual presentation
Quantum Treemap suitable for unit based inputs
the underlying flow contour pattern to guide the placement of nodes to gain a better spatial continuity [19].Voronoi Treemapuses polygons to replace rectangles in subdivi-sion to enhance the visual presentation of the hierarchical structures [14]. There are also application-oriented Treemap, for exampleQuantum Treemap, which generates rectan-gles that are integral multiples of an input object size and is suitable for fix-size objects [6]. A summary of the related work in layout is listed in Table 1.
Since the insight of structure information and the space utilization are both important for visualizing big hierarchies, yet it is very hard to achieve these two conflicting goals in a single visualization design, many tree visualization approaches make a trade-off between them.
Display properties
In Treemap visualization, once the bounding box of a node is set, a variety of display properties determine how the node is drawn within it, such as color, texture, border, label, and etc.
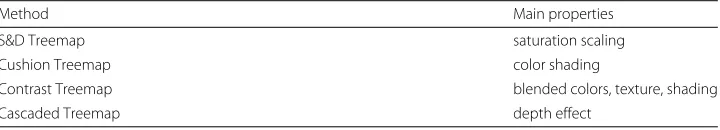
S&D Treemapsets color saturation dependent on last modification date of files to pro-vide an easy way to locate old or new files [4].Cushion Treemapuses the color shading to encode the hierarchical structure [18].Contrast Treemapmixes blended colors, texture, shading and different colors for sub-divided areas to display changes of data [19]. Cas-caded Treemapcreates a depth effect to naturally separate sibling nodes in the hierarchies to illustrate the relationships [20]. A summary of the related work in display properties is listed in Table 2.
Although experimental studies show show that graphic displays reduce task completion time more significantly than tabular text displays, text labels remain critical in identifying elements of the display [21]. Text labels are applied in Treemap right after it being created to help orient viewers [22]. Excentric Labeling has been applied in Treemap to show labels in an interactive manner [23]. However, the color and orientation of labels have not been comprehensively studied.
Table 2Related work of display properties
Method Main properties
S&D Treemap saturation scaling
Cushion Treemap color shading
Contrast Treemap blended colors, texture, shading
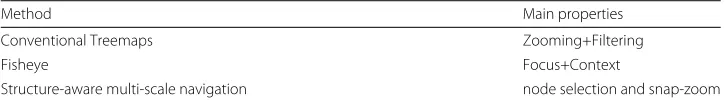
Table 3Related work of interaction
Method Main properties
Conventional Treemaps Zooming+Filtering
Fisheye Focus+Context
Structure-aware multi-scale navigation node selection and snap-zoom
Interaction
Conventional Treemaps allow the Zooming+Filtering interaction: clicking on a node or a subtree border zooms in and a click with the right mouse button zooms out [22]. How-ever, when zooming in/out a Treemap, the context is always lost. Treemap may apply the Focus+Context technique to provide a detailed view of a focused area while maintaining the global context. Keahey uses fisheye techniques to obtain seamless multilevel views in Treemap interaction [24]. Fisheye and continuous semantic zooming is introduced to facilitate direct browsing of hierarchical content [25]. Distortion technology emphasizes the focused area. However, the size of a node in Treemap usually encodes a quantitative attribute, so the distortion could confuse users.
In a Treemaps, a rectangle does not represent a single node in the tree, rather a branch of nodes (the node and its ancestors). This raises the issue on how to determine which node the viewer wishes to select. Structure-Aware Multi-Scale Navigation Techniques introduce an interactive framework with discrete navigation methods to address this issue [2]. The techniques also support snap-zoom that magnifies the horizontal and ver-tical axes with different scales to match the display window. They generates distortions unfortunately. A summary of the related work in interations is listed in Table 3.
Drawer Tree
Our previous work on Drawer Tree aims at combining the connection and enclosure techniques to achieve a good presentation of the structural information [26], as shown in Fig. 1. Drawer Tree uses lines to present leaves, which are hard to perceive. Having much waste between branches, its space utilization is not optimal.
Research design and methodology
To support effective visualization of big hierarchical data, we consider the following design criteria:
• Balanced trade-off between space utilization and clarity of relational structures;
• Scalable for increased resolutions and data sizes;
• Good readability;
• Fast layout algorithm;
• Proper mapping of display properties to data attributes;
• Intuitive navigation and node selection at different hierarchical levels;
• Views with focused details and the global context.
We call our approach Cabinet Tree since it resembles objects stacked in a large cabinet. Branches of the tree partition the cabinet while leaves fill the remaining partitioning space (see Fig. 2).
Previous user studies report that S&D Treemap has the best readability [6, 19], so our design follows the 2D orthogonal concept of S&D Treemap to enable a fast cognitive process. Cabinet Tree draws branches explicitly to reveal their hierarchical relationships. Moreover, a space-optimized layout algorithm is applied to leaves to obtain a com-pact view. Cabinet Tree is generally scalable for increased resolutions and data sizes as demonstrated by our experiments.
Comparison of attributes within a hierarchical structure is crucial for many applica-tions, however, rectangles in S&D Treemap are hard to compare [5]. In Cabinet Tree, a contract-enhanced color strategy is adopted to the mapping of attributes for viewers to compare them easily. We apply color-coded sorting to data items to reveal visual patterns among groups of related nodes. The color and orientation of labels are also studied in our work.
To overcome the node selection dilemma in Treemap [2], we support continuous node selection using mouse wheel. Furthermore, the focus window technique is implemented to show the details without distortion. The remaining part of this section addresses the design rationale and realization of Cabinet Tree.
Fig. 3Interleaved horizontal-vertical partitioning
Weight
In most Treemaps, the weight of a branch is the sum of its children. All leaf-less branches are invisible in such a strategy. There are, however, applications that need to visualize leaf-less branches, for instance, empty folders in a file system, and categories with no products in an e-business system. To solve this problem, we assign an additional constant weight for each branch. In Cabinet Tree, the weight of a branch is calculated in Eq. (1).
Wbranch=Wchildren+C (1)
Interleaved horizontal-vertical partitioning
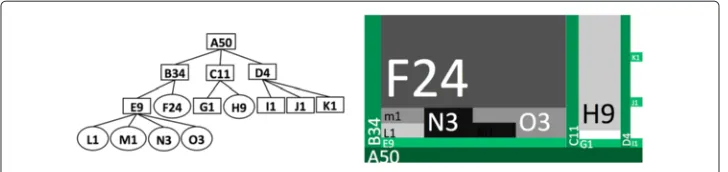
The drawing starts from the bottom horizontal line that represents the root of the tree. Level-1 branches are drawn as vertical lines partitioning the space above the root. Level-2 branches partition the space horizontally between two neighboring level-1 lines, repre-senting the children of the vertical line on the left. Similarly, level-3 branches partition the space vertically between two neighboring level-2 lines, the partitioning process contin-ues down to the lowest level, which can be leaves or empty branches. Leaves occupy the remaining space within the surrounding level lines. In the following discussion, we will generally call a branch or a leaf as anode.
The partitioning process is demonstrated in Fig. 3. The left figure shows a tree in the node-link style where rectangles are branches and circles are leaves. Each node is labeled uniquely by a letter followed by its weight. The right figure demonstrates the same tree drawn as a Cabinet Tree.
Cabinet Trees allow branches to have no leaves, as noted in Fig. 3 where G1, I1, J1, and K1 are leaf-less branches.
The layout algorithm is outlined in Algorithm 1, that is conceptually recursive but implemented iteratively:
Algorithm 1Partitioning
1: procedurePARTITIONBRANCH
2: Calculate thickness for B
3: For each sub branch B-1:
4: Calculate space for B-1 according to its weight
5: Partition branch(B-1)
6: Divide the remaining space into slices of equal widths enough for all leaves in B
7: For each leaf L of B:
8: Calculate for the space of L according to its weight
Fig. 4Implicit branches (left) and explicit branches (right) with 4,245 nodes in Eclipse application folder
The algorithm follows the partitioning concept of S&D Treemap for branches and adopts a space-optimized approach to allocate space for leaves. The time complexity of this algorithm is linear (O(n)) wheren is the number of nodes, since it calculates the layout for each node only once. It is therefore suitable for real-time visualization of big hierarchical data [4].
Branches
Branches are orthogonally drawn with decreasing thicknesses from the root to the low-est level. The exact thickness of a branch is determined by the available space to the branch. Once the space for a branch is allocated, its thickness is calculated according to the space allocated for the branch with a minimal and maximum limits. All the branches are expanding upward vertically and rightward horizontally.
The visual comparison between implicit branches and explicit branches in Fig. 4 demonstrates that explicit branches make relational structures easier for the viewer to perceive.
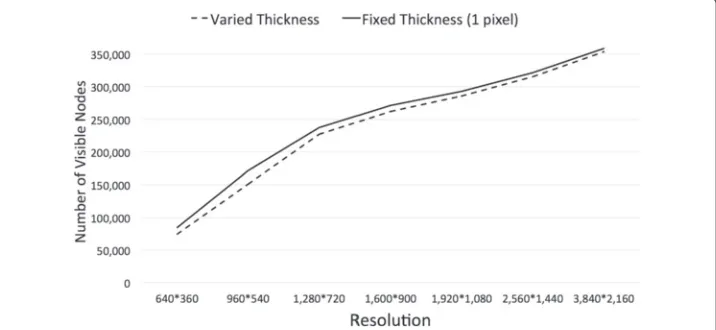
To evaluate whether the strategy of decreasing thicknesses would significantly impact on the number of visible nodes, i.e. the scalability, we set all the branches at a constant thickness of 1 pixel. Figure 5 shows the number of visible nodes for varied and fixed (1 pixel) branch thicknesses on various screen resolutions for the same dataset containing 530,290 nodes. As Fig. 5 demonstrates, the difference is insignificant, we therefore decide to use the varied and decreasing thicknesses, which provides a better visualization.
Leaves
The space allocated for each leaf is calculated according to its weight and the space avail-able from its branch. Each node is placed next to its siblings to achieve a high space utilization and also high proximity of sibling nodes [27].
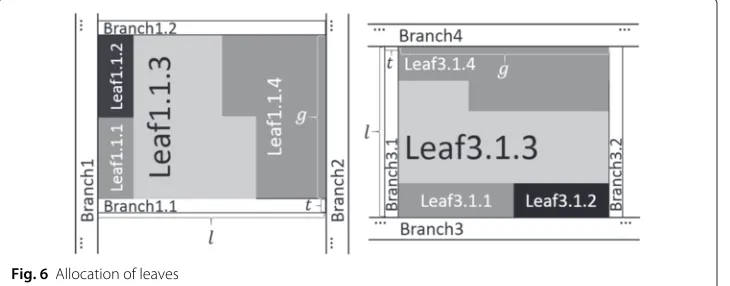
Interleaved horizontal-vertical partitioning may result in either vertical or horizontal leaves. The strategies for allocating both horizontal and vertical leaves are illustrated in Fig. 6, where Leaf1.1.1, Leaf1.1.2, Leaf1.1.3 and Leaf1.1.4 are leaves under Branch1.1 (left), and similarly Leaf3.1.1, Leaf3.1.2, Leaf3.1.3 and Leaf3.1.4 are under Branch3.1 (right).
Color-coded sorting
With sorted data, viewers can locate the needed items and see the quantitative differ-ences easily. The attribute to be sorted could be either discrete (e.g. file type, owners) or continuous (e.g. size, time). Figure 7 compares the method of separate coloring and sorting with the one that combines coloring and sorting. We combine color-coding and sorting on a given attribute to reinforce the perception of grouped leaves of similar values.
Contrast-enhanced color strategy
When assigning colors to continuous valued attributes of leaves, the conventional method is linear mapping. However, if attribute values are concentrated on two ends, this method generates a poor view with only the lightest and darkest colors as illustrated in Fig. 8.
To address the problem of polarizing attribute values, we use a contrast-enhanced strat-egy to post-process the results of linear mapping. The process is demonstrated in Fig. 9. Figure 9a shows the original color distribution among the nodes. We first set a thresh-old, and any node whose intensity less than the threshold will be recorded and removed as illustrated in Fig. 9b. We then spread the remaining intensity values to fit the entire range proportionally, as shown in Fig. 9c. Finally, the removed nodes are added back to the distribution, as in Fig. 9d. This process generates much smoother color distribution for leaves than the linear mapping.
We use HSI color space to present the color of each branch, the deeper of the level is, the lighter the intensity.
The visual comparison between the linear mapping and contrast-enhanced color strategies is demonstrated in Fig. 10.
Fig. 7Separate coloring and sorting (left) and combined coloring and sorting (right) with 2,211 leaves in a file system
Fig. 8A case not suitable for linear color mapping
Fig. 9Process of contrast-enhanced color strategy:a. original distribution;b. node removal at a threshold;
Fig. 10 Visualization of 77,402 files and 7,850 directories in MiKTex folder. Linear color mapping (left) and contrast-enhanced color strategy (right) with color-coding on modified times, the darker the older the file is
Labeling
Labeling every item statically on a dense visualization is unrealistic [23], we therefore use the “Label-What-You-Can” technique” [21]: label only the nodes with enough spaces. Each node is labeled with the text in the same orientation as the node’s orientation.
The color of a text label is crucial for the label to stand out from the background. We useYUVcolor space to generate the color for labels, becauseYUVworks well for optimal foreground and background detection [28]. Assuming thatY represents a node’s over-all brightness or luminance, we compareY with a threshold, and label it black or white depending on whetherY is less or larger than the threshold. This strategy ensures a high color contrast for labeling.
Continuous node selection
The interaction process ofcontinuous node selectionallows a user to go up and down in a branch of nodes. We designate mouse wheel as input device to support continuous node selection. This is because mouse wheel provides the audio and tactile feedback and fine control at short distances scrolling [29, 30] and is thus perfect for precise continuous navigation.
Fig. 12 Detail window of a branch (left) and detail window of a leaf (right)
When the viewer moves mouse within Cabinet Tree, the smallest leaf at the mouse position is shown as the selected node and a forward (resp. backward) notch scroll drills down (resp. roll up) one level along the branch of this leaf.
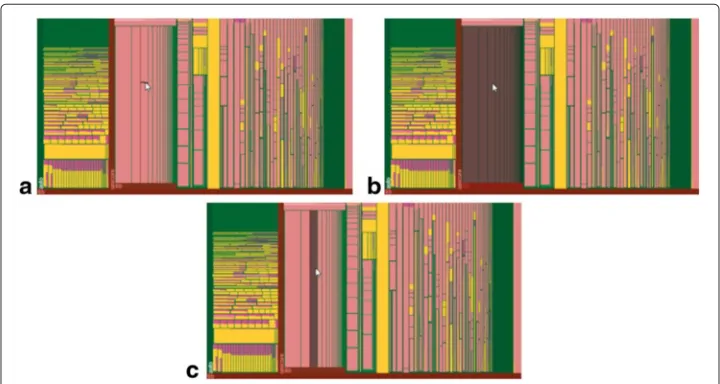
Figure 11 illustrates this technique: a leaf (A) is selected (Fig. 11a) while the mouse cursor moves and A’s grandparent is selected after 2 notches backward rolling (Fig. 11b). A forward notch rolling is then performed to select A’s parent (Fig. 11c). Meanwhile, visual feedback on the change of the selected node is provided in real-time with a translucent gray-out shadow and the title bars of all the ancestors of the selected node are colored with a translucent red to reinforce the structure information.
Detail window
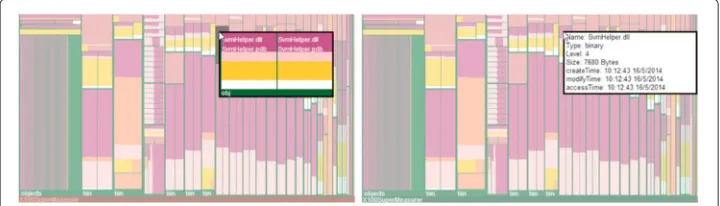
When the viewer clicks on a branch using the middle mouse button, a floating window pops up on the top of the selected branch to display the details of the branch. The detailed view is a new Cabinet Tree visualizing only the selected branch. If a leaf is selected, the leaf ’s detail is shown, such as file size in a file system in a pop-up window. When the detail window is active, the overall window fades with a translucent cover as demonstrated in Fig. 12.
Results and discussion
Case study
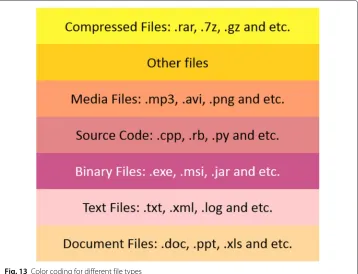
We use Cabinet Tree to visualize file systems to illustrate its effectiveness and scalability. File types are color-coded as shown in Fig. 13.
Cabinet Tree first visualizes the file system of “CodeBlocks Application” which contains 2,673 files and 262 directories, as shown in Fig. 14. Figure 14a uses the file count as the weight, clearly showing that “CodeBlocks Application” consists of 4 major parts:
• Binary files (in Moderate Pink) and source code files (in Soft Red),
• Media files (in Soft Orange),
• Small folders (bundled in Green) and files with unspecified types (in Vivid Yellow), and
• Compressed files(in Light Yellow).
Fig. 13 Color coding for different file types
Another example shown in Fig. 15 is “Visual Studio 2012 Windows Application” folder with 36,722 files and 7,399 directories (including 16 empty ones), weighted on file counts. Figure 15 clearly shows that several folders share similar structures in this dataset. For example, “ProjectTemplates” and “ProjectTemplatesCache” subfolders have similar structures; “ItemTemplates” and “ItemTemplatesCache” subfolders share similar
Fig. 15 Cabinet Tree visualizing 36,722 files and 7,399 directories in visual studio 2012 folder
structures. By manually inspecting these folders, we find that “ProjectTemplatesCache” is the backup folder for “ProjectTemplates” and “ItemTemplatesCache” is the backup folder for “ItemTemplates”. Original and backup folders should of course be similar.
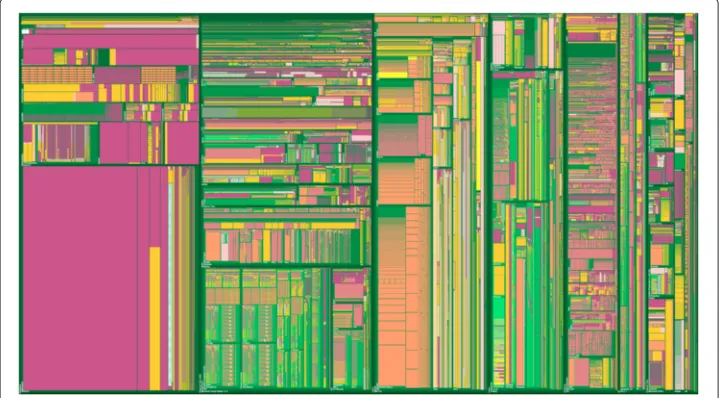
Cabinet Tree is able to handle big data with hundreds of thousands of nodes. For exam-ple, Fig. 2 presents a C drive contents on a personal computer with 455,940 files and 74,350 directories (including 3,520 empty directories).
Scalability evaluation
Having implemented Cabinet Tree using JavaScript, we compare it with Squarified Treemap and S&D Treemap both built on Data-Driven Documents (D3js) [31] which also uses JavaScript. The “round” configuration of D3js Treemap was set to “true” to ensure every node to occupy an integer number of pixels.
All the experiments ran on Google Chrome Browser Version 36.0.1985.125m with 1600×900 resolution using a PC with 2.9 Ghz and 8GB RAM. The data sets experimented are summarized in Table 4.
To evaluate scalability with increased resolutions, we use two large datasets (D Drive and C Drive 1 in Table 4) on 7 wide screens (640×360, 960×540, 1,280×720, 1,600× 900, 1,920×1,080, 2,560×1,440 and 3,840×2,160). In this evaluation, we wish to find
Table 4Data sets and counts of nodes
Data set Max level Total # of files # of directories # of empty directories
IE 11 3 142 136 6 0
Java 1.8.0 10 1,662 1,530 132 3
Office 2013 7 5,092 4,797 295 4
Hadoop 19 14,688 12,711 1,977 60
Ctex 2.9.2 11 90,981 82,901 8,080 364
D Drive 21 105,302 91,183 14,119 549
Qt 5.3.0 18 120,458 109,220 11,238 91
C Drive 1 20 337,953 290,737 47,580 1,954
Fig. 16 Percentage of number of visible nodes within the total number of nodes in different resolutions
the trend of the percentage of visible nodes (among all the nodes) and the layout time (excluding the file reading, rendering and displaying time) with increased resolutions.
Figure 16 shows that the percentage of visible nodes increases with the gradually increasing resolutions for both data sets.
Figure 17 shows that as the resolution grows the layout time for both data sets is linearly increasing.
In summary, Cabinet Tree is highly scalable with increased resolutions in both speed and percentage of visible nodes.
To evaluate the scalability of Cabinet Tree against increased data sizes, we tested it using the data sets in Table 4 with the results shown in Table 5.
We compare Cabinet Tree with Squarified Treemap and S&D Treemap for their scalability with increased data sizes, as in Fig. 18.
Figure 19 compares the percentages of visible nodes within the total number of nodes for the three approaches with increased data sizes. It is clear that Cabinet Tree outper-forms S&D Treemap in all datasets. For smaller datasets, Cabinet Tree is better than Squarified Treemap. Squarified Treemap demonstrates a better scalability than Cabinet Tree in bigger data sets because the drawing of branches in Cabinet Tree costs much
Table 5Number of visible nodes with different data sets
Data set Total # of visible nodes # of visible files # of visible directories
IE 11 142 136 6
Java 1.8.0 1,662 1,530 132
Office 2013 5,064 4,771 293
Hadoop 13,519 11,739 1,780
Ctex 2.9.2 62,466 60,016 2,450
D Drive 67,760 58,707 9,053
Qt 5.3.0 95,569 87,690 7,879
C Drive 1 190,035 179,258 10,777
C Drive 2 262,381 244,063 18,318
space, particularly for deep hierarchies and large number of branches. The comparison of space utilization on different data sets is illustrated in Fig. 20.
Figure 20 shows that when the data sets get bigger, the space utilization for leaves by Cabinet Tree is decreasing, and drops dramatically from Office 2013 (5,064 total number) to Hadoop (13,519 total number).
Comparing the average number of pixels for leaves among three different methods, Fig. 21 shows that Cabinet Tree uses the least for all the data sets. Cabinet Tree therefore delivers the most compact visualization among the three methods.
In summary, Cabinet Tree is more scalable than S&D Treemap in all the cases we exper-imented. Due to its explicit visualization of branches, Cabinet Tree performs poorer than Squarified Treemap in scalability. However, given a space, Cabinet Tree can fill more leaves than S&D Treemap and Squarified Treemap since the average number of pixels per leaf is less than the latter two methods (Fig. 21).
Figure 22 shows the computational time for the layout algorithm (excluding file reading and rendering) on the same data sets. Cabinet Tree is comparable with S&D Treemap which takes least execution time. The complexity of the Cabinet Tree layout is linear, so is S&D Treemap. Since Cabinet Tree draws more nodes than S&D Treemap as shown in Fig. 18, it takes more computational time. Squarified Treemap has worst performance among the three approaches.
Fig. 19 Comparison of three approaches for visible nodes
Fig. 20 Space utlization by Cabinet Tree for increased data sizes
Fig. 22 Computational time for increasing data sizes
Conclusions
This paper has presented a 2D approach for visualizing big hierarchical data, called Cab-inet Tree. Using the enclosure and orthogonal drawing methods, CabCab-inet Tree performs a space-optimized layout for leaves and explicit branches with carefully designed color schemes for aesthetic and clear visualization. Color-coded sorting, contrast-enhanced color strategy and labeling techniques all make full use of display properties. Cabinet Tree also supports continuous node selection using the mouse wheel and Focus+Context view using the detail window.
Quantitative evaluations have indicated that Cabinet Tree is capable of visualizing huge datasets. It is anticipated that with higher screen resolutions, trees of hundreds of millions of nodes can be visualized on a single display. Being scalable for increased resolutions and data sizes and high layout speed, Cabinet Tree can be considered an effective tool for visualizing huge hierarchical structures in a wider range of applications.
Competing interests
The authors declare that they have no competing interests.
Authors’ contributions
YY carried out the visualization and interaction design of Cabinet Tree, implemented the prototype using JavaScript and drafted much of the manuscript. KZ participated the visualization design, advised the experiments and conducted comprehensive revisions of the manuscript. JW participated in the experiment design and analyzed the results. QVN discussed the background and related work of Cabinet Tree and partook in writing and revising the manuscript. All authors read and approved the final manuscript.
Author details
1School of Computer Science and Technology, Tianjin University, 92 Weijin Road, 300072 Tianjin, China.2School of
Computer Software, Tianjin University, 92 Weijin Road, 300072 Tianjin, China.3Caulfield School of Information Technology,
Monash University, 900 Dandenong Road, Caulfield East, 3145 Melbourne, Australia.4Department of Computer Science,
The University of Texas at Dallas, 800 West Campbell Road, 75080-3021 Richardson, TX, USA.5MARCS Institute and School
of Computing, Eng. and Maths, University of Western Sydney, 179 Locked Bag, South Penrith DC, 2751 Sydney, Australia.
Received: 28 February 2015 Accepted: 29 June 2015
References
1. McGuffin MJ, Davison G, Balakrishnan R (2004) Expand-Ahead: A Space-Filling Strategy for Browsing Trees. In: Proceedings of IEEE Symposium on Information Visualization, Austin, TX. pp 119–126
3. Huang W, Eades P, Hong SH, Lin CC (2013) Improving multiple aesthetics produces better graph drawings. J Vis Lang Comput 24(4):262–272
4. Johnson B, Shneiderman B (1991) Tree-maps: a space-filling approach to the visualization of hierarchical information structures. In: Proceedings of IEEE Conference on Visualization, Visualization 91, San Diego, CA. pp 284–291 5. Bruls M, Van Wijk JJ, Van Wijk JJ, Huizing K (1999) Squarified Treemaps. In: Proceedings of the Joint Eurographics and
IEEE TCVG Symposium on Visualization. pp 33–42. doi:10.1007/978-3-7091-6783-0_4
6. Bederson BB, Shneiderman B, Wattenberg M (2002) Ordered and quantum treemaps: Making effective use of 2D space to display hierarchies. ACM Trans Graph 21(4):833–854
7. Shneiderman B (1992) Tree visualization with tree-maps: 2-d space-filling approach. ACM Trans Graph 11(1):92–99 8. Jin L, Banks DG (1997) TennisViewer: a browser for competition trees. IEEE Comput Graph Appl 17(4):63–65 9. Bederson BB (2001) Quantum Treemaps and Bubblemaps for a Zoomable Image Browser. In: Proceedings of User
Interface Systems and Technology, New York, NY, USA. pp 71–80
10. Baker MJ, Eick SG (1995) Space-filling Software Visualization. Journal of Visual Languages & Computing 6(2):119–133 11. Eick SG, Karr AF (2002) Visual Scalability. J Comput Graph Stat 11(1):22–43
12. Yost B, North C (2006) The Perceptual Scalability of Visualization. IEEE Trans Vis Comput Graph 12(5):837–844 13. Wei B, Silva C, Koutsofios E, Krishnan S, North S (2000) Visualization research with large displays. IEEE Comput Graph
Appl 20(4):50–54
14. Balzer M, Deussen O (2005) Voronoi treemaps. In: Proceedings of IEEE Symposium on Information Visualization, 2001. INFOVIS 2001, Minneapolis, MN. pp 49–56
15. Zhao S, McGuffin MJ, Chignell MH (2005) Elastic hierarchies: combining treemaps and node-link diagrams. In: Proceedings of IEEE Symposium on Information Visualization. INFOVIS 2005. pp 57–64.
doi:10.1109/INFVIS.2005.1532129
16. Nguyen QV, Huang ML (2003) Space-optimized tree: a connection+enclosure approach for the visualization of large hierarchies. Inform Vis 2(1):3–15
17. Nguyen QV, Huang ML (2005) EncCon: an approach to constructing interactive visualization of large hierarchical data. Inform Vis 4(1):1–21
18. Van Wijk JJ, Van de Wetering H (1999) Cushion treemaps: visualization of hierarchical information. In: Proceedings of 1999 IEEE Symposium on Information Visualization, INFOVIS 99, San Francisco, CA. pp 73–78
19. Tu Y, Shen HW (2007) Visualizing Changes of Hierarchical Data using Treemaps. IEEE Trans Vis Comput Graph 13(6):1286–1293
20. Lü H, Fogarty J (2008) Cascaded treemaps: examining the visibility and stability of structure in treemaps. In: Proceedings of Graphics Interface, Toronto, Ont. Canada. pp 259–266
21. Fekete JD, Plaisant C (1999) Excentric labeling: dynamic neighborhood labeling for data visualization. In: Proceedings of the SIGCHI Conference on Human Factors in Computing Systems, CHI 99, New York, N Y, USA. pp 512–519 22. Turo D, Johnson B (1992) Improving the visualization of hierarchies with treemaps: design issues and
experimentation. In: Proceedings of the 3rd Conference on Visualization, VIS 92. pp 124–131. CA, USA 23. Fekete JD, Plaisant C (2002) Interactive information visualization of a million items. In: IEEE Symposium on
Information Visualization, INFOVIS 2002. pp 117–124. doi:10.1109/INFVIS.2002.1173156
24. Keahey TA (2001) Getting along: composition of visualization paradigms. In: Proceedings of IEEE Symposium on Information Visualization, 2001. INFOVIS 2001. pp 37–40. doi:10.1109/INFVIS.2001.963278
25. Shi K, Irani P, Li B (2005) An evaluation of content browsing techniques for hierarchical spacefilling visualizations. In: Proceedings of IEEE Symposium on Information Visualization. INFOVIS 2005. pp 81–88.
doi:10.1109/INFVIS.2005.1532132
26. Yang Y, Dou N, Zhao S, Yang Z, Zhang K, Nguyen QV (2014) Visualizing large hierarchies with drawer trees. In: Proceedings of the 29th Annual ACM Symposium on Applied Computing, SAC 2014, NY, USA
27. Liang J, Simoff S, Nguyen QV, Huang ML (2013) Visualizing large trees with divide & conquer partition. In: Proceedings of the 6th International Symposium on Visual Information Communication and Interaction, VINCI 13, NY, USA 28. Fan J, Yau DKY, Elmagarmid AK, Aref WG (2001) Automatic image segmentation by integrating color-edge
extraction and seeded region growing. IEEE Tran Image Process 10(10):1454–1466
29. Wherry E (2003) Scroll ring performance evaluation. Extended Abstracts on Human Factors in Computing Systems:758. doi:10.1145/765891.765973
30. Moscovich T, Hughes JF (2004) Navigating documents with the virtual scroll ring. In: Proceedings of 17th Annual ACM Symposium, New York, USA. p 57