Submittedin:May2013 Acceptedin:October2013 Publishedin:January2014
Recommended citation
Redondo, E., Fonseca, D., Sánchez, A. & Navarro, I. (2014). Mobilelearninginthe fieldof Architecture
andBuildingConstruction. A casestudyanalysis. MobileLearning Applicationsin HigherEducation
[SpecialSection]. Revista de Universidad y Sociedad del Conocimiento (RUSC). Vol. 11, No 1. pp. 152-174.
Abstract
Thiseducationalresearchfocusesontheuseofmobilelearning(m-learning)inthe fieldof Architec
-tureandBuildingConstruction. Itwasconductedatvariouslevelsofuniversityteaching(bachelor’s
andmaster’sdegreecourses)toassesstheintegrationofaugmentedreality(AR)technologyonmo
-biledevices. Severalcasesemployingdifferentstrategieswerestudied. Thesestrategiesrangedfrom
usingQuickResponse(QR)codesorspecificmarkerstodownloadmultimediacontentcreatedby
thestudents, to3Dgeoreferencingmodelsthatallowedinformationtobevisualised, adjustedand
assessedonsite. Specificpracticalexerciseswerethereforedesignedfordifferenttopics, wherethe
twomostcommonformsofregisteringweretested(opticalimagerecognitionandGPSpositioning).
Lightintegrationatthescenewasalsoaddressed. Owingtothehighcostandlimitedavailabilityof
thesedevices, experimentalgroupsmadeupofsmallnumbersofstudentswereformedsothatde
-vicescouldbesharedifnecessary. Improvementinacademicperformanceandsystemusabilitywere
assessedineachspecificcaseusingstandardisedquestionnaires, andtheresultswerecomparedto
thoseobtainedforthecontrolgroupstudents. Theresultsshowthatthesedeviceshavebecomean
effective, efficientandsatisfactorytoolfortheuseofhand-held ARtechnology.
Keywords
educationalresearch, mobilelearning, augmented reality, architecturalrepresentation, userexpe
-rience
Mobile learning
en el ámbito de la arquitectura y la edificación.
Análisis de casos de estudio
Resumen
En esta investigación educativa nos hemos centrado en el uso del aprendizaje móvil (ML) en el campo de la arquitectura y la construcción. Se llevó a cabo en distintos niveles de la enseñanza universitaria de grado y de máster, a fin de evaluar la integración de la tecnología de la Realidad Aumentada (RA) en dispositivos móviles. Se han realizado varios estudios de caso, en los que se han abordado diferentes estrategias, que van desde el uso de los códigos QR (quickreference) o marcadores específicos para descargar contenidos multimedia generados por los estudiantes tales como los modelos 3D georeferenciados para ser ajustados y evaluados en el lugar. Por lo tanto, se diseñaron prácticas específicas en el marco de diferentes temas, donde los dos tipos más comunes de registro han sido probados (reconocimiento óptico de imagen y po-sicionamiento GPS). También se ha abordado la integración de la luz en la escena. Debido al alto costo y a la disponibilidad limitada de estos dispositivos, hemos creado grupos experimentales con pocos alumnos que comparten, si es necesario, los terminales. La mejora del rendimiento académico y la manejabilidad de los sistemas han sido evaluadas en cada caso específico utilizando cuestionarios estandarizados, en comparación con el grupo de estudiantes de control. Los resultados muestran que estos dispositivos se han convertido en una herramienta eficaz, eficiente y satisfactoria para el uso de esta tecnología móvil, la RA en su versión (hand-held) manejable a mano.
Palabras clave
1. Introduction
Theexperiencepresentedinthisarticledidnottaketheformatofatraditionalsubject, butinsteadused
specifictechnologiessuchasaugmentedreality(AR)inworkshops, ormobilelearning(m-learning)
modules, integrated intovarious subjects in the fieldof Architecture andBuilding Construction
Scienceand Technology. Intheseworkshops, specificapplications(apps)andpracticeswereused
tovisualisevirtualmodelsatrealscenesonmobilephonesandtablets, incorporatedatparticular
timesduringbachelor’sandmaster’sdegreecourses. Inaccordancewiththeproposedmodel, those
studentswithadvancedmobiledevicesformedpartoftheexperimentalgroups(EGsorscenarioS2),
andtheyvisualisedvirtualcontentthattheyhadmostlycreatedthemselvesataspecificplace. The
remainingstudentsdoingtheordinaryworkshopformedpartofthecontrolgroup(CGorscenario
S1).
Thestrategyhadbeendesignedasanindependentmoduleforthevisualassessmentofprojects
orconstructiondetailsonsite. Thehypothesistestedwaswhetheritcontributednewvaluestothe
learningprocessbyinvolvingthestudentsinthecreation, visualisationandadjustmentofvirtual
architecturalmodelsasasteppriortotheirconstruction, providingclose-uptopicalknowledgeand
theopportunityforthe studentstointeractwiththosemodels bysharingtheirideasaboutthe
site. Allofthisallowsthestudentstotakepartintheireducationalprocesseswhileusingdevices
and technologiesthat motivate thembecause theyform partoftheir naturalenvironment. The
comparisonbetweenattainingthegeneralsubjectobjectivesofthetwogroups(EGandCG)and
thepotentialimprovementinacademicperformanceoftheEGsassessedascasestudieswasthe
basisoftheprojectpresentedhere.
Thesepracticeswereappliedtosubjectsacrossthebachelor’sdegreecoursesin Architectureofthe
BarcelonaSchoolof Architecture(ETSAB)attheUniversitatPolitècnicadeCatalunya-BarcelonaTech
(UPC)andin Building ConstructionScienceand Technologyofthe BarcelonaSchoolofBuilding
Construction(EPSEB)attheUPC, theuniversitymaster’sdegreecourseinUrbanManagementand
ValuationattheUPC, andthebachelor’sdegreecoursesin ArchitectureandBuildingConstruction
Scienceand TechnologyoftheLaSalleCampusBarcelonaatRamonLlullUniversity(URL). Inthis field,
ARm-learningwastrialledusingtechnologiesrangingfromQRcodestovisualiseanddownload
multimediacontent, topositioning(registering)virtualmodelsintheenvironment(byopticalimage
recognitionorgeolocation).
The experience wasbased on thehypothesis thatthe newinformation and communication
technology(ICT)toolsusedintheWeb3.0environmentenablethestudents’skills(Álvarez, 2012)
andlearningprocesses(Álvarez & Bassa, 2013)tobeimprovedatalowercost(usingfreeapplications
or educationallicenses)and inlesstime. Furthermore, allofthat canbedone withoutany prior
experiencethankstotheintuitivetouch-screeninterfacesofthelatest-generationmobiledevices.
Incombinationwiththeadvancesincloud-computing(CC)technology, whichenables appsand
servicestobesharedubiquitouslyontheInternet, aworkflowisgeneratedthatallowstheteaching
experienceusing ARm-learningtobecomeanewparadigmofcontinuingeducationandcontextual
Severalstrategieswereusedtotestthehypotheses, startingwithapre-test, whichestablished
thetechnologicalprofilesofthestudentsandtheirownknowledgeoftechnology, whichinturn
determinedtheEG. Questionnaireswerethenusedto findoutabouttheusabilityofthemethodsand
processesconsidered. Parameterstoassessacademicperformanceoncompletionoftheexperiences
wereincludedinthepost-test. Besidesbeingmoremotivatedbythedesignedexperiments, theEG
studentsgenerallyachieved betterresultsintheiracademicperformance, which, intheabsence
ofmorein-depthtesting, relatesthecorrectuseofthesetechnologiestothestudents’curricular
improvement.
2. Objetives
Asalreadymentioned, theaimofthisresearchwastoassesshand-held ARtechnologyinlearning
processes. First, theusabilityofthesystemsemployedand, second, theimprovementinthestudents’
academicperformancewereassessed. Thisassessmentwasbasedonthestudyofperson/mobile
deviceinteractioninteachingprocesses(Argüelles, Callejo, & Farrero, 2013), andontheabilityto
visualisevirtualmodelsormakedigitalnotesandsketchesusingdevicesofthistype. Theseaspects
arewhatwewouldconsidertobetoday’sversionofarchitecturalphotomontage, seekingtofoster
greaterinterestinthedisciplinesinvolvedinordertobringaboutanimprovementinthestudents’
academicperformance.
In order to implement these experiences, content and specific assessment methods were
developedregardingtheuseofmobiledevicestovisualisecontentlocallyandubiquitously, and
of commercial (ARmedia©, Layar©) own-developed apps designed by the workgroup for free
distributionanduseonthe Android© operatingsystem. Thelatterapp, calledU-AR, wasconsidered
necessarytoenablethecreationandpersonalisedmanagementofvirtualcontentusing AR, which,
inthe fieldofstudyinquestion, has anumberofpotentialadvantagesoverthosealreadyinthe
marketplace(SánchezRiera, Redondo, & Fonseca, 2012).
Thespecificobjectivesofeachexperiencefocusedonassessingwhetherthereweresignificant
differences in(a) theacademicresultsand(b) thestudents’levels ofsatisfaction andmotivation
dependingontheteachingscenarioused(S1, basedonconventionalmethods, andS2, basedon AR
m-learning). Tothatend, thefollowingresearchquestionswereposed:(Q1) Arethereanydifferences
in thestudents’levelsof satisfaction andmotivation dependingon whichof thetwoproposed
teachingscenariosisused?, and(Q2) Arethereanydifferencesintheacademicresultsdependingon
whichofthetwoproposedteachingscenariosisused?
3. Background
The firstworksonm-learningwerebyKristoffersenandLjungberg(2000). Otherexperiences(Lehner
bydevelopinganm-learningplatformcalledWelcome. Severalauthors(Prahalad & Hamel, 1990)
havecalled for this educationalcompetencytobeconsideredbasic, andit has beenexpanded
inourexperiences(Fonsecaetal., 2013), wherewewouldeffectivelybetalkingaboutaconcept
midwaybetweenm-learningandubiquitouslearning(u-learning), inwhichdataarestoredinthe
cloud. Inviewofthesereferencesandthelackofothers, especiallyinthearchitectureandbuilding
construction environment, we considered it worthwhile to further this educational research.
Regarding ARtechnology, manystudieshavebeendoneonitspotential:inmedicine(Paiva, Machado,
& Oliveira, 2012), inmaintenanceorassemblyoperations(Benbelkacemetal., 2009; Hincapieetal.,
2011), intourism(Guttentag, 2010; Hsu, 2011), inmuseums(Tillon, Marchal, & Houlier, 2011)orin
advertisingandmarketing(Honkenetal., 2012), aswellasinareasthataremoreclosely-related, such
asarchaeologyandhistoricalheritage(Haydaretal., 2008), planningandurbanismorconstruction
andmaintenanceprocesses(Allen, Regenbrecht, & Abbott, 2011).
Someauthorshavesuggestedtheviabilityofintroducing ARintootherareassuchasdesign,
excavation, layout, inspection, the coordination or supervision of tasks (Shin & Dunston, 2008),
or infrastructure visualisation (Schall et al., 2008). In building restoration, it has been trialled,
usingmobiledevices, tovisualisethe finalappearanceofasiteona1:1scale(Tonnetal., 2008).
Its usefulness as a tool for representing internal spaces has also been tested (Wang, 2008) by
experimentingwithappsthatdidnotrequireanypriorexperience(Oksman, Siltanen, & Ainasoja,
2012). In the educational environment, its usefulness has been demonstrated for improving
mathematicsteaching(Kondo, 2006), spatialabilities(MartínGutiérrez, 2010)ormusic(Peulaetal.,
2007). Edutainment(education+entertainment)proposalssuchasConstruct3Dhavebeenstudied
(Kaufmann, Schmalstieg, & Wagner, 2000), andtherearewebsitesthatofferstudentsthechanceto
buyaugmentedbookstoimprovetheirskills(Martinetal., 2011).
4. Method
4.1. Assessment of the usability of the systems employed
We used online and paper-based questionnaires that had generally been designed with two
objectivesinmind:toassessaspecificelementandtoobtainqualitativefeedbackfromthestudents.
Generally, thequestionshadbeendesignedtobeansweredusingLikertscales, where1=disagree
and5=stronglyagree. Theresultswereanalysedforeachoftheworkshopsdone, andwerethen
processedjointly. Eachquestionnairewasdividedintofoursections(A, B, CandD)inaccordance
withthefollowingdescriptions: A:personalquestionsaboutgender, age, name, qualifications, etc.;
B:questionsaboutpriorknowledgeofthetechnology, whichwereusefultoevaluatethestudents’
technicalprofiles;C:opinionoftheworkshopandtheteachingmaterialsused;andD:opinionofthe
ARm-learningand3Dobject-modellingtechnology.
TheanswersobtainedservedasthebasisfortheanalysisbasedonISO9241-11, whichsetsout
user’sabilitytocompletetasksduringtheworkshop, inrelationtoaccuracyandintegrity;efficiency,
understood asthe allocatedresources, withquestions abouttime andeffort spenton resolving
theproposed exercises;and satisfaction, understoodas the students’subjectivereactionstothe
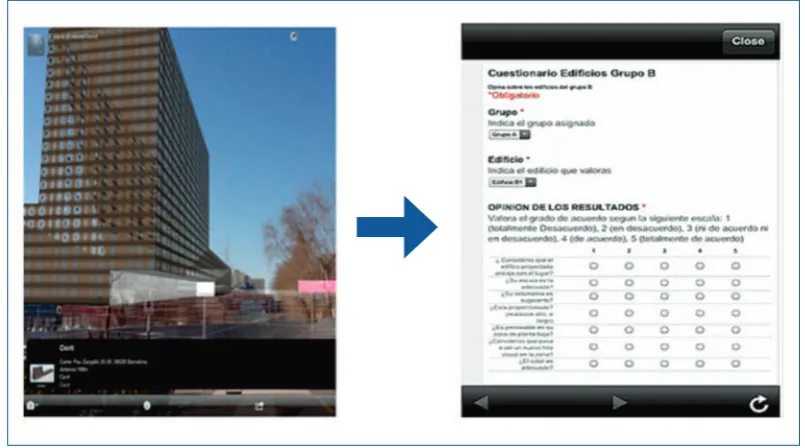
workshop. EspeciallynoteworthywastheexerciseinwhichLayarwasused(casestudy3), wherethe
opportunitytoanswercertaingeolocatedquestionswasincorporatedintotheon-sitevisualisation
process, whichenabledanassessmentofthestudents’opinionsofhowthedifferentproposalshad
beenintegratedintothesite. TheonlyformatusedwasGoogleDocs, whichallowedtheresultstobe
gatheredandanalysedimmediately(Figure1).
Figure 1.
4.2. Improvement in academic performance
A crucialaspectwas thecurricularassessmentofthestudentswhohadusedsuchtechnologies
inordertocheckwhethertheirperformancehadimprovedincomparisontothosewhohadnot
usedthem. Tothatend, itwasnecessarytocomparetheirscoresinthepre-testandcomparethem
withthescoresthattheyobtainedafterdoingtheworkshop(post-test). Thestudentsweredivided
intotwogroups, EG(using AR)andCG(doingaconventionalworkshop). Asthegroupsweresmall,
wecouldnotstrictlytakethemeansofeachgroup, butinsteadhadtoestimatetheprobabilityof
thegroupsbeingconvergentbeforeandafterdoingtheworkshop(pre-testandpost-test). Forthat
purpose, thestatisticalproceduredevelopedbyGosset(1908)wasused, whichisknownasStudent’s
t-testandissuitableformakingpreciseestimatesfromdatawithsmallsamples. Inordertocheckif
thegroupswereinitiallysimilar, thatistosay, ifthevariationinscores(pre-test)betweenthedifferent
groupswas notsignificantly greaterthanthevariationwithinthegroups, ananalysisofvariance
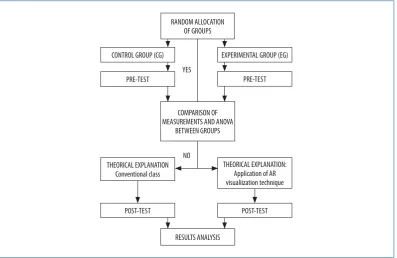
Figure 2.
groups(nodifferences)tobetested. The flowdiagramusedtoassessperformanceisshownbelow
(Figure2).
RESULTS ANALYSIS POST-TEST
THEORICAL EXPLANATION Conventional class
PRE-TEST CONTROL GROUP (CG)
RANDOM ALLOCATION OF GROUPS
EXPERIMENTAL GROUP (EG)
PRE-TEST
POST-TEST THEORICAL EXPLANATION:
Application of AR visualiization technique COMPARISON OF
MEASUREMENTS AND ANOVA BETWEEN GROUPS
YES
NO
5. Case Studies
ThestudentsintheEGweregivenspecific ARtraining. Thespecificallydesignedworkshopslasted
forsixhours, andweredividedintothreetwo-hoursessions. The firstsessionwasforthestudents
toreceivegenerictrainingonhowtouseandmanagethe ARappsthatwouldbeemployed. The
secondsessionwasforthestudentstopractisehowtovisualisetheimportedmodelsandhowto
interactwiththespecificplayers(U-AR, ARPlayerandLayar). Thethirdoutdoorsessionwasforthe
studentstoexperimenton sitewiththe fitofthevirtual models, assessingboththemodeland
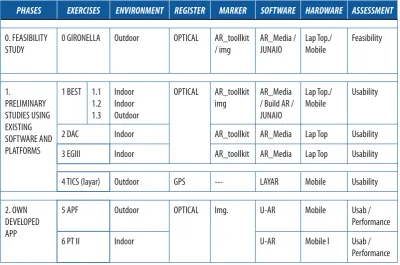
theexperience. Table1showsthedifferentcasestudiesconducted. Onlycases3to6(withabold
border)are describedbelowbecausethemostdistinctvariants of ARtechnologieswereusedin
them. Thesecasesrepresentedtheendofthepreliminarystudyphase(cases3and4)andthestart
Table 1
PHASES EXERCISES ENVIRONMENT REGISTER MARKER SOFTWARE HARDWARE ASSESSMENT
0. FEASIBILITY STUDY
0 GIRONELLA Outdoor OPTICAL AR_toollkit
/ img AR_Media / JUNAIO Lap Top./ Mobile Feasibility 1. PRELIMINARY STUDIES USING EXISTING SOFTWARE AND PLATFORMS
1 BEST 1.1 1.2 1.3 Indoor Indoor Outdoor OPTICAL AR_toollkit img AR_Media / Build AR / JUNAIO
Lap Top./ Mobile
Usability
2 DAC Indoor AR_toollkit AR_Media Lap Top Usability
3 EGIII Indoor AR_toollkit AR_Media Lap Top Usability
4 TICS (layar) Outdoor GPS --- LAYAR Mobile Usability
2. OWN DEVELOPED APP
5 APF Outdoor OPTICAL Img. U-AR Mobile Usab /
Performance
6 PT II Indoor U-AR Mobile l Usab /
Performance
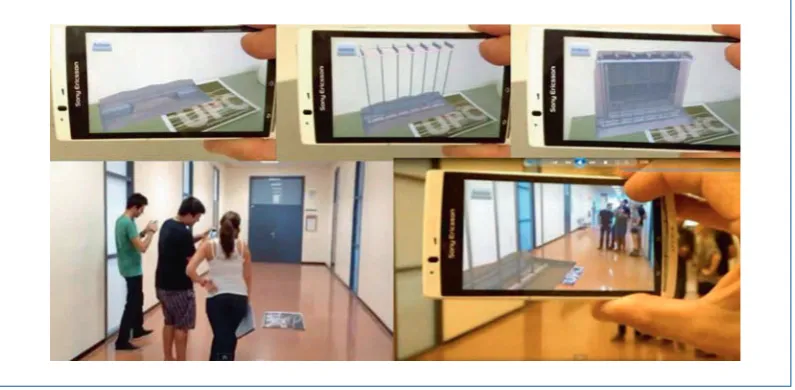
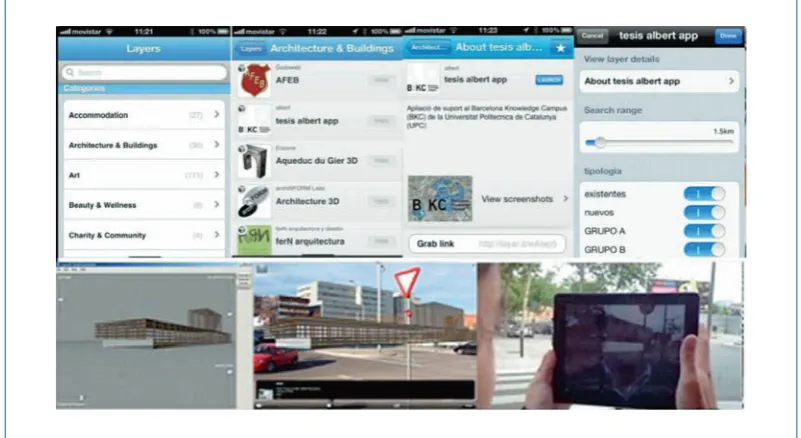
5.1. Case study 1
Information Technology (IT) Applications (APF) (3 credits), Architecture at ETSAB-UPC, 2012. The
objectiveofthesubjectwastomodelurbanunits, squaresorstretchesofstreetsandtodevelop
urban design projects in them by incorporating sculpturalelements. Thisprocess involved two
thematicareas:digitalimageprocessingandtheuseofresponsivetoolstocreatevirtual3Dscenes.
Inthiscase, wefocusedonthestudyofinterventionsintheurbanlandscapeofBarcelona;theplace
of interventionwas Flassaders squareand thereference model was sculptures. The work group
comprised 25students divided into3 groups:a CG(8 students) without 3G phones doing the
conventionalworkshop, andtwoEGsusingiOS(9students)and Android(8students)devices, who
weregivenspecifictrainingonhowtousethespecific AR. Androidusersusedtheown-developed
U-ARappandiPhone© usersused ARmedia© (Figure3).
TheobjectiveoftheEGfocusedonassessingthebest fitintermsofsizeandlocationofthemodels
inrelationtothedimensionsofthesquare. Thisbasicaspectoftheexercisewascorroborated, asthe
CGstudentsmadedisproportionateproposalsincomparisontotheEGstudents, whoseproperly
adjustedthesizeoftheirproposals(Redondoetal., 2012).
5.2. Case study 2
TechnicalProjectsII, (PT II)(3credits), BuildingConstructionScienceand TechnologyatEPSEB-UPC,
2012.The object of study focused on the application of ICTs toconstruction and maintenance
processes. The exercise focused on visualising the construction process of a load-bearing wall
support. A totalof146studentstookpartinthisexperience, whoweredividedinto3CGsand1EG
(Figure4). DetailsoftheexperimentaredescribedinSánchezetal. (2013).
Figure 4.
5.3. Case study 3
ICTs Applied to Territorial Analysis (TICS)(60 hours), university master’s degree course in Urban
ManagementandValuation, ETSAB-UPC, 2012.ThetopicoftheexperimentfocusedontheBarcelona
KnowledgeCampus(BKC). A totalof11studentstookpartinthisexperiment, inasingleEG. Usewas
madeofageographicalinformationsystem(GIS)capableofintegratingthedataobtained(digitally
modelled buildingslocatedintheirreal, physical coordinates)inageoreferencedmanner. In this
case, Layar© was used. It isafreeapp thatallowsbothalphanumericand digital-modelcontent
tobegeoreferencedfortheirintegrated visualisationonmobiledevices(Figure5). Detailsofthe
5.4. Case study 4
RepresentationSystemsII(EGIII)(9credits), ArchitectureatLaSalleCampusBarcelona, URL, 2011/2012.
A totalof57studentsdidtheproject. ThestudentsonthepreviousworkshopweretakenastheCG.
AllofthestudentshadbeengivenCAD2Dand3Dtraining. Inthiscase, integratedusewasmade
ofseveral ARm-learningstrategiestopresenttheprojects, usingQRcodeslinkingtomultimedia
content:videos, CAD, virtual3Dmodelsintegratedinto AR, specificwebsites, etc. (Figure6). Detailsof
thesurveysandacademicprogressaredescribedinFonsecaetal. (2012).
Figure 5.
6. Results Analysis
6.1. Usability
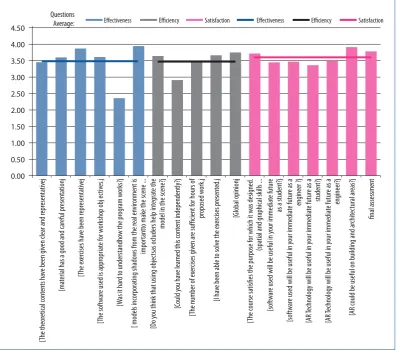
Thejointresultsofthefourworkshopsassessedinthisinstance, whereeachvariablehadthesame
weightintheformationoftheindicatorthatitexplained, aregiveninFigure7below, whichshows
themeanresultsoftheworkshopsdoneinrelationtoeffectiveness, efficiencyandlevelofsatisfaction
reached. Itispossibletoobservethatthethreecomponentsformingpartofusabilityobtainedsimilar
ratings, ataround3.5outof5points, withsatisfactionhigherthantherest.
Figure 7.
However, somequestionsthatoughttobeposedare(a) Howdoeachoftheseindicatorsrelateto
eachother?, (b)Whatrelationshipistherebetweentheseusabilitycomponentsandusabilityitself?,
and(c)Whatrelationshipistherebetweeneachofthemandothervariablessuchasthe finalrating,
thenumberofhoursthatthestudentusedacomputer, orperformance, ifitwasassessed? Toanswer
thesequestions, compoundindicatorswereconstructed(whichwehavecalledLevelII). Usedfor
0.00 0.50 1.00 1.50 2.00 2.50 3.00 3.50 4.00 4.50 Questions Average: [T he theor etical c on ten ts ha
ve been giv
en clear and r
epr esen ta tiv ej [ma
terial has a good and car
eful pr esen ta tionj [T he e xer cises ha
ve been r
epr esen ta tiv ej [T he soft w ar
e used is appr
opria
te for w
orkshop obj ec
tiv
es
.j
[W
as it har
d t
o understandho
w the pr
ogr
am w
orks?j
[ models inc
orpor
ating shado
ws fr
om the r
eal en vir onmen t is impor tan tt o mak
e the sc
ene ...
[D
o y
ou think tha
t using objec
tsas ocluders help in
tegr
at
e the
model in the sc
ene?j
[C
ould y
ou ha
ve learned this c
on
ten
t independen
tly?j
[T
he number of e
xer
cises giv
en ar
e sufficien
t for hours of
pr
oposed w
ork
.j
[I ha
ve been able t
o solv
e the e
xer cises pr esen ted .j [G lobal opinionj [T he c ourse sa
tisfies the purpose for which it w
as designed
.
(spa
tial and gr
aphical skills ...
[soft
w
ar
e used will be useful in y
our immedia
te futur
e
as a studen
t?j
[soft
w
ar
e used will be useful in y
our immedia
te futur
e as a
engineer ?j
[AR
Technology will be useful in y
our immedia
te futur
e as a
studen
t?j
[AR
Technology will be useful in y
our immedia
te futur
e as a
engineer?j
[AR c
ould be useful on building and ar
chit ec tur al ar eas?j final assessmen t
thatpurposewastheanalysisofprincipalcomponentsextractedfromthegroupoforiginalsingle
indicatorsthatwouldformpartofeachindicator. Basedontheirvaluesandpercentagesofvariance
explained, eachcompoundindexwasconstructedinaccordancewiththefollowingformula:
Anequationtoconstructthequalityindicatoronthebasisofeachcomponentanditseigenvalues,
accordingtoPetersandButler(1970), where:Imjrepresentsthecompoundindicatortobeobtained
(efficiency, satisfaction, effectiveness, etc.)foreachj-thstudent;Zrjisthescoreofther-thcomponent
(factor)forthej-thstudent;and3y, isthesquarerootoftheeigenvalueforthatcomponent. This
thereforeensuredthatthecomponentswithahighervarianceexplainedhadgreaterweightinthe
ratingofthenewvariablebeingderived. Afterobtaining theindex, itwasnormalisedonascale
from 0to1. Thevalue obtainedillustratedeachstudent’s situationincomparison tothatofthe
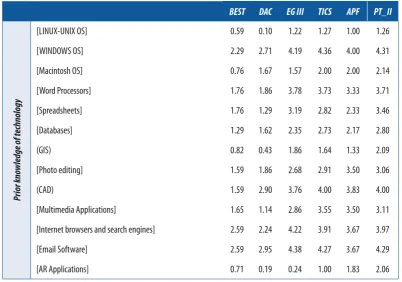
otherparticipantsinthequestionnaireforeachoftheseindices. Thus, thefollowingvariableswere
constructed:levelofeducation, efficiency, effectiveness, satisfactionandusability. Table2showsa
summaryofusabilityassessmentresultsobtainedfromthevariousexperiments.
Table 2
BEST DAC EG III TICS APF PT_II
Prior kno
wledge of t
echnology
[LINUX-UNIX OS] 0.59 0.10 1.22 1.27 1.00 1.26
[WINDOWS OS] 2.29 2.71 4.19 4.36 4.00 4.31
[Macintosh OS] 0.76 1.67 1.57 2.00 2.00 2.14
[Word Processors] 1.76 1.86 3.78 3.73 3.33 3.71
[Spreadsheets] 1.76 1.29 3.19 2.82 2.33 3.46
[Databases] 1.29 1.62 2.35 2.73 2.17 2.80
(GIS) 0.82 0.43 1.86 1.64 1.33 2.09
[Photo editing] 1.59 1.86 2.68 2.91 3.50 3.06
(CAD) 1.59 2.90 3.76 4.00 3.83 4.00
[Multimedia Applications] 1.65 1.14 2.86 3.55 3.50 3.11
[Internet browsers and search engines] 2.59 2.24 4.22 3.91 3.67 3.97
[Email Software] 2.59 2.95 4.38 4.27 3.67 4.29
BEST DAC EG III TICS APF PT_II
W
orkshop opinion
[The theoretical contents have been given clear and representative]
- - 3.62 3.73 3.67 3.17
[material has a good and careful presentation] 4.18 3.52 3.70 3.64 3.50 3.34
[The exercises have been representative] 4.53 4.05 3.97 3.91 3.50 3.49
[The software used is appropriate for workshop objectives.] 4.00 3.76 3.92 3.09 3.50 3.29
[The course satisfies the purpose for which it was designed. (New Graphical tools for presentations)]
4.35 3.86 3.76 3.73 3.83 3.31
[Could you have learned this content independently?] 2.88 2.57 2.89 2.82 1.83 3.37
[The number of exercises given is sufficient for hours of proposed work.]
4.18 3.62 3.41 3.18 3.50 3.17
[I have been able to solve the exercises presented.] 4.18 3.57 3.76 3.64 3.33 3.54
[Global opinion] 4.07 3.62 3.86 4.00 4.17 3.46
3D modelling and au
gment
ed r
ealit
y
[Prior knowledge of the use of modeling software?] - 2.95 2.41 2.27 -
-[Prior knowledge of the use of AR on mobile devices - 1.24 1.22 1.18 1.00 2.03
[Was it hard to understand how the program works?] - 2.71 2.24 2.00 2.67 2.40
[Software used will be useful in your immediate future as a student?]
- 3.67 3.38 3.73 3.50 3.37
[Software used will be useful in your immediate future as an engineer?]
- 3.81 3.32 3.64 4.00 3.34
[AR Technology will be useful in your immediate future as a student?]
- 3.86 3.11 3.45 3.50 3.31
[AR Technology will be useful in your immediate future as an engineer?]
- 3.90 3.27 3.36 3.83 3.54
[AR could be useful on building and architectural areas?] - 4.10 3.84 4.09 4.00 3.83
[Models incorporating shadows from the real environment is important to make the scene more realistic?]
- 4.29 4.03 3.27 4.33 3.89
[Do you think that using objects as occluders help integrate the model in the scene?]
- - 3.84 3.55 3.50 3.57
Final assessment 4.18 3.67 3.78 4.27 3.83 3.51
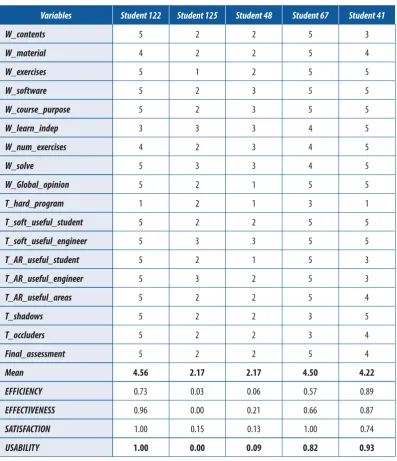
Focusingspecificallyonthestudents’assessmentsandtheirrelationshipwithpotentialcurricular
improvements, asanexamplewewouldpointoutthatstudent122(see Table3)hadthehighestscore
andmeaninhis/herratings. Incontrast, student125hadthelowestmeaninhis/heranswersand
consequentlythelowestrating, whichwouldsuggestthepotentialexistenceofadirectrelationship
betweentheanswermeanandtheusabilityindexassignedtoeachstudent. However, student48,
withameanidenticaltothepreviousstudent, didnothaveazerorating, butratherslightlyabove.
result. However, he/shehadalowerusabilityindexthanstudent41, who, withaloweranswermean,
hadahigherusabilityindex, duebasicallytoahigheroverallconsiderationofefficiency, effectiveness
andlevelofsatisfactionshown. Inotherwords, whilestudent41waslesssatisfiedwiththeworkshop
done, he/sheconsideredittobeefficientandeffective, andmoresothanstudent67, whogaveita
higherscorethantheotherstudents. Thus, theconstructedindexservedtocorrelateothervariables
suchasacademicperformance, whichwasnotdirectlyrelatedtotheanswermean, asitwasderived
fromtheindicatorsexplainingahigherpercentageofthelatter. Inthissection, thecomparisonofall
theexperimentsundertakenisshowninthetablebelow.
Table 3
Variables Student 122 Student 125 Student 48 Student 67 Student 41
W_contents 5 2 2 5 3
W_material 4 2 2 5 4
W_exercises 5 1 2 5 5
W_software 5 2 3 5 5
W_course_purpose 5 2 3 5 5
W_learn_indep 3 3 3 4 5
W_num_exercises 4 2 3 4 5
W_solve 5 3 3 4 5
W_Global_opinion 5 2 1 5 5
T_hard_program 1 2 1 3 1
T_soft_useful_student 5 2 2 5 5
T_soft_useful_engineer 5 3 3 5 5
T_AR_useful_student 5 2 1 5 3
T_AR_useful_engineer 5 3 2 5 3
T_AR_useful_areas 5 2 2 5 4
T_shadows 5 2 2 3 5
T_occluders 5 2 2 3 4
Final_assessment 5 2 2 5 4
Mean 4.56 2.17 2.17 4.50 4.22
EFFICIENCY 0.73 0.03 0.06 0.57 0.89
EFFECTIVENESS 0.96 0.00 0.21 0.66 0.87
SATISFACTION 1.00 0.15 0.13 1.00 0.74
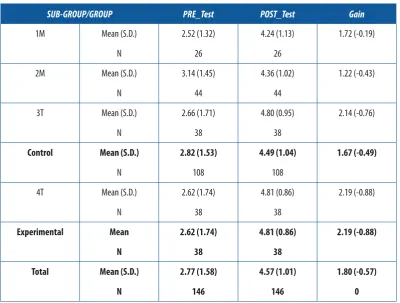
6.2. Improvement in academic performance
Asalreadymentioned, oncompletionofworkshops APFandPT II, thestudentssubmittedproposals
forassessmentbythelecturers. Bywayofanexample, Table4belowshows, bygroupandsub-group,
theresultsandgainsobtainedinthepre-testandpost-testworkshopmeasurementsfor Technical
ProjectsII (PT II), which hadthehighest numberof studentsand fromwhich themost relevant
conclusionscouldbedrawn.
Table 4
SUB-GROUP/GROUP PRE_Test POST_Test Gain
1M Mean (S.D.) 2.52 (1.32) 4.24 (1.13) 1.72 (-0.19)
N 26 26
2M Mean (S.D.) 3.14 (1.45) 4.36 (1.02) 1.22 (-0.43)
N 44 44
3T Mean (S.D.) 2.66 (1.71) 4.80 (0.95) 2.14 (-0.76)
N 38 38
Control Mean (S.D.) 2.82 (1.53) 4.49 (1.04) 1.67 (-0.49)
N 108 108
4T Mean (S.D.) 2.62 (1.74) 4.81 (0.86) 2.19 (-0.88)
N 38 38
Experimental Mean 2.62 (1.74) 4.81 (0.86) 2.19 (-0.88)
N 38 38
Total Mean (S.D.) 2.77 (1.58) 4.57 (1.01) 1.80 (-0.57)
N 146 146 0
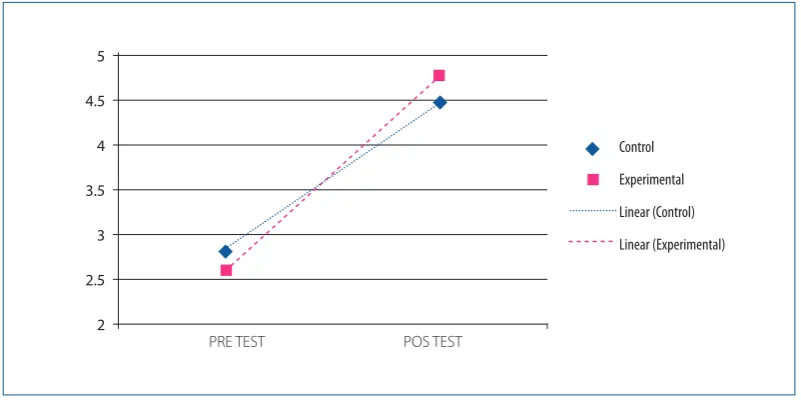
TheresultsshowthattheEG(4T)hadahigherscore(4.81)aftertraining(post-test), whichwas
0.24pointsabovetheCGmean(4.49). Inaddition, theyshowagreatergainincomparisontotheCG
Control Experimental Linear (Control) Linear (Experimental)
2 2.5 3 3.5 4 4.5 5
PRE TEST POS TEST
Figure 8.
7. General Conclusions
Regardingthequestionsposed atthestartofthisexperience, itshouldbenotedthatsignificant
differenceswerefoundinalltheworkshopsdependingonthetwoscenariosconsidered. IntheEG,
thesewerereflected inboththestudents’motivation levelsandimprovementin theiracademic
performance. Thus, theresultsobtainedshowthatthegroupsusingthenewmethod(ARm-learning)
securedanimprovementintheirscores. Obtainedfromthepost-testassessment, thesescoresshow
thegreatestgain incomparisontothepre-testdone atthestart oftheworkshop. Likewise, and
according tothedata, comparable in thesurveys carriedout, the experience generateda high
degreeofexpectationamongthestudents, whichledtogreatermotivationandengagementwhile
theworkshopwasbeingdone. Thesestudentshadhighscoresformaterials, workshopcontentand
themethodused, whichwouldsuggestthatthistechnologycouldbeeffectiveinlearningprocesses
asacomplementtoconventionaltraining..
Regardingtherelationshipsbetweenthevariablesthathadanimpactontheglobalopinionofthe
workshop, thecorrelationsobtainedwerenotparticularlyhighcomparedtotherestoftheworkshops.
Thoseforpresentationqualityandexerciserepresentativenesshadtheclearestrelationships(0.70
and0.73, respectively). In contrast, thevariables for priorknowledge of thetechnology anduse
ofsoftwareand operatingsystems did notsignificantlycorrelatewith theglobalopinionofthe
workshop. Finally, wecanassertthat ARm-learningtechnologytovisualisearchitecturalprojectsof
allkindshasgreatpotential, beitforvisualisingtheirscaleonsite, theirappearanceorthedifferent
stagesofexecution, andcontributestoabetterunderstandingandcommunicationofthem. This
allowsdifferentvirtualproposalstobecheckedandcomparedbeforetheyarebuiltforreal. Givenall
oftheabove, weconsiderthatthiseducationalexperiencehascontributednewpedagogicalvalues
thathaveallowedalreadyconsolidatedcontentandmethodologiestobedeveloped, andthatsuch
ofwork, wearedevelopingnewquestionnairestoincorporatequalitativeaspectsbasedonpersonal
interviews.
Acknowledgments.Funded project.VI National Plan for Non-Oriented Fundamental Research,
2008-2011, GovernmentofSpain. EDU-2012-37247/EDUC.
Referencces
Álvarez, G. (2012). New Technologiesin theUniversity Context: The Useof Blogs forDeveloping
Students’ReadingandWritingSkills. RUSC. Universities and Knowledge Society Journal, 9(2), 3-17|
185-199. doi:10.7238/rusc.v9i2.1160
Álvarez, G., & Bassa, L. (2013). ICTsandcollaborativelearning:acasestudyofaclassblogforimproving
thewritingskillsofpre-universitystudents. RUSC. Universities and Knowledge Society Journal, 10(2),
5-19|254-268. doi:10.7238/rusc.v10i2.1740
Allen, M., Regenbrecht, H., & Abbott, M. (2011). Smart-phoneaugmentedrealityforpublicparticipation
inurbanplanning. Proceedings of the 23rd Australian Computer-Human Interaction Conference on -
OzCHI’1, 11-20. doi:10.1145/2071536.2071538
Argüelles, M. J., Blanco, M., & Castán, J. M. (2013). DimensionsofPerceivedServiceQualityin Higher
EducationVirtualLearningEnvironments. RUSC. Universities and Knowledge Society Journal, 10(1)
89-106|268-285. doi:10.7238/rusc.v10i1.1411
Benbelkacem, S., Zenati-Henda, N, Belhocine, M., & Malek, S.(2009). AugmentedRealitySystemfor
E-maintenance Application. AIP Conference Proceedings,1107, 185-189. doi:10.1063/1.3106470
Fonseca, D., Martí, N., Navarro, I., Redondo, E., & Sanchez, A. (2012). Usodelarealidadaumentada
como plataforma educativa en la visualización arquitectónica [Using augmented reality and
educationplatform in architecturalvisualization:Evaluation ofusability and student’slevelof
satisfaction]. XIVSimposioInternacionaldeInformáticaEducativa. AndorralaVella, Andorra:La
SalleOpenUniversity, Eds. 1-6. Retrievedfromhttp://ieeexplore.ieee.org/stamp/stamp.jsp?tp=&a
rnumber=6403157&isnumber=6403152
Fonseca, D., Martí, N., Redondo, E., Navarro, I., & Sánchez, A. (2013). Relationshipbetweenstudentprofile,
tooluse, participation, andacademicperformancewiththeuseof AugmentedRealitytechnology
forvisualizedarchitecturemodels. Computers in Human Behavior. doi:10.1016/j.chb.2013.03.006
Gosset, W. S. (1908). TheProbableerrorofamean. Biometrika, 6(1), 1-25. doi:10.1093/biomet/6.1.1
Guttentag, A. (2010). Virtualreality: Applicationsandimplicationsfortourism. Tourism Management,
31(5), 637-651. doi:10.1016/j.tourman.2009.07.003
Haydar, M., Maidi, M., Rouseel, D., Mallem, M., Drap, P., Bale, K., & Chapman, P. (2008). VirtualExploration
ofUnderwater ArchaeologicalSites:VisualizationandInteractioninMixedRealityEnvironments.
InK. R.-E. M. Ashley, S. Hermon & A. Proenca(Eds.). Proceedings of VAST: International Symposium
on Virtual Reality, Archaeology and Intelligent Cultural Heritage, 141-148. doi:10.2312/VAST/
Hincapie, M., Caponio, A., Rios, H., & González, E.(2011). Anintroductionto AugmentedRealitywith
applications in aeronautical maintenance. 2011 13th International Conference on Transparent
Optical Networks,1-4. doi:10.1109/ICTON.2011.5970856
Honken, R., Jazz, K., Boudreau, Z., & Yearous, J. (2012). Buildingasustainablemobiledevicestrategy
to meet the needs of various stakeholder groups. Proceedings of the ACM SIGUCCS ’12, 41.
doi:10.1145/2382456.2382466
Hsu, C. (2011). The Feasibility of Augmented Reality on Virtual Tourism Website. 2011 Fourth
International Conference on Ubi-Media Computing,253-256. doi:10.1109/U-MEDIA.2011.66
Kaufmann, H., Schmalstieg, D., & Wagner, M. (2000). Construct3D: A VirtualReality Applicationfor
Mathematics andGeometry Education. Education and Information Technologies, 5(4), 263-276.
doi:10.1023/A:1012049406877
Kondo, T. (2006). AugmentedLearningEnvironment usingMixedReality Technology. In T. Reeves
& S. Yamashita (Eds.). Proceedings of World Conference on E-Learning in Corporate, Government, Healthcare, and Higher Education 2006(pp. 83-87). Japan: AACE.
Kristoffersen, S., & Ljungberg, F. (1999). Mobileinformatics. ACM SIGCHI Bulletin, 31(1), 29-34. Retrieved
fromhttp://portal.acm.org/citation.cfm?doid=329671.329685.
Lehner, F., & Nosekabel, H. (2002). The role of mobile devices in E with a wireless E-Learning
environment. In Wireless and Mobile. Retrieved from http://ieeexplore.ieee.org/lpdocs/epic03/
wrapper.htm?arnumber=1039229.
Martín Gutiérrez, J. (2010). Estudio y evaluación de contenidos didácticos en el desarrollo de las
habilidades espaciales en el ámbito de la ingeniería [Study and assessmentof didacticcontent
inthedevelopmentofspatialabilitiesinthe fieldofengineering] (Doctoralthesis). Universitat
PolitècnicadeValència, Valencia, Spain.
Martin, S., Díaz, G., Sancristobal, E., Gil, R., Castro, M., & Peire, J. (2011). Newtechnology trendsin
education:Sevenyearsofforecastsandconvergence. Computers & Education, 57(3), 1893-1906.
doi:10.1016/j.compedu.2011.04.003
Oksman, V., Siltanen, S., & Ainasoja, M. (2012). User participation in co-creative services:
Developing Virtual and Augmented Reality Tools for Do-it-Yourself Home Design.
Proceedings of the 16th International Academic MindTrek Conference on - MindTrek ’12,229-230.
doi:10.1145/2393132.2393181
Paiva, P. V. F., Machado, L. S., & Oliveira, J. C. de (2012). A Peer-to-Peer Multicast Architecture for
Supporting Collaborative Virtual Environments (CVEs) in Medicine. 2012 14th Symposium on
Virtual and Augmented Reality,165-173. doi:10.1109/SVR.2012.7.
Peters, W. S., & Butler, J. Q. (1970). Theconstruction ofregionaleconomic indicatorsbyprincipal
components. The Annals of Regional Science, 4(1), 1-14. doi:10.1007/BF01287726
Peula, J., Zumaquero, M., Urdiales. C., Barbancho, A., & Sandoval, F. (2007). Realidad aumentada
aplicadaaherramientasdidácticasmusicales. GrupoISIS.
Prahalad, C.. & Hamel, G. (1990). Thecorecompetenceofthecorporation. Harvard Business Review,
68(3), 9-91.
Redondo, E., Sánchez, A., Fonseca, D., & Peredo, A. (2103). ArchitecturalGeo-E-LearningGeolocated
press). In R. Shumaker (Ed.), VAMR/HCII 2013, Proceedings, Part II, LNCS 8022, (pp. 188-197).
doi:10.1007/978-3-642-39420-1
RedondoDomínguez, E., SánchezRiera, A., & FonsecaEscudero, D. (2012). Developinganaugmented
realityapplicationintheframeworkofarchitecturedegree. Proceedings of the 2012 ACM Workshop
on User experience in e-learning and augmented technologies in education – UXeLATE’12, 37-42.
doi:10.1145/2390895.2390905
SánchezRiera, A., Redondo, E., & Fonseca, D. (2012). Developinganaugmentedrealityapplicationin
theframeworkofarchitecturedegree. Proceedings of the 2012 ACM workshop on User experience in
e-learning and augmented technologies in education – UXeLATE’12, 37. doi:10.1145/2390895.2390905
Sánchez, A., Redondo, E., Fonseca, D., & Navarro, I. (2013). Construction processesusing mobile
augmentedreality. A studycaseinBuildingEngineeringdegree. Advances in Intelligent Systems
and Computing, 206, 1053-1062. doi:10.1007/978-3-642-36981-0_100
Schall, G., Mendez, E., Kruijff, E., Veas, E., Junghanns, S., Reitinger, B., & Schmalstieg, D. (2008). Handheld
Augmented Reality for underground infrastructure visualization. Personal and Ubiquitous
Computing, 13(4), 281-291. doi:10.1007/s00779-008-0204-5
Shin, D. H., & Dunston, P. S. (2008). Identification of application areas for Augmented Reality in
industrialconstructionbased ontechnologysuitability. Automation in Construction, 17(7), 882
-894. doi:10.1016/j.autcon.2008.02.012
Tillon, A. B., Marchal, I., & Houlier, P. (2011). Mobileaugmentedrealityinthemuseum:Canalace
-liketechnologytakeyouclosertoworksofart? 2011 IEEE International Symposium on Mixed and
Augmented Reality - Arts, Media, and Humanities,41-47. doi:10.1109/ISMAR-AMH.2011.6093655
Tonn, C., Petzold, F., Olivier B., Grundhofer, A., & Donath, D.(2008). Spatial AugmentedReality for
Architecture–Designingandplanningwithandwithinexistingbuildings. International Journal of
Architectural Computing, 6(1), 41-58. doi:10.1260/147807708784640126
Wang, X. (2008). ImplementationandExperimentationofaMixedRealityCollaborativeDesignSpace.
InW. Shen, J. Yong, Y. Yang, J. Barthes, & J. Luo(Eds.). Lecture Notes in Computer Science:Vol. 5236(pp.