RESEARCH ARTICLE
QUANTIFICATION OF LYCOPENE EXTRACTED FROM WATERMELON AND TOMATO VARIETIES
FROM NAKULABYE MARKET IN KAMPALA, UGANDA
*1
Haji Khamis,
2Kituyi Lusweti,
3Haji Mwevura,
3Steven Nyanzi and
3Kiremire
1
Department of Chemistry and Biochemistry, P.0.Box 1125-30100, University of Eldoret, Chepkoilel, Kenya
2
The State University of Zanzibar (SUZA), P. O. Box 146, Zanzibar, Tanzania
3
Makerere University, Chemistry Department, P. O. Box 7062, Kampala, Uganda
ARTICLE INFO
ABSTRACT
Tomatoes (Solanum lycopersicum) and red-fleshed watermelons (Citrullus lanatus) contain a high level of lycopene, which has been reported to have many important health benefits. Watermelon tomato varieties are available plentifully in Uganda, however, little information existing in Uganda concerning the quantity of lycopene in watermelon and tomato varieties.The objective of this study was to separate and quantify lycopene from selectedwatermelonand tomato varieties from Uganda. The varieties were bought from Nakulabye market in Kampala, and extracted by using solvent system of hexane/acetone/ethyl acetate (4:2:1 v/v/v). The extracts were filtered and the lycopenelayer separated from the filtrate, washed, dried by rotary evaporator and then dissolved in hexane. The concentrated hexane solution was then fractionated by using an alumina column chromatography. The lycopene fractions were collected, dried by using nitrogen gas and then weighed by chemical balance. The solutions of lycopene in hexane were scanned by using UV-VIS spectrophotometer. The results obtained showed that the quantity of lycopenevaries from140 μg/g to 3400 μg/g wet weight in tomato and from 326 μg/g to 1670 μg/g in watermelon. The variation is caused by different conditions. Both tomato varieties and watermelons contain appreciable quantity of lycopene necessary for daily food intake. It is advisable to investigate the best conditions for growing tomatoesand watermelons so as to contain the highest possible quantity of lycopene.
Copyright©2017,Haji Khamis et al. This is an open access article distributed under the Creative Commons Attribution License, which permits unrestricted use, distribution, and reproduction in any medium, provided the original work is properly cited.
INTRODUCTION
Lycopene is a pigment which is principally responsible for the characteristic deep-red colour of ripe tomato fruits and tomato products (Shi & Maguer, 2000). It occurs naturally in tomato as a carotenoid and is a major component found in serum (Kun
et al., 2006). It also occurs naturally in certain fruits,
vegetables, algae and fungi. Other significant sources are watermelon, pink grapefruit, pink guava, papaya and apricots
(Gerster, 1997). Lycopene is a C40-carotenoid made up of eight isoprene units. β-carotene, the yellow pigment of the carrot, is the isomer of lycopene. Lycopene is an unsaturated hydrocarbon with chemical name of 2,6,10,14,19,23,27,31-octamethyl-2, 6, 8, 10, 12, 14, 16, 18, 20, 22, 24, 26, 30-dotriacontriacontatridecaene. Its molecular weight is 536.9
(Gerster, 1997). Dietary lycopene has ability or potential to reduce the risk of chronic diseases such as cancer and coronary heart disease (Kun et al., 2006). In human health lycopene is thought to play the role of an antioxidant and has beneficial
*Corresponding author: Haji Khamis,
Department of Chemistry and Biochemistry, P.0.Box 1125-30100, University of Eldoret, Chepkoilel, Kenya.
properties to other mechanisms including intercellular gap junction communication, hormonal and immune system modulation and metabolic pathways (Kun et al., 2006). Its presence in diet makes considerable interest as it exhibits a physical quenching rate constant with singlet oxygen, almost twice as that of β-carotene (Shi & Maguer, 2000). Lycopene scavenges reactive oxygen species, which are aggressive chemicals always ready to react with cell components, causing oxidative damage and loss of proper cell function (Wer, 2001). Lycopene is a precursor of vitamin A (Atessahin et al, 2006). Tomatoes (Solanum lycopersicum) such as elliptical tomato
(Lycopersicon esculentum), small spherical tomato (Solanum
quitoense) and large spherical tomato (Solanum lycopersicum
cerasiforme) varieties and tomato products are the major
sources of lycopene compounds and an important source of carotenoids in the human diet. Red-fleshed watermelon (such
as Citrullus lanatus), contains high quantity of lycopene, a red
pigmented carotenoid with powerful antioxidant properties (Davis et al, 2007). The red watermelon is rich in lycopene and is a far better source of the carotenoid lycopene than tomatoes are (Raloff, 2002). Cooking the tomato in a little fat, such as olive oil, breaks down the cell walls and makes the
fat-ISSN: 0976-3376
Vol. 08, Issue, 10, pp.6180-6186, October,Asian Journal of Science and Technology 2017ASIAN JOURNAL OF
SCIENCE AND TECHNOLOGY
Article History:
Received 04th July, 2017
Received in revised form
19th August, 2017
Accepted 23rd September, 2017
Published online 17th October, 2017
Key words:
soluble lycopene more available (Everson et al, 2004). Most of people are not aware of the amount and importance of lycopene available in local available fruits such as tomatoes and red-fleshed watermelon and hence do not give full respect of these fruits. Because of lack of awareness food staff in Uganda are fortified with vitamin A (Kawuma, 2002). The objective of this study was to separate and quantify lycopene from selected watermelon and tomato varieties from Uganda.
MATERIALS AND METHODS
Apparatus
Beakers, conical flasks, measuring cylinders, dropper, rotary evaporator and glass column separation for chromatography,
analytical balance, UV-1700 CE Spectrophotometer
(Shimodzu, Kyoto, Japan), for analysing lycopene samples.
Chemicals
Alumina (chromatography grade), saturated aqueous solution of sodium chloride, 10% potassium carbonate aqueous solution, anhydrous magnesium sulphate, Acetone, hexane, ethanol, ethyl acetate, pet-ether, magnesium sulphate, sodium chloride and potassium carbonate. Nitrogen gas was used for drying lycopene extracts.
Sample Collection
Samples of tomato and watermelon fruits were bought from Nakulabye market in Kampala. The samples were usually processed immediately because of lack of sufficient storage facilities.
Tomato fruit varieties
Elliptical tomato (Lycopersicon esculentum), small spherical tomato (Solanum quitoense) and large spherical tomato
(Solanum lycopersicum cerasiforme) varieties.
Watermelon (Citrullus lanatus)
Red fleshed watermelons with green coat.
Sample Processing
Samples of tomato and red-fleshed watermelon were cut separately into smallest possible pieces and then ground to most possible small particles using mortar and pestle. A mass of 30 g, 50 g and 215 g of each variety were measured and extracted. The reason of changing mass of sample was to try to extract more lycopene for analytical purposes.
Sample Extractions
A sub sample of 30 g of grounded tomato was put in a beaker and extracted with a mixture of ethyl acetate, acetone and hexane (1:2:4) and the volume used was 16 ml:32 ml: 64 ml. The extract was filtered and the filtrate was placed into a second beaker. The extraction of the solid residue was repeated once more with another solvent mixture ofthe same solvent system and the filtrates were combined together. The filtrate was concentrated to lowest possible volume by
evaporating the solvent under vacuum (Tan, 2006). A sample of 30 g of flesh of watermelon was also grounded, extracted using the same solvent mixture and then concentrated (Collins
et al, 2004). The same procedure was repeated for 50 g mass
of sample. For 215 g mass of sample the volume used was 32 ml: 16 ml: 8 ml. Before a chromatographic separation, the
lycopene-containing organic layer was separated from two
layers of original extract by using funnel separation, washed by using saturated sodium chloride solution, followed by 10% aqueous potassium carbonate and another portion of saturated sodium chloride solution then dried with anhydrous magnesium sulphate (Morris et al,1994).
Preparation of a Column
Concentrated crude extracts were subjected to column chromatography. The column chromatography packed with alumina was used. A chromatography column was mounted at a retort stand vertically. A small amount of cotton was placed at the bottom of column. The cotton was fixed down by using long glass rod and the stop cork was closed. Hexane (5 ml) was added and air bubbles were taped out. Clean sand (1 cm) was added to the column. The solvent column level was above the sand level. Any trapped air was removed once again by tapping on the column. Then, activated alumina (13 g – 14 g) was mixed with hexane to make thick but pourable slurry. The slurry was mixed well to suspend the alumina, and then poured carefully into the column. The length of Alumina column was about 15 cm - 17 cm. The trapped air bubbles at this point were removed, as air bubbles retained in the column would reduce separation efficiency. Alumina was allowed to settle, and then the solvent was allowed to run at a slow rate from the bottom of column until the solvent level was 2 cm – 3 cm above the top of alumina bed. Slurry of sand and hexane was prepared and added at the top of the column with length of about 0.5 cm. The solvent was slowly allowed to drip from the bottom of the column until its level was just above the top of the sand (Tan, 2006).
Separation
Column chromatographic separation technique was used to separate lycopene from other carotenoids. The concentrated extracts were put to the top of the alumina column and eluted
with hexane. The solventwas allowed to run from the bottom
weight of the dry lycopene was measured. The extracts were taken for spectral analysis as soon as possible. The melting point of lycopene was measured by using the capillary tube attached to a thermometer and then immersed in paraffin oil. The oil was heated on a bunsen burner till the lycopene crystal in tube started to melt and hence the temperature recorded.
Analysis of Lycopene
UV-VIS Spectrophotometer Scans
The optimum range from 800 nm in the visible region to 200 nm in the ultraviolet was chosen. A cuvette filled with hexane was allowed to run as the blank (baseline) and then after filled three-quarter full of prepared dilute solution of lycopene in hexane. An ultraviolet–visible spectrum of the lycopene fractions was obtained by using the ocean optics spectrograph of spectrophotometer. The instrument sensitivity was adjusted so that the strongest peak reached 75 – 100% of the vertical scale (Wrolstad, 2005).
Quantitative analysis
Concentrations (mass) of lycopene extracted were measured by using analytical balance. The quantities obtained were recorded and converted into microgram per gram of sample (µg/g).
RESULTS AND DISCUSSION
Level of lycopene extracted: Concentrations of lycopene
(µg/g wet weight) extracted in different samples were presented in Table 1. In watermelon (Citrullus lanatus) concentration of lycopene varied from 326 μg/g to 1670 μg/g of sample with average concentration of 998 μg/g and standard deviation of 475. Quantity of lycopene in tomatoes showed minor variations between species with highest average
concentration found in Lycopersicon esculentum. In
Lycopersicon esculentum species the level of lycopenevaried
from 279 μg/g to 3330 μg/g of sample and its average concentration was 1482 μg/g. Number of µg of lycopene per gram of fresh sample in Solanum lycopersicum cerasiforme ranged from 140 μg/g to 3400 μg/g while that of Solanum
quitoense was between 333 μg/g and 2670 μg/g of sample.
Their average concentrations were 1470 μg/g and 1281 μg/g
for Solanum lycopersicum cerasiforme and Solanum quitoense,
respectively. Their standard deviations were 1038, 1242 and 876respectively. Comparison of the determined lycopene in this study with those reported in the literature show that other studies are reporting much higher concentration in tomato (8800 μg/g – 42000 μg/g)] and watermelon [(23000 μg/g – 72000 μg/g)] wet weight (Gerster, 1997) than those determined in tomato (140 μg/g – 3400 μg/g) wet weight and watermelon (326 μg/g – 1670 μg/g) wet weight in this study.
Table 1. Quantities of lycopene extracted from watermelon and tomato samples
Sample used
S/N
Mass of sample in g
Mass of lycopene in g
Mass of lycopene in µg/g of sample
Mean (average) Variance Std deviation
Citrullus lanatus 1 2 3 4 30 30 50 215 0.03 0.05 0.05 0.07 1000 1670 1000 326
998 225794 475
Lycopersicon esculentum 1 2 3 4 5 30 30 30 50 215 0.04 0.05 0.10 0.04 0.06 1330 1670 3330 800 279
1482 1077177 1038
Solanum lycopersicum cerasiforme 1 2 3 4 30 30 50 215 0.02 0.05 0.17 0.03 667 1670 3400 140
1470 1544652 1242
Solanum quitoense 1 2 3 4 30 30 215 30 0.04 0.08 0.17 0.01 1330 2670 791 333
1281 767632 876
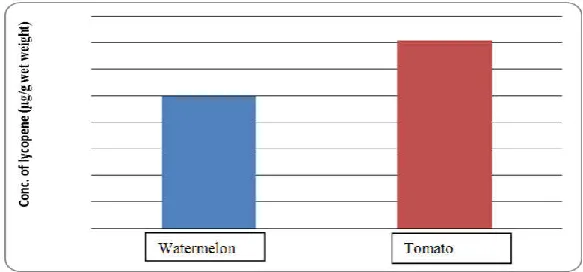
Comparison of lycopene content in watermelon and tomato samples is shown in the following Figure 1
Also, lower concentrations of lycopene were reported from other studies. One study reported that level of lycopene in mini watermelons were ranging from 67 µg/g to 96 µg/g fruit weight (Collins et al, 2004). Another research done in University of Madrid (Spain) reported mass of lycopene in watermelon (seedless) was 6.5 ± 0.1 μg/g (Barba et al., 2006). Variety and growing environment are among the causes of the difference (Mayeaux, 2006). Contrary to this study, literature reported higher lycopene content in watermelon than in tomatoes, regardless of higher water content in watermelon compared to tomato.
Lycopene content in fruits: In general the study has shown
that the lycopene content (μg/g wet weight) in tomato is relatively higher compared to watermelon (Figure 1). This was probably attributed by higher water content in watermelon compared to tomato. In this regard the lycopene content on the basis of dry mass samples was likely to be higher in watermelon than tomato. The observed variations were attributed to the quality of the fruits (May –July) were of higher quality than those from (September – November). The time taken for sample from sampling to analysis was longer for those from May –July (more than 40 days) than those from September – November (less than 40 days). Though the extracted lycopene was kept in hexane solution it seemed that the degradation of lycopene had occurred. This could be due to the fact that the stored temperature did not reach -20 C and it was not in a vacuum space, good conditions for controlling degradation of lycopene(Gerster, 1997).
The melting point of lycopene: The measured melting point of
lycopene obtained from this research was 170 C - 172 C. From literature the melting point of lycopene is 172 C –175 C
(Gerster, 1997). The result is quite close to that in literature and the short deviation might be caused by the error of measurement due to the differences in apparatus used and the sensitivity of thermometer and graduated scale. The deviation might also be caused by the different in environment, the external atmospheric pressure and temperature, and degree of purity of lycopene.
Correlations of lycopene from watermelon and tomato varieties
From Citrullus lanatus and Lycopersicon esculentum: The
correlation of level of lycopene extracted from Citrullus
lanatus and Lycopersicon esculentum is well shown in
following diagram:
Correlation = 0.326
Figure 2. Correlation of lycopene concentration from Citrullus
lanatus and Lycopersiconesculentum
The graph shows that the concentration of lycopene extracted from watermelon (Citrullus lanatus) increased with the increase concentrationof Lycopersiconesculentum. Since the variation is positively increased it seemed to what extent living bodies can benefit positively to these fruits.
From Citrullus lanatus and Solanum lycopersicum
cerasiforme: The correlation of level of lycopene extracted
from Citrullus lanatus and Solanum lycopersicum
cerasiforme is well shown in following Figure 3:
Correlation = 0.436
Figure 3. Correlation of lycopene concentration from Citrullus
lanatus and Solanum lycopersicum cerasiforme
The correlation in the above graph shows that the concentration of lycopene extracted from watermelon
(Citrullus lanatus) increased with the increase concentration of
Solanum lycopersicum cerasiforme. Since the variation is
positively increased it seemed to what extent living organisms can benefit positively to these fruits due nutrient (lycopene) contents.
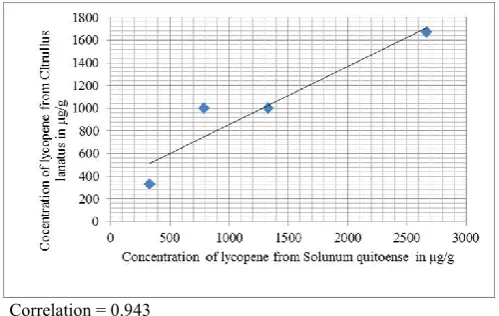
From Citrullus lanatus andSolanum quitoense
The correlation of concentration of lycopene extracted from watermelon (Citrullus lanatus) and Solanum quitoense is well indicated in following diagram:
Correlation = 0.943
Figure 4. Correlation of lycopene concentration from Citrullus
lanatus and Solanum quitoense
The correlation in the above diagram shows that the level of
lycopene extracted from watermelon (Citrullus lanatus)
increased with the increase concentration of Solanum
quitoense. Since the variation is positively increased it seemed
Correlations of lycopene concentration within tomato varieties
Between Lycoperscon esculentum and Solanum
lycopersicum cerasiforme: The relationship between levels of
lycopene extracted from Lycoperscon esculentum and Solanum
lycopersicum cerasiforme is shown in following Figure 5.
Correlation = 0.986
Figure 5. Correlation of lycopene concentration from Lycoperscon
esculentum and Solanumlycopersicum cerasiforme
The correlation in the above graph shows that the
concentration of lycopene extracted from Lycoperscon
esculentum increased with the increase concentration of
Solanum lycopersicum cerasiforme. Since the variation is
positively increased it seemed to what extent living organisms can benefit positively to these fruits due to nutrient (lycopene) contents. It also seems to what extent the varieties of tomato are nearly in similarity.
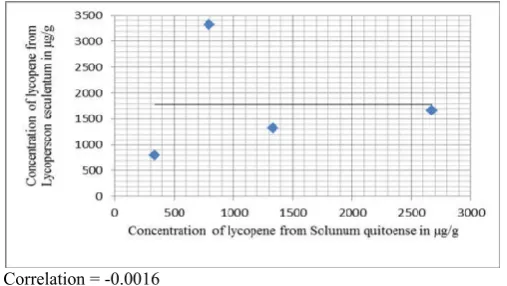
Between Lycoperscon esculentum and Solanum quitoense
The relationship between levels of lycopene extracted from
Lycoperscon esculentum and Solanum quitoense is shown in
following Figure 6:
Correlation = -0.0016
Figure 6. Correlation of lycopene concentration from Lycoperscon
esculentum and Solanum quitoense
The above diagram shows that correlation between two parameters is nearly nil.
Between Solanum lycopersicum cerasiforme and Solanum
quitoense: The following Figure 7 shows relationship between
levels of lycopene extracted from Solanum lycopersicum
cerasiforme and Solanum quitoense as shown below:
Correlation = 0.127
Figure 7. Correlation of lycopene concentration from Solanum
lycopersicum cerasiforme and Solanum quitoense
The correlation in the above graph shows that the
concentration of lycopene extracted from Solanum
lycopersicum cerasiforme increased slightly with the increase
concentration of Solanum quitoense. Since the variation is positively increased it seemed to what extent living organisms can benefit positively to these fruits due nutrient (lycopene) contents.
Conclusion
The local available fruits contain good amount of lycopene and therefore have high nutrients value. Quantity of extracted lycopene from both tomatoes and watermelons varied due to different conditions. Lycopene can undergo degradation when placed anywhere if not in conditions that stop degradation as explained in literature. Analysis of lycopene should be done immediately after extraction and separation.
Recommendations
Society should be encouraged to use available fruits with high lycopene content. The lycopene content should be considered in market value. Individuals should encourage using and drink tomato and watermelon juice since the process take place in normal temperature with least degradation compared with other processes. Further studies should be done on investigation of lycopene in other fruits and crops. It is far better and advisable to study and investigate the best conditions for growing tomatoes and watermelons so as to contain the highest possible quantity of lycopene.
Acknowledgement
I would like to thank Madam Jane Namukobe (lMakerere University lecturer), Mr Budigi (chief Lab technician of Makerere University), Dr Jestus (Makerere University lecturer), Mr Abdalla Ibrahim (SUZA lecturer) and Ministry of Education of Zanzibar for their help.
REFERENCES
Atessahin, A., Urk, G., Karahan, I., Yilmaz, S., Ceribasi, A. and Bulmus, O. 2006. Lycopene Prevents Adriamaycin Induced and Testicular Toxicity in Rates. Journal of
Science Direct Fertility and Sterility, 85, 1216-1222.
β-carotene in vegetables. Journal of Food Chemistry, 95(2), 328-336.
Collins, J.K.; Perkins-Viazic, P. and Robert, B.W. (2004,
December). A new World of Watermelon. Agricultural
Research Magazine,10-11.
Davis, A.R.; Collins, J.; Fish, W.W.; Tadmor, Y.; Webber III, C.I. and Veazie, P. (2007). Rapid Method for Total
Carotenoid Detection in Canary Yellow-Fleshed
Watermelon. Journal of Food Science, 72, 319.
Everson, K.M.; Pharm, D.; McQueen, C.E. and Pharm, D. (2004). Lycopene for Prevention and Treatment of Prostate
Cancer. American Journal of health-system pharmacy,
61(15), 1563, 1564-156.
Gerster, H., (1997). The Potential Role of Lycopene for Human Health. Journal of American Coll Nutrition, 16(2), 109-126.
Kamuli District in Uganda. Journal of Africa Health Science, 2(1), 11–15.
Kawuma, M. (2002). Sugar as a Potential Vehicle for Vitamin A Fortification: Experience from
Kun, Y.; Lule, U. S. and Lin, D. X. (2006). Lycopene: Its Properties and Relationship to Human Health. Journal of
Food Review International, 22(4), 309-333.
Mayeaux, M.; Xu, Z.; King, J.M.; Prinyawiwatkul, W.(2006).
Effects of Cooking Conditions on the Lycopene Content in Tomatoes. Journal of Food Science, 71(8), 461 - 464.
Morris, A.; Cunnighai, S.; Benos, D. and Frizzell, R. (1994). Process for the Isolation and Purification of Lycopene Crystal. Journal of American Association, 272(18), 1439-1441.
Raloff, J. (2002, June). Watermelon Packs a Powerful
Lycopene Punch. Agricultural Research Magazine, 50,
12-13.
Shi, J. and Maguer, M. (2000). Lycopene in Tomatoes:
Chemical and Physical Properties Affected by Food Processing. Journal of Critical Reviews in Food Science
and Nutrition, 40, 1-42.
Tan, B. (2006). Analytical and Preparative Chromatography of Tomato Paste Carotenoids. Journal Food Science, 53(3), 954-959.
Wer, Y.; Zhang, T.; Xu, G. and Chirotto, Y. (2001). Analytical
and Preparative high-Speed Counter-current
Chromatography for Separation of Lycopene from Crude Extract of Tomato Paste. Journal of Chromatography A, 929(1-2), 169-173.
Wrolstad, R. E. (2005). F.2.2.Detection and Measurement of Carotenoids by UV/VIS Spectrophotometry. Handbook of Food Analytical Chemistry, Volume1: water, protein, enzymes, lipids and carbohydrates.
Appendix
Chemical structure of isoprene unit
Isoprene unit
The isoprene unit is named as 2-methyl 1, 3 butadiene.
Characteristics of lycopene
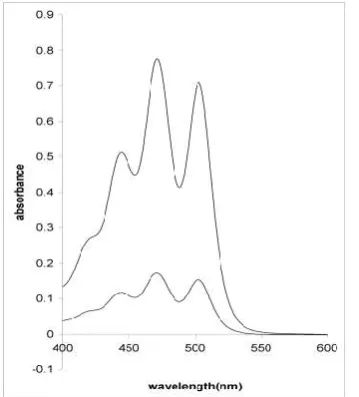
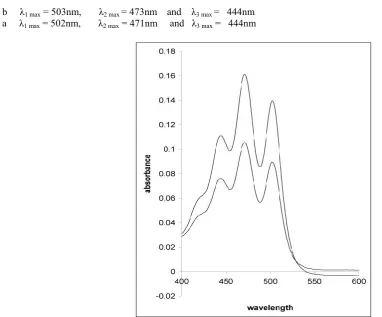
When solution of lycopene was run in UV/VIS Spectrophotometer it gave characteristics with three maximum peaks of absorption spectrum as shown below for both watermelon and tomato extracts
In b λ1 max = 503nm, λ2 max = 473nm and λ3 max = 444nm In a λ1 max = 502nm, λ2 max = 471nm and λ3 max = 444nm
Figure 9. Normal derivative of absorption spectra characteristics of lycopene from red-orange band (b) and lycopene from yellow-orange band (a) extracted from tomato. Concentration of lycopene scanned in UV-VIS spectrophotometer was 0.01g/litre in hexane
solution for each of the two
In b λ1 max = 502nm, λ2 max = 472nm and λ3 max = 444nm In a λ1 max 1= 502nm, λ2 max = 471nm and λ3 max = 444nm
λ max = wavelength of maximum peak of absorption spectrum.