Abstract—The production of business analytics inevitably involves applying some statistical procedures to a data set related to the decision problem for a particular scenario. In light of the sheer volume of the data set, it is very often that the computation chores rely very much upon statistical software or others alike. Most of the software for producing business analytics on the market is proprietary with little openness. In this research we exploit the idea of statistical analysis as a service on the cloud and develop a web-based multiple regressor for data analysis. To maintain the portability of the multiple regressor to a maximum degree, the regressor is implemented using Java technology on an open platform with R providing analytic functions. Results of this research have a potential to address issues such as the staggering cost of license fees of commercial packages for SMBs and the geography limitations on where the analytic service is available. This research also reveals the promising future of open-source ware in business applications.
Index Terms—Multiple regression analysis, java, R, active support, cloud computing.
I. INTRODUCTION
The prompt availability of quality business analytics is critical to the success and survival of a business. In modern society, the sheer volume of data set of a business entails the need of analytics software for data analysis. Although both AI techniques and statistical techniques are available for the production of business analytics, a large portion of them is generated by statistical procedures.
It is no surprise that many commercial business analytics software are available on the market. These software are powerful with abundant of functions that may be too many for businesses, in particular, the small and medium-sized businesses (SMBs). The staggering cost of license fees for acquiring commercial software is a sticky issue for a business of any shape and form. Furthermore the proper application of statistical procedures to data analysis for the production of decision information of high quality is another issue that needs to be addressed [1].
In essence what cloud computing tries to achieve is not completely new from the old practice. The idea of delivering computing services over the internet has been around for many decades before the term emerged. Cloud computing is promising and thus this research exploits a tentative idea of dedicating statistical analysis as a service, with open-source ware, on the internet. Nonetheless, since multiple regression
Manuscript received January 15, 2014; revised March 13, 2014. Chien Ho Wu is with the Statistics and Information Science Department, Fu Jen Catholic University of New Taipei City, 24205 Taiwan (e-mail: [email protected]).
analysis is a powerful and comprehensive method for analyzing relationships between quantitative variables, and has many applications in business, engineer, social sciences and many others, it is selected as the candidate method for testifying our initiative on delivering statistical analysis as a service.
An all-mighty software package is good for solving business problems at hand. Having said that, we believe that a simple, straight forward, flexible and cost effective system that satisfies business decision requirements is better than a software package with functions covering unexpected needs of a business. In line with the spirit of cloud computing and the idea of actively supporting a data analysis process [1], we have developed a web application for multiple regression analysis that can be accessed from internet through browsers. Following the principle of KISS and the morale of public good, the web application is implemented with Java technology and employs open-source ware as building blocks. The system implemented imposes steps for multiple regression analysis on users of the system and provides preliminary interpretations of abstruse yet important statistics to ensure correct application of the statistical procedure.
II. REVIEW OF MULTIPLE REGRESSION ANALYSIS Regression analysis is one of the forecasting techniques in Statistics. It aims at finding the statistical relation between a quantitative variable of interest, called dependent or response variable, and one or more other variables, called independent or predictor variables.
The equation that describes how the response variable relates to independent variables is called the regression model. The regression model used in multiple regression analysis has the following general form [2]-[4].
0 1 1 2 2 n n
Y
X
X
X
(1) Y is a linear function of X and 0,1,…,n are regressionparameters. The random variable ϵ accounts for the variability in Y which cannot be explained by the linear effect of the n independent variables. The error term ϵ is a random variable and is assumed to be independent N (0, 2).
The equality of variances for the error terms can be tested by a statistical procedure called the Levene test [5]. The Durbin-Watson test [6] can be used to determine whether or not the error terms are independent. The normality of error terms can be tested by Kolmogorov–Smirnov test or Shapiro test [7], [8].
Sample statistics (denoted b0, b1, b2,…, bn) are usually
computed as estimates of the regression parameters. By substituting the values of the sample statistics for the
A Web-Based Multiple Regressor for Data Analysis Using
R
regression parameters in the regression model, we obtain the estimated regression equation, as shown in (2).
0 1 1 2 2
ˆ
n n
Y b b X b X b X (2) where YˆE Y( )
In regression analysis, The F test reveals the overall significance of the estimated regression equation. If the F test indicates an overall significance, the t test is used to determine whether each of the individual independent variables is significant. The goodness of fit for the estimated regression equation is measured by the coefficient of determination, denoted R2.
When multicollinearity is severe little faith can be placed in the individual regression coefficients. Attempts should be made to avoid including independent variables that are highly correlated in the model.
Outliers represent observations that are suspect and
warrant careful examination. Influential observations are those that are valid and have high leverages on the estimated regression model. The existence of influential observations entails collecting data on intermediate values of X in order to better understand the relationship between X and Y. When only one independent variable is present, scatter diagrams and box plots of observations or standardized residual plots can help detect the existence of outliers or influential observations. For multiple regression models, Cook’s D statistic is one of the measures that can be used to identify influential observations [2], [9].
III. SYSTEM DESIGN
The objective of the system is to support multiple regression analysis at the client side requiring minimum efforts from users of the system. All analytic functions are realized at the server side with R [10].
A. System Functions
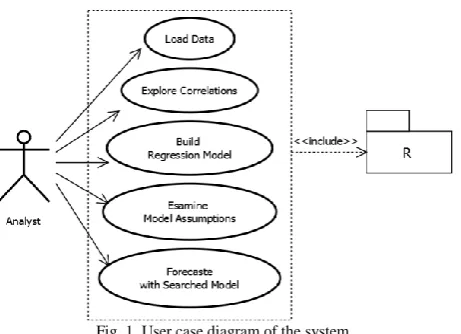
In general a user can use the functions, shown in Fig. 1, provided by the system to complete an analysis task. No programming efforts are required of users of the system.
Fig. 1. User case diagram of the system.
Load data. For now the data set for analysis must be in the
form of a csv file. This requirement is enforced for the convenience of uploading the data set to the cloud for model building. The load data function will do a quick check on the
data type of the variables. None quantitative variables will be highlighted as a visual aid to filtering variables for model building.
Explore correlations. Selecting variables to be included in
the regression model is a major issue in multiple regression analysis. A careful inspection on the correlations between pairs of variables can reveal clues about which variables are candidates.
Build regression model. Users of the system can designate
variables for model building and the forms of effect in the regression equation. In regression analysis, only one quantitative variable can be designated as dependent. Forms of effect can be main, interaction or both.
Examine tests of assumptions. This function provides
statistical tests on the assumptions ascribed to regression models. Preliminary interpretations on the test results are given to avoid inappropriate readings of the test report.
Forecast with searched model. Once the regression model
is built, users of the system can exploit the model and predict values of the dependent variable with a set of predictor values.
B. The System Architecture
The system contains a client side component and a server side component. The client side component is the GUI mediating on-the-fly regression analysis functions for users. The server side component is in charge of all the computations and plotting for multiple regression analysis. Most of the functions of the system are realized by a Java applet and various functional Java servlets. Fig. 2 is the architectural outline of the system.
Fig. 2. System architecture.
In general, the Getter servlets accept requests from remote clients for services and the Receiver servlets mediate the transmission of computed results to the clients. Getter servlets can invoke computation servlets as appropriate to complete analytic computations.
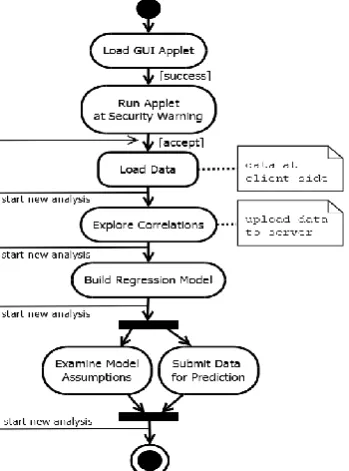
C. Flow of High Level Activities
Fig. 3. System activity flow.
IV. IMPLEMENTATION AND EVALUATION
The system, as shown in Fig. 2, is implemented with Java technology in NetBeans IDE. It is built to test our initiative on delivering statistical analysis over the internet as a service. All the building components of the system are in the public domain.
A. The System Requirements
The system is developed on Windows platform with the following server side settings.
HTTP Server: Tomcat 7.0 JVM: SE v1.7
R statistical software: v.3.0.2 (rJava/jri incl.)
GUI applet signed with a certificate generated by the Java keytool certificate management utility.
Any popular browser with network accessibility shall be able to run the system. Except for accepting the security warnings for the GUI applet, no particular setting is required at the client side.
B. Sample Snap Shots for Evaluation
Fig. 4 to Fig. 9 are the screen shots of the system. Fig. 4 is the data set for the illustration of model building.
Fig. 4. Sample data for analysis.
As shown in Fig. 5, the system can do either simple linear regression analysis or multiple regression analysis.
Fig. 5. The GUI applet.
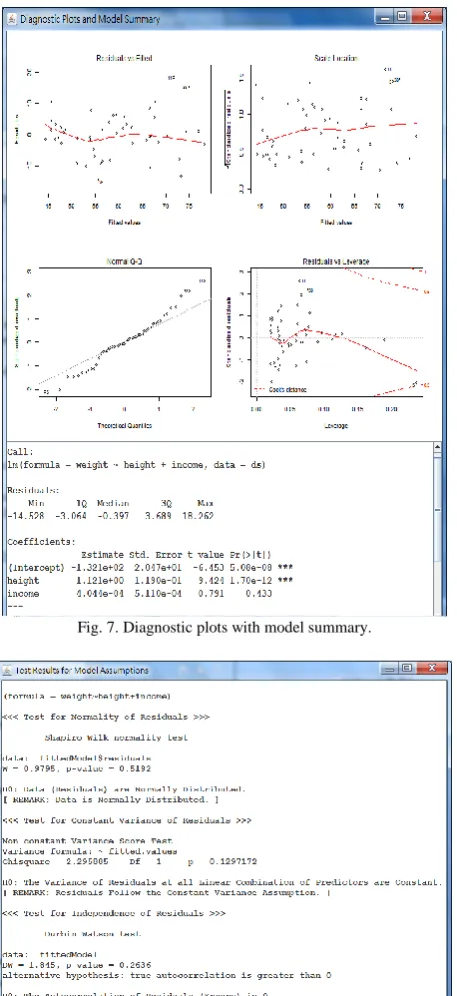
Correlations between any pair of variable can be evaluated by referring to both the scatter plot and the correlation plot shown in Fig. 6 next page. Model summaries for the example data set in Fig 4. are given below the diagnostic plots of the model in Fig. 7. Test results with preliminary interpretations for model assumptions of the regression model are given in Fig. 8. The preliminary interpretations provided by the system can avoid misinterpreting the abstruse yet important statistics. When a satisfied regression model is found, users of the system can upload a set of predictor values to the server side to predict the values of the response variable with the searched model, as shown in Fig. 9.
Fig. 7. Diagnostic plots with model summary.
Fig. 8. Test of model assumptions.
Fig. 9. Predictions for responsive variables.
C. Some Technical Details
As shown in Fig. 2, R commands for data manipulation are submitted to R through jri of the rJava package. Until now, jri can only activate one R instance safely on Windows platform. As such some concurrent control mechanism must be put in place to ensure that commands submitted to R from different client sessions are isolated from each other at the server side.
Besides making sure that only one main R instance is activated at the server side, there is a simple and straightforward workaround to address the aforementioned limitation of jri on Windows platform. It works in this way that each client session must request a globally unique random seed number from a getter servlet at the server side. The seed number works both as a pass code and a resource identification number of the client session. Resources (i.e. R objects) allocated to a particular client session will be attached with the seed number assigned to the session. With this simple mechanism, effects of R commands coming from different client sessions can be isolated. In the end, one R instance at the server side can be shared concurrently among multiple client sites without compromising its integrity.
Nonetheless, at the end of each client session, resources at the server side allocated to the session are cleaned to prevent adverse lagging of server efficiency.
D. Evaluation of the System
To verify the integrity of the system, the same data set used for the above illustration was submitted to SPSS for analysis.
TABLEI:MODEL SUMMARIES FROM THE SYSTEM AND SPSS
Statistics SYSTEM SPSS
Model Summary R Square 0.6493 0.649
Adjusted R Square 0.6347 0.635 Durbin-Watson 1.845 (p-value=0.2636) 1.845
ANOVA F/Sig. 44.44/1.194e-11 44.443/.000
Coefficients constant/
t/Sig.
-132.1/
-6.453/5.08e-08
-132.085/ -6.453/.000 height/
t/Sig.
1.121/
9.424/1.70e-12
1.121/ 9.424/.000 income/
t/Sig.
4.044e-04/ 0.791/0.433
.000/ .791/.433
As shown in Table I, the model built by the system bears no significant difference from the model built by other commercial statistical software such as SPSS. This verifies the integrity of the analytics computed by the system implemented.
V. FINAL REMARKS
on the market, they may be too powerful or too expensive to be cost effective for many businesses.
To address this dilemma, this research pulls together components in the public domain and builds a web application that can help users generate forecast analytics with regression analysis technique, which has applications in business, engineer, social sciences and many others.
This implementation imposes steps for regression analysis on users of the system which can guarantee to a certain degree the correct application of the technique. Results of this research prove that our idea of delivering statistical analysis with open-source ware as a service over the internet is highly feasible and promising.
Since uploading huge volume of data to the server side is too expensive in terms of network traffic load, current implementation of the system is not yet tested on analyzing any big data set.
In the near future, this research can be extended in the following directions.
1) Extend the coverage of analysis support to other procedures. Extensions in this line can help promote the idea of statistical analysis as a service.
2) In light of the wide availability of mobile devices, there is a need to explore the possibility of porting the analysis service to mobile platforms.
3) Explore the possibility of realizing an R mining agent on a distributed platform [11], [12]. A mining agent that can be deployed on a distributed platform would help greatly realize the autonomous mining of decision analytics from big data sets at various sources.
Systems implemented with open-source ware could shed lights on products of commercial vendors and eventually do greater good to the public.
REFERENCES
[1] C. H. Wu, J. B. Li, and T. Y. Chang, “SlinRA2S: a simple linear regression analysis assisting system,” in Proc.ICEBE, 2013, pp. 219-223.
[2] D. R. Anderson, D. J. Sweeney, and T. A. Williams, Statistics for Business and Economics, 11thed., OH: South-Western Cengage Learning, 2011.
[3] M. Kutner, C. Nachtsheim, and J. Neter, Applied Linear Regression Models, 4th ed., Europe: McGraw-Hill, 2004.
[4] J. Neter, W. Wasserman, and G. A. Whitmore, Applied Statistics, Boston: Allyn and Bacon, 1993.
[5] H. Levene, “Robust tests for equality of variances,” in Contributions to Probability and Statistics: Essays in Honor of Harold Hotelling, I. Olkin et al., Eds., CA: Stanford University Press, 1960, pp. 278–292. [6] J. Durbin and G. S. Watson, “Testing for serial correlation in least
squares regression. III,” Biometrika, vol. 58, no. 1, pp. 1–19, Apr. 1971.
[7] H. Lilliefors, “On the Kolmogorov–Smirnov test for normality with mean and variance unknown,” Journal of the American Statistical Association, vol. 62, no. 318, Jun. 1967, pp. 399–402.
[8] S. S. Shapiro and M. B. Wilk, “An analysis of variance test for normality (complete samples),” Biometrika, vol. 52, no. 3-4, pp. 591–611, Dec. 1965.
[9] D. C. Montgomery, E. A. Peck, and G. G. Vining, Introduction to Linear Regression Analysis, 5th ed. NY: Wiley, 2012.
[10] W. N. Venables, D. M. Smith, and the R Core Team, An Introduction to R, The R Project, 2013.
[11] C. H. Wu, Y. Shao, J. F. Liu, and T. Y. Chang, “On supporting cross-platform statistical data analysis using JADE,” Studies in Computational Intelligence, vol. 214, pp.271-277, June 2009. [12] C. H. Wu, J. B. Li, and T. Y. Chang, “Implementing statistical agents
on JADE platform,” Applied Mathematics & Information Sciences, vol. 6. no. 2S, pp. 379S–385S, 2012.
Chien Ho Wu was born in Taipei, he had obtained
his PhD degree in informatics from the University of Manchester, U.K. Dr. Wu works as an associate professor at the Department of Statistics and Information Science in Fu Jen Catholic University, Taiwan. He was a commissioned officer when serviced in the ROC army.
His research interests are in the areas of distributed intelligent systems, semantic engineering, object-oriented technology and applied statistical data analysis. His publications mainly related to books on Java programming, and papers of intelligent systems and statistical data analysis. He is a permanent member of both CSIM and EBMS.