Human genetics and genomics a decade
after the release of the draft sequence
of the human genome
Nasheen Naidoo,1Yudi Pawitan,2Richie Soong,3David N. Cooper4and Chee-Seng Ku1,3*
1Centre for Molecular Epidemiology, Department of Epidemiology and Public Health, Yong Loo Lin School of Medicine,
National University of Singapore, Singapore
2Department of Medical Epidemiology and Biostatistics, Karolinska Institutet, Stockholm, Sweden 3Cancer Science Institute of Singapore, National University of Singapore, Singapore
4Institute of Medical Genetics, School of Medicine, Cardiff University, Cardiff, UK
*Correspondence to:Tel:þ65 (0)81388095; E-mail: [email protected]
Date received (in revised form): 15th May 2011
Abstract
Substantial progress has been made in human genetics and genomics research over the past ten years since the publication of the draft sequence of the human genome in 2001. Findings emanating directly from the Human Genome Project, together with those from follow-on studies, have had an enormous impact on our understand-ing of the architecture and function of the human genome. Major developments have been made in cataloguunderstand-ing genetic variation, the International HapMap Project, and with respect to advances in genotyping technologies. These developments are vital for the emergence of genome-wide association studies in the investigation of complex diseases and traits. In parallel, the advent of high-throughput sequencing technologies has ushered in the ‘personal genome sequencing’ era for both normal and cancer genomes, and made possible large-scale genome sequencing studies such as the 1000 Genomes Project and the International Cancer Genome Consortium. The high-throughput sequencing and sequence-capture technologies are also providing new opportunities to study Mendelian disorders through exome sequencing and whole-genome sequencing. This paper reviews these major developments in human genetics and genomics over the past decade.
Keywords:Human Genome Project, International HapMap Project, 1000 Genomes Project, genome-wide association studies, single nucleotide polymorphisms, copy number variations, next-generation sequencing technologies, cancer genome sequencing, exome sequencing, complex disease, Mendelian disorders, personalised genomic medicine
Introduction
Substantial progress has been made in human gen-etics and genomics research over the past 10 years since the publication of the draft sequence of the human genome.1,2 The Human Genome Project (HGP) provided the basic raw DNA sequence that spawned a plethora of secondary studies which together greatly improved our knowledge of the architecture and function of the genome, yielding new insights with respect to (i) gene number and
density, (ii) non-protein-coding RNA genes (or RNA genes), (iii) pervasive transcription, (iv) high copy number repeat sequences and (v) evolutionary conservation. These developments also have chal-lenged the classical definition of the gene (see below).
first proper GWAS study was published in 2005. This succeeded in identifying a common risk variant with a large effect size in the complement factor H (CFH) gene, which was associated with age-related macular degeneration.3 By 2007, approximately 100 new GWASs had been pub-lished, relating to various complex diseases and traits.4 There has, however, been some criticism of the inability of GWASs to identify many of the pre-sumed disease-associated variants. Indeed, the val-idity of the common-disease common-variant (CD/CV) model has recently been challenged by virtue of the perceived ‘missing heritability’.5 – 7 This notwithstanding, the GWAS approach has dra-matically changed the field of human disease gen-etics, from identifying mostly irreproducible disease associations in the pre-GWAS era to revealing thou-sands of statistically robust single nucleotide poly-morphism (SNP) associations today.8 – 11 The focus has also gradually shifted back to Mendelian dis-orders, with the advent of high-throughput sequence capture and sequencing technologies which have potentiated exome and whole-genome (re)sequencing (WGS).12 – 16
The rapid advances made in genotyping technol-ogies over the past decade, from the arrival of the first ‘whole-genome’ SNP genotyping array (the Affymetrix GeneChip 10K [Affymetrix; Santa Clara, CA] in 2003) to current capacity able to genotype five million SNPs per array (Illumina
Omni5.0 Beadchip [Illumina; San Diego,
CA]),17,18 have contributed substantially to GWASs (http://www.genome.gov/gwastudies). A total of 874 publications and 4,327 SNP associations with
p-values ,1.01025 for approximately 500 complex diseases and traits had been included in the catalogue as of 13th May 2011.
The genotyping arrays have also contributed significantly to population genetics studies.19 – 21 These arrays have been used to identify and characterise copy number variations (CNVs)22,23 and regions of homozygosity (ROHs).24,25 Research on CNVs and ROHs has also pro-gressed rapidly since CNVs were first reported to be widespread in the human genome,26,27 and ROHs have been found to be common in
outbred populations.28 In recognition of the pro-gress achieved in the context of both GWASs and CNVs, ‘human genetic variation’ was con-sidered the ‘Breakthrough of The Year’ in 2007 by Science.4
Advances have also been made in sequencing technologies, with the advent of the first next-generation sequencer in 2004 (Roche GS 20 System [Roche 454; Branford, CT]) and later, third-generation sequencing (TGS) technologies
such as true single molecule sequencing
(Helicos Biosciences, Cambridge, MA) and
single molecule real-time sequencing (SMRT) (Pacific Biosciences Menlo Park, CA).29 – 33 Developments of other more promising TGS or single-molecule sequencing technologies are on the horizon, such as nanopore sequencing and
sequencing using transmission electron
microscopy.32,34 – 37 These developments have also marked the end of the era of the Sanger dideox-ynucleotide or chain termination sequencing method, which has dominated the field since its introduction in 1977.38
The arrival of next-generation sequencing (NGS) technologies has also significantly changed the approaches applied in structural and functional geno-mics studies. Several microarray-based methods have been swiftly supplanted by sequencing-based
approaches such as ChIP-Seq, RNA-Seq,
Such progress would not have been possible without the reference genome generated by the
HGP. Also made possible by the
high-throughput genotyping and sequencing technol-ogies, several large-scale international projects have been launched, such as the International HapMap Project; the Encyclopedia of DNA
Elements (ENCODE) Project, the 1000
Genomes Project, the International Cancer Genome Consortium, the National Institute of Health (NIH) Roadmap Epigenomics Program and the Human Microbiome Project. These pro-jects have contributed substantially to our under-standing and knowledge of human genetics and genomics.
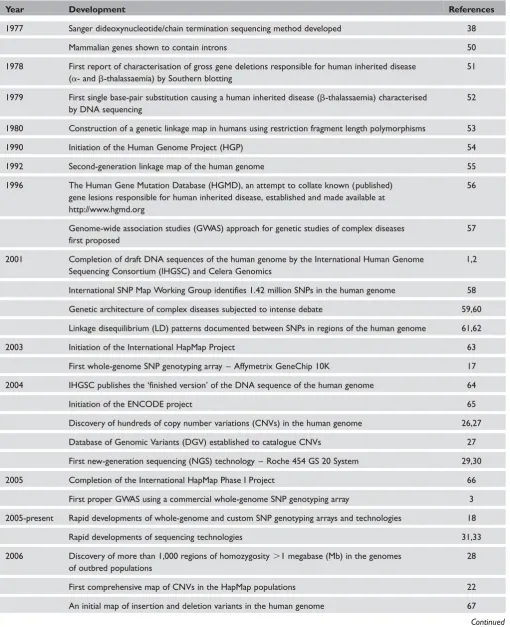
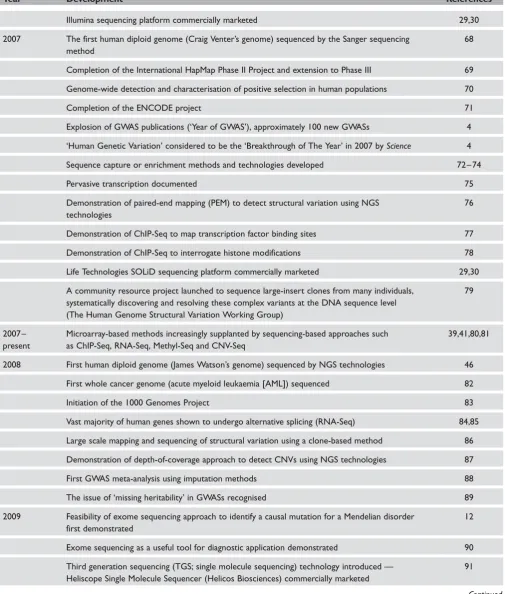
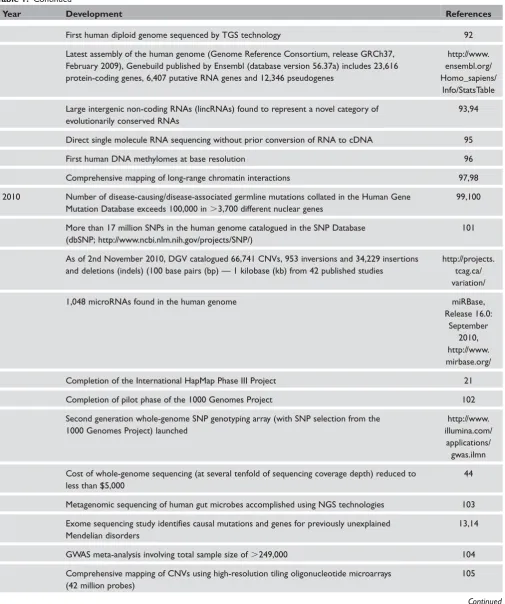
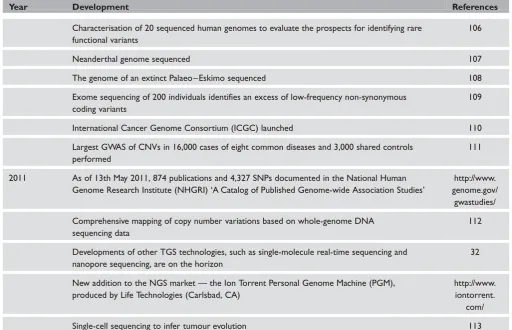
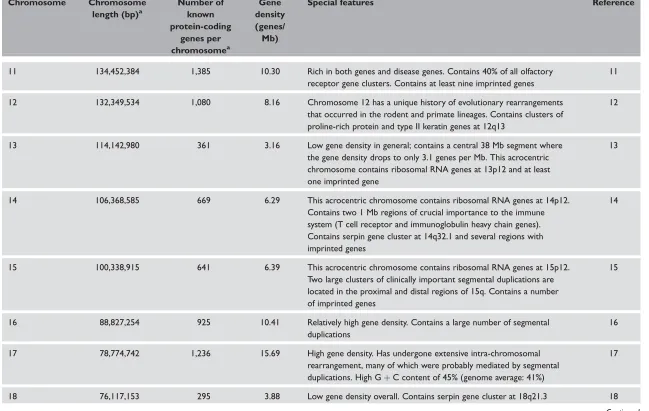
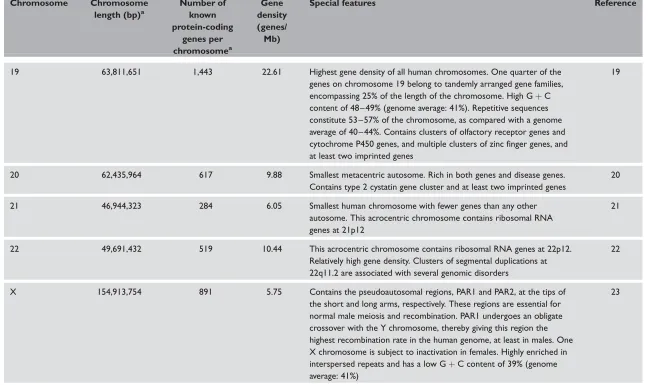
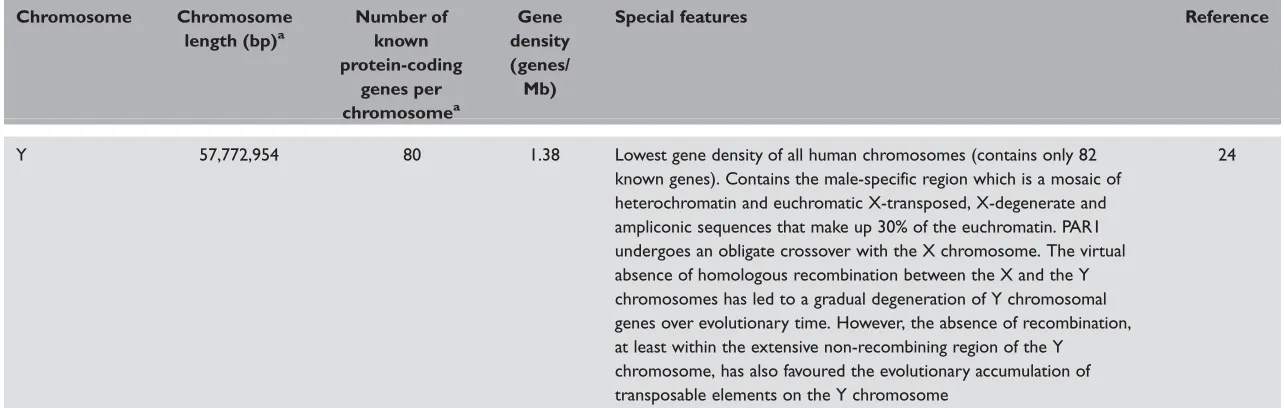
This paper aims to review these major develop-ments in human genetics and genomics over the past decade. Major developments and landmarks in human genetics and genomics are summarised in Table 1.
The HGP
Rapid progress has been made since the com-pletion of the HGP, with the provision of a ‘fin-ished’ reference DNA sequence for the human genome.64 The project was initiated in 1990 and, upon its completion in 2003 it yielded important new insights into the architecture and function of the human genome. The sequencing of the HGP relied almost entirely upon the Sanger sequencing method.
The draft sequences of the HGP were imperfect because of the incomplete coverage of the euchro-matic regions (euchromatin) — approximately 10 per cent of these regions were missing. In reality, the coverage was even less complete when the whole genome was considered (ie when the het-erochromatic regions were included). Thus, in all, some 30 per cent of the genome was not initially covered. Furthermore, there was an extensive number of gaps between contigs, which rendered the genome sequence discontinuous.1,2 The
IHGSC subsequently published an improved
version of the human genome sequence in 2004 and the HGP was then deemed to be ‘complete’.
This ‘finished’ version of the genome had achieved an almost complete coverage of all the euchromatic regions (ie approximately 99 per cent) and also sig-nificantly reduced the number of gaps between contigs to 341 from the initial hundreds of thousands.64
Significant further progress toward the total completion of the human genome sequence con-tinued until 2006; the complete euchromatic sequences of all individual human chromosomes, including the annotation of genes and other fea-tures, have now been published (summarised in Table S1). Since November 2005, the National Center for Biotechnology Information (NCBI) Build 36 assembly of the human genome sequence has been available in public databases. The data comprise a reference assembly of the complete genome sequence plus the Celera WGS (Celera; Alameda, CA) and a number of alternative assem-blies of individual haplotypic chromosomes or regions. The full list of assemblies in NCBI 36, as well as the genome sequences, is available through the following genome browsers:
† Ensembl (http://www.ensembl.org/)114 † UCSC (http://genome.ucsc.edu/)115
† NCBI (http://www.ncbi.nlm.nih.gov/mapview/ map_search.cgi?taxid=9606).116
Table 1. Major developments and landmarks in human genetics and genomics, 1977 to date
Year Development References
1977 Sanger dideoxynucleotide/chain termination sequencing method developed 38
Mammalian genes shown to contain introns 50
1978 First report of characterisation of gross gene deletions responsible for human inherited disease (a- andb-thalassaemia) by Southern blotting
51
1979 First single base-pair substitution causing a human inherited disease (b-thalassaemia) characterised by DNA sequencing
52
1980 Construction of a genetic linkage map in humans using restriction fragment length polymorphisms 53
1990 Initiation of the Human Genome Project (HGP) 54
1992 Second-generation linkage map of the human genome 55
1996 The Human Gene Mutation Database (HGMD), an attempt to collate known (published) gene lesions responsible for human inherited disease, established and made available at http://www.hgmd.org
56
Genome-wide association studies (GWAS) approach for genetic studies of complex diseases first proposed
57
2001 Completion of draft DNA sequences of the human genome by the International Human Genome Sequencing Consortium (IHGSC) and Celera Genomics
1,2
International SNP Map Working Group identifies 1.42 million SNPs in the human genome 58
Genetic architecture of complex diseases subjected to intense debate 59,60
Linkage disequilibrium (LD) patterns documented between SNPs in regions of the human genome 61,62
2003 Initiation of the International HapMap Project 63
First whole-genome SNP genotyping array – Affymetrix GeneChip 10K 17
2004 IHGSC publishes the ‘finished version’ of the DNA sequence of the human genome 64
Initiation of the ENCODE project 65
Discovery of hundreds of copy number variations (CNVs) in the human genome 26,27
Database of Genomic Variants (DGV) established to catalogue CNVs 27
First new-generation sequencing (NGS) technology – Roche 454 GS 20 System 29,30
2005 Completion of the International HapMap Phase I Project 66
First proper GWAS using a commercial whole-genome SNP genotyping array 3
2005-present Rapid developments of whole-genome and custom SNP genotyping arrays and technologies 18
Rapid developments of sequencing technologies 31,33
2006 Discovery of more than 1,000 regions of homozygosity.1 megabase (Mb) in the genomes of outbred populations
28
First comprehensive map of CNVs in the HapMap populations 22
An initial map of insertion and deletion variants in the human genome 67
Table 1. Continued
Year Development References
Illumina sequencing platform commercially marketed 29,30
2007 The first human diploid genome (Craig Venter’s genome) sequenced by the Sanger sequencing method
68
Completion of the International HapMap Phase II Project and extension to Phase III 69
Genome-wide detection and characterisation of positive selection in human populations 70
Completion of the ENCODE project 71
Explosion of GWAS publications (‘Year of GWAS’), approximately 100 new GWASs 4
‘Human Genetic Variation’ considered to be the ‘Breakthrough of The Year’ in 2007 byScience 4
Sequence capture or enrichment methods and technologies developed 72 – 74
Pervasive transcription documented 75
Demonstration of paired-end mapping (PEM) to detect structural variation using NGS technologies
76
Demonstration of ChIP-Seq to map transcription factor binding sites 77
Demonstration of ChIP-Seq to interrogate histone modifications 78
Life Technologies SOLiD sequencing platform commercially marketed 29,30
A community resource project launched to sequence large-insert clones from many individuals, systematically discovering and resolving these complex variants at the DNA sequence level (The Human Genome Structural Variation Working Group)
79
2007 – present
Microarray-based methods increasingly supplanted by sequencing-based approaches such as ChIP-Seq, RNA-Seq, Methyl-Seq and CNV-Seq
39,41,80,81
2008 First human diploid genome (James Watson’s genome) sequenced by NGS technologies 46
First whole cancer genome (acute myeloid leukaemia [AML]) sequenced 82
Initiation of the 1000 Genomes Project 83
Vast majority of human genes shown to undergo alternative splicing (RNA-Seq) 84,85
Large scale mapping and sequencing of structural variation using a clone-based method 86
Demonstration of depth-of-coverage approach to detect CNVs using NGS technologies 87
First GWAS meta-analysis using imputation methods 88
The issue of ‘missing heritability’ in GWASs recognised 89
2009 Feasibility of exome sequencing approach to identify a causal mutation for a Mendelian disorder first demonstrated
12
Exome sequencing as a useful tool for diagnostic application demonstrated 90
Third generation sequencing (TGS; single molecule sequencing) technology introduced — Heliscope Single Molecule Sequencer (Helicos Biosciences) commercially marketed
91
Table 1. Continued
Year Development References
First human diploid genome sequenced by TGS technology 92
Latest assembly of the human genome (Genome Reference Consortium, release GRCh37, February 2009), Genebuild published by Ensembl (database version 56.37a) includes 23,616 protein-coding genes, 6,407 putative RNA genes and 12,346 pseudogenes
http://www. ensembl.org/ Homo_sapiens/
Info/StatsTable
Large intergenic non-coding RNAs (lincRNAs) found to represent a novel category of evolutionarily conserved RNAs
93,94
Direct single molecule RNA sequencing without prior conversion of RNA to cDNA 95
First human DNA methylomes at base resolution 96
Comprehensive mapping of long-range chromatin interactions 97,98
2010 Number of disease-causing/disease-associated germline mutations collated in the Human Gene Mutation Database exceeds 100,000 in.3,700 different nuclear genes
99,100
More than 17 million SNPs in the human genome catalogued in the SNP Database (dbSNP; http://www.ncbi.nlm.nih.gov/projects/SNP/)
101
As of 2nd November 2010, DGV catalogued 66,741 CNVs, 953 inversions and 34,229 insertions and deletions (indels) (100 base pairs (bp) — 1 kilobase (kb) from 42 published studies
http://projects. tcag.ca/ variation/
1,048 microRNAs found in the human genome miRBase,
Release 16.0: September
2010, http://www. mirbase.org/
Completion of the International HapMap Phase III Project 21
Completion of pilot phase of the 1000 Genomes Project 102
Second generation whole-genome SNP genotyping array (with SNP selection from the 1000 Genomes Project) launched
http://www. illumina.com/
applications/ gwas.ilmn
Cost of whole-genome sequencing (at several tenfold of sequencing coverage depth) reduced to less than $5,000
44
Metagenomic sequencing of human gut microbes accomplished using NGS technologies 103
Exome sequencing study identifies causal mutations and genes for previously unexplained Mendelian disorders
13,14
GWAS meta-analysis involving total sample size of.249,000 104
Comprehensive mapping of CNVs using high-resolution tiling oligonucleotide microarrays (42 million probes)
105
Architecture and function of the
human genome
To coincide with the tenth anniversary of the release of the draft human genome sequences, the key findings from the HGP and their importance for the results of subsequent studies will now be recalled briefly. The findings emanating from the HGP and follow-on studies have had an enormous impact on the understanding of the architecture and function of the human genome.
Gene number and density
Initial annotation data indicated that the human genome encodes at least 20,000 – 25,000 protein-coding genes, with an indeterminate number of additional ‘computationally derived genes’ sup-ported by somewhat weaker in silico evidence.2,64 Many genes are now known to encode RNAs rather than proteins as their final products117 but
many still remain unannotated.75 In the latest
assembly of the human genome (Genome
Reference Consortium, release GRCh37, February 2009), the Genebuild published by Ensembl (data-base version 56.37a) includes 23,616 protein-coding genes, 6,407 putative RNA genes and 12,346 pseudogenes (http://www.ensembl.org/
Homo_sapiens/Info/StatsTable). The HUGO
Human Gene Nomenclature Committee (http://
www.genenames.org/index.html) has so far
approved more than 28,000 human gene symbols, although some of these may yet turn out to corre-spond to functionally meaningless open reading frames.118 It is nevertheless encouraging that at least 17,052 human genes have been shown to have orthologous counterparts in the mouse genome, suggesting that they do indeed correspond to real proteins.119 The definition of what constitutes a gene is still fairly fluid, and hence, depending upon the precise definition adopted, it may be that many
Table 1. Continued
Year Development References
Characterisation of 20 sequenced human genomes to evaluate the prospects for identifying rare functional variants
106
Neanderthal genome sequenced 107
The genome of an extinct Palaeo – Eskimo sequenced 108
Exome sequencing of 200 individuals identifies an excess of low-frequency non-synonymous coding variants
109
International Cancer Genome Consortium (ICGC) launched 110
Largest GWAS of CNVs in 16,000 cases of eight common diseases and 3,000 shared controls performed
111
2011 As of 13th May 2011, 874 publications and 4,327 SNPs documented in the National Human Genome Research Institute (NHGRI) ‘A Catalog of Published Genome-wide Association Studies’
http://www. genome.gov/ gwastudies/
Comprehensive mapping of copy number variations based on whole-genome DNA sequencing data
112
Developments of other TGS technologies, such as single-molecule real-time sequencing and nanopore sequencing, are on the horizon
32
New addition to the NGS market — the Ion Torrent Personal Genome Machine (PGM), produced by Life Technologies (Carlsbad, CA)
http://www. iontorrent.
com/
additional human ‘genes’ still remain to be described and annotated.
To appreciate why definition is an issue here, one need only be aware of the many exceptions to genes being contiguous (as well as functionally and spatially distinct) entities, as classically envisaged. Thus, some genes are known to occur within the introns of other genes.120 – 122 Some genes can overlap with each other either on the same or on different DNA strands,123 resulting in the sharing of some of their coding and/or regulatory elements.124,125In addition, the vast majority of human genes are now known to undergo alternative splicing,84 leading in some cases to quite different proteins being encoded by the same gene. For example, the human cyclin-dependent kinase inhibitor 2A gene (CDKN2A) (MIM# 600160) encodes an alternatively spliced variant (p14ARF) which, through the inclusion of an alterna-tive first exon, acquires an altered reading frame so as to specify a protein product that is structurally unre-lated to the other p16 isoforms encoded by this gene.
Gene density varies between the human
chromosomes and the gene distribution within
chromosomes is also rather uneven. Strikingly gene-poor regions have been identified and are known as ‘gene deserts’.126 These are regions that are devoid of protein-coding genes over distances of several Mb but which may nevertheless contain regulatory sequences (Box 1).
RNA genes or non-protein-coding RNAs
A large proportion of the human transcriptome still remains to be annotated.136 Although some of the overall transcriptional activity may simply be ‘tran-scriptional noise’,137,138 at least a portion of it is likely to be associated with functional non-coding RNA genes, many of which are located in regions previously regarded as intergenic and/or non-coding.71Non-coding RNA genes are as widespread as they are diverse,139 are transcribed from both strands of the genome and may well exceed protein-coding genes in terms of their number.140,141
Non-coding RNAs of known function include structural RNAs such as transfer RNAs, ribosomal RNAs and small nuclear RNAs, but also putative
Box 1.
Gene deserts and their potential relevance to human inherited
disease
A functional role(s) for gene deserts127 has been supported by results from GWASs. Thus, multiple SNPs on chromosome 5p13.1 have been shown to be strongly associated with Crohn’s disease, even though the region is located within a 1.2 Mb gene desert and the nearest annotated gene, that encod-ing prostaglandin E receptor EP4 (PTGER4), is about 270 kb away from the association signals.128 – 131 Although the SNPs were consistently associated with the disease, their functional effect is not easy to infer because these SNPs could exert an effect either on the nearest gene or on other genes that are located further away. However, Libioulle et al. (2007)128 integrated the GWAS results with gene expression data and found that the associated SNPs influenced the level of expression of PTGER4.
The majority of GWAS-SNPs are located in either intronic, intergenic or gene desert regions rather than within gene-coding or promoter sequences. These SNPs could nevertheless be of direct functional significance if their locations coincide with regulatory elements, either already known or yet to be characterised, such as enhancers, transcription factor binding sites and sequences encoding for microRNAs.132
regulatory RNAs (microRNAs, small interfering RNAs [siRNAs], piwi-interacting RNAs, tran-scription initiation RNAs [tiRNAs], trantran-scription start site-associated RNAs [TSSa-RNAs], promoter upstream transcripts [PROMPTs], promoter-associated sRNAs [PASRs and PALRs] and longer non-coding RNAs such as XIST), which are involved in sequence-specific transcriptional and post-transcriptional modulation of gene expression.142 – 148 Thus, more than 1,000 microRNA genes already have been identified in the human genome, with many more probably awaiting discovery (Box 2). In total, at least 1,500 non-coding RNA genes already have been anno-tated in the human genome reference sequence, with up to 5,000 more predicted by homology-based methods117 (see Ensembl, database version 56.37a).
Indeed, large intergenic non-coding RNAs (lincRNAs) recently have been found to represent a novel category of evolutionarily conserved
RNAs, with a diverse array of functions ranging from stem cell pluripotency to cellular prolifer-ation;93,94 lincRNAs appear to number at least 3,000 in the human genome.155 – 158 Some lincRNAs guide chromatin-modifying complexes to specific genomic loci, to regulate gene expression.94 LincRNAs also play an important role in the derivation of human-induced pluripotent stem cells.156 Collectively, non-coding RNAs have been intensively studied over the past several years.159,160
Pervasive transcription: Transcripts of unknown function and unannotated transcripts
The ENCODE project, designed to analyse 30 Mb of DNA from 44 genomic regions to characterise the functional elements present, has identified complex patterns of regulation and ‘pervasive tran-scription’ of the human genome.71 Although .90
Box 2.
MicroRNAs
MicroRNA has been the most intensively studied non-coding RNA in the human genome. MicroRNA gene loci may be fairly numerous: already more than 15,000 microRNA gene loci have been identified in various species (miRBase, Release 16.0: September 2010; http://www.mirbase.org/), with 1,048 microRNAs being found in the human genome.
Biogenesis and function
The synthesis of microRNAs starts with the transcription of primary microRNAs by RNA polymerase II. The primary microRNAs will be processed further to become precursor microRNAs and then mature microRNAs. The mature microRNAs are short sequences of 18 – 25 nucleotides; they are incorporated into RNA-induced silencing complex (RISC) to exert their post-transcriptional regulat-ory roles through binding to the 30 untranslated region (UTR) of target mRNAs. The binding of microRNA to target mRNAs can lead to two possible outcomes; either degradation or cleavage of the mRNAs or suppression of the translation of mRNAs into protein.149
Relevance to diseases
per cent of the human genome appears to be rep-resented in nuclear primary transcripts, it has become clear that only 35 – 50 per cent of pro-cessed transcripts have so far been annotated as genes, implying that many genes may not yet have been recognised as such.71,85,161,162 Thus, large numbers of hitherto unannotated transcripts may well yet turn out to be of functional significance.161 Such transcripts have been collectively classified as transcripts of unknown function (TUFs) and are thought to include (i) antisense transcripts of coding genes, (ii) isoforms of protein-coding genes and (iii) transcripts that either overlap introns of annotated gene transcripts (on the same strand) or which are derived entirely from inter-genic regions. Although both the complexity and abundance of TUFs are remarkable, it should be realised that there is often no firm evidence for these transcripts being of functional significance. Indeed, unannotated non-polyadenylated transcripts originating from intergenic regions have been found to represent the bulk of the .90 per cent of the human genome that now appears to be tran-scribed.161,163,164 Although the functional signifi-cance of pervasive transcription remains unclear, it is much more extensive than had previously been realised.165
In both humans and mice, up to 70 per cent of genomic loci exhibit evidence of transcription from the antisense strand, as well as the sense strand.166 –
168
These naturally occurring antisense transcripts may modulate the level of expression of their associated sense transcripts (or otherwise influence their processing), thereby adding another level of
complexity to the regulation of gene
expression.169,170 Although there is, as yet, no sug-gestion that the genomic sources of such antisense transcripts should be regarded as genes in their own right, their prevalence clearly renders our task of defining the gene that much more difficult.
High copy number repeat sequences
The HGP revealed that repeat sequences account for at least 50 per cent of the human genome sequence. These repeats may be classified as (i)
transposon-derived repeats, (ii) partially retroposed copies of genes (referred to as processed pseudo-genes), (iii) simple sequence repeats, (iv) blocks of tandemly repeated sequences at centromeres, telo-meres and the short arms of acrocentric chromo-somes and (v) segmental duplications (SDs) or low copy number repeats.
Segmental duplications
Both the number and the breadth of the distri-bution of SDs in the human genome (5 per cent) were surprising. SDs represent extensive inter- and intra-chromosomal duplications of genomic regions
that contain genes as well as intergenic
sequences.1,2 She et al. extended the initial analyses of these low copy number repeats or SDs and initiated the characterisation of the duplicational landscape of the human genome.171 SDs may be viewed as mutational hotspots, since they are prone to aberrant recombination events occurring between highly homologous paralogous SDs, and give rise to large deletions or duplications of the intervening sequences resulting in human genomic disorders.172 Indeed, SDs have been shown to rep-resent frequent sites of CNV between individuals, thereby contributing considerably to human genomic diversity.173 The mechanism that generates CNVs in SDs is known as non-allelic homologous recombination.174 These interspersed SDs confer susceptibility to recurrent microdeletions and microduplications upon approximately 10 per cent of the human genome through unequal crossing over. Furthermore, data have accumulated showing that specific recurrent rearrangements within these genomic hotspots are associated with both syndro-mic and non-syndromic diseases. Studies of common complex diseases have shown that these recurrent events play an important role in autism, schizophrenia and epilepsy.175 – 177
segments and genes. On average, 73 – 87 genes vary in copy number between any two individuals and these differences overwhelmingly correspond to segmental duplications.178
Pseudogenes
Whether processed or non-processed (duplica-tional), it has become clear that pseudogenes are almost as abundant as genes (‘classical’ or otherwise) in the human genome, with 20 per cent of known pseudogenes being transcribed.179 – 181 By means of a comparison of cytochrome P450 genes (CYP) from the mouse and human genomes, Nelsonet al. (2004) demonstrated that the complete identification of all human pseudogene sequences is likely to be clinically important and proposed a naming procedure forCYP pseudogenes.182
It should, however, be appreciated that, although some pseudogenes may well be readily identifiable as lacking protein-coding potential by virtue of the interruption of their open-reading frames by prema-ture stop codons or frameshift mutations, others will be less easily recognisable, especially if they are tran-scribed. The recent identification of short (300 bp) human pseudogenes generated via the retrotransposi-tion of mRNAs,183 however, suggests that pseudo-genes may be even more common in the human genome than previously appreciated. Intriguingly, some of these pseudogenes are polymorphic, in that they have functional as well as non-functional alleles segregating in the extant human population.184
With the realisation that pseudogene-derived
RNA transcripts may harbour functional
elements,181,185 the distinction between genes and pseudogenes has become somewhat blurred.186 Indeed, some ‘pseudogenes’ appear to have a regulat-ory role,187,188 providing additional examples of the potential functional significance of non-coding RNAs. At present it is unclear what proportion of the pseudogenes identified to date have either retained or acquired a function via their non-coding RNAs.
Transposable elements
Transposable elements, including Long INterspersed
Elements (LINE-1), Alu and SINE–VNTR–Alu
(SVA) elements (SVA is an unusual composite element
derived from three other repeats: Short INterspersed Elements [SINE]-R, variable number tandem repeats [VNTR] and Alu), make up 40 per cent of the human genome189 and constitute a major source of inter-individual structural variability.190Some of these transposable elements have contributed gene-coding sequences to the human genome via ‘exonisation’.191 Other transposable elements have contributed func-tional non-coding sequence — for example, as regu-latory elements,192,193 microRNAs194 or naturally occurring antisense transcripts.195 Many more are likely to have functional significance, as suggested by their evolutionary conservation.196,197
Evolutionary conservation
Extensive evolutionary conservation of non-coding DNA sequences is evident in the human genome because only 40 per cent of the evolutionarily constrained sequence occurs within protein-coding exons or their associated untranslated regions.71 Studies of evolutionarily conserved non-coding sequences198 – 201 have suggested that 5 – 20 per cent of the genome may be of functional importance, rather than just the 2 per cent associated with the protein-coding portion.202,203 Some non-coding regions (the genomic ‘dark matter’) contain ‘ultra-conserved elements’ which not only exhibit enhan-cer function, but are also transcribed and often appear to have been subject to selection to the same extent as protein-coding regions.204 – 206 Some non-coding regions contain CpG islands, which, although located far from the transcriptional initiation sites of genes, may nevertheless have some regulatory significance.207 It should be appreciated, however, that the absence of evol-utionary conservation does not necessarily denote lack of function. Indeed, human specific functional elements have been shown to be present within rapidly evolving non-coding sequences.208,209
Towards a new definition of the gene
It is clear from the above that precisely what consti-tutes a gene has become somewhat contentious.
transcription in the genome, coupled with the widespread occurrence of overlapping genes and shared functional elements, hampers attempts to demarcate precisely and unambiguously where one gene ends and another one begins. As a conse-quence, the notion of the gene has become diffuse.161,210 Indeed, as Kapranov et al.211 opined, ‘it is not unusual that a single base-pair can be part of an intricate network of multiple isoforms of overlapping sense and antisense transcripts, the majority of which are unannotated’. Gene regulat-ory elements that are often distant from the genes they regulate,212 the existence of trans- as well as
cis-regulatory elements213 and the formation of non-co-linear transcripts through trans-splicing,214 taken together with the abundance of non-coding RNA genes215 and evolutionarily conserved non-coding regions,199,201 have combined to challenge the classical notion of the gene.
On the basis of the findings of the ENCODE project, Gerstein et al.210 proposed an updated defi-nition of the gene as ‘a union of genomic sequences encoding a coherent set of potentially overlapping functional products’. An alternative definition of the gene as: ‘A discrete genomic region whose transcrip-tion is regulated by one or more promoters and distal regulatory elements and which contains the infor-mation for the synthesis of functional proteins or non-coding RNAs, related by the sharing of a portion of genetic information at the level of the ultimate pro-ducts (proteins or RNAs)’ has been proposed by Pesole.216 Irrespective of its precise definition, it is clear that the concept of the gene is inadequate to the task of building a lexicon of those functional genomic sequences that could harbour mutations causing human inherited disease. It is likely in the context of mutation detection, that we shall eventually have to consider the universe of functional genetic elements in the human genome as our hunting ground, rather than simply genesper se.
Development of the GWAS approach
to complex diseases and traits
In this section, developments in cataloguing genetic
variation (SNP and CNV), initiation and
completion of the International HapMap Project, and advances in genotyping technologies are dis-cussed. These developments are important prere-quisites for the use of GWASs in the investigation of complex diseases and traits.
SNP discovery after the HGP
While the HGP was being completed, genetic var-iants, in particular SNPs, were also being discov-ered. By 2001, the International SNP Map Working Group had identified 1.42 million SNPs in the human genome.58 Currently, more than 17 million SNPs in the human genome have been cat-alogued in the SNP Database (dbSNP; http://www. ncbi.nlm.nih.gov/projects/SNP/). It is, however, likely that at least some of the entries in the database are errors or artefacts rather than ‘genuine’ variants. A false-positive rate for the dbSNP of 15 – 17 per cent has been estimated.101 Therefore, large-scale validation in population-based studies is necessary. The HapMap Project was conceived in 2003 with the aim of validating several million SNPs in order to obtain SNP and genotype frequency information, as well as to study their LD patterns in different populations.
SNPs are the most abundant type of genetic variation in the human genome. They occur at intervals of approximately one SNP to every kb of DNA sequence throughout the genome when the DNA sequences of any two unrelated individuals are compared. This is approximately equivalent to three million SNPs being carried by each individual genome. Therefore, the DNA sequences of any two unrelated genomes are estimated to be about 99.9 per cent identical; the 0.1 per cent comprises mainly SNPs, and these are believed to be respon-sible for many of the phenotypic differences noted among individuals in populations — for example, disease susceptibility, drug responses and physical traits such as height.217
The discovery of thousands of CNVs that
collec-tively encompass hundreds of Mb of the
of ‘99.9 per cent similarity’ between any two genomes. Indeed, the DNA sequences of individ-uals within and between populations are genetically rather more diverse and varied than previously thought. This has been corroborated by a recent study demonstrating that the Craig Venter genome differs from the consensus reference sequence by approximately 1.2 per cent when indels and CNVs are considered, a further 0.1 per cent when SNPs are considered and 0.3 per cent when inversions are considered — a grand total of 1.6 per cent.218
Linkage disequilibrium and the International HapMap Project
Most SNPs are predicted to be neutral, without any functional effects. Owing to their abundance in the human genome, they may serve as useful genetic markers in GWASs, by comparison with other genetic variations, such as microsatellites, which in any case exhibit a mutation rate that is too high to be useful in this context. Early reports documented LD patterns between SNPs in parts of the human genome;61,62,219 however, no large-scale effort had been undertaken to study the LD pat-terns in the whole genome until the initiation of the International HapMap Project. A total of more than three million SNPs were genotyped and vali-dated in Phase I and Phase II of the project in four populations.66,69 These populations were the US
Utah population of Northern and Western
European ancestry (CEU), Han Chinese from Beijing (CHB), Japanese from Tokyo (JPT) and the Yoruba from Ibadan, Nigeria (YRI).
One novel finding has been that 10 – 30 per cent of pairs of individuals within a population share at least one region of extended genetic identity arising from recent common ancestry. An additional dis-covery was that up to 1 per cent of all common variants are not tagged by SNPs, primarily because they are located within recombination hotspots.69 Importantly, increased population differentiation with respect to non-synonymous SNPs was noted, by comparison with synonymous SNPs. These observations have also indicated systematic differ-ences in the strength or efficacy of natural selection
between populations from different geographical areas involving genes linked to the Lassa virus in West Africa, skin pigmentation in Europe and hair follicle development in Asia.70
The discovery of millions of SNPs has created a significant challenge in genotyping. It is neither technically feasible nor cost-effective to genotype all the SNPs in a GWAS, even with the latest geno-typing technologies; however, the existence of LD significantly reduces the number of SNPs that need to be genotyped. The indirect association approach of GWASs is dependent on surrogate markers (‘tag’ SNPs) to locate disease variants through LD. As shown by the HapMap Project69 and other pub-lished work,220 – 222 approximately half a million SNPs are adequate to capture most of the SNPs that have been genotyped in the HapMap Phase I and II projects. However, the genome coverage of commercial genotyping arrays is population depen-dent (Box 3).
The HapMap project has created a useful and valuable resource for GWASs. In parallel, the public availability of the HapMap resource has driven the rapid development of genotyping arrays, in which the data are used to guide the selection of tag SNPs. Once the HapMap Phase I and II projects were completed, a number of genotyping arrays
were designed and introduced onto the
market.223,224 The newer arrays (eg the Illumina Human 1M Beadchip and Affymetrix SNP Array 6.0) have significantly improved genome coverage and are also designed for CNV detection.225 The HapMap Phase I and II projects led to the develop-ment of higher resolution genotyping arrays, which in turn were used in the HapMap Phase III project to investigate genetic variations (both SNPs and CNVs) in additional populations of diverse ancestry.21
The Phase III project, building on the success of the HapMap Phase I and II projects, included an additional seven populations and has recently been completed.21 These additional populations involved people of African ancestry in the south-western
USA (ASW), the Chinese community in
Kenya (LWK), people of Mexican ancestry in Los Angeles, CA (MEX), the Maasai in Kinyawa, Kenya (MKK) and Tuscans in Italy (TSI). The ethos behind the HapMap Phase III project was that, in order to obtain a more complete under-standing of human genetic variation, populations with a wider geographical/ancestral range needed to be studied. In total, the HapMap Phase III project genotyped approximately 1.6 million SNPs (using both the Illumina Human 1M Beadchip and Affymetrix SNP Array 6.0) in 1,184 individuals from 11 populations (four original and seven additional populations). The population-specific differences among low-frequency variants were characterised in addition to SNPs and common CNVs or copy number polymorphisms (CNPs). More importantly, it also demonstrated the feasi-bility of imputing newly discovered CNPs and SNPs, which are important for future GWASs and meta-analyses.21
Whole-genome SNP genotyping technologies
The paradigm shift from candidate-gene association and family linkage studies to GWASs has been attributed to several important developments, most notably the rapid advances in high-throughput SNP genotyping technologies, which have enabled researchers to interrogate up to one million SNPs simultaneously in a microarray.18 GWASs employ an ‘agnostic’ approach in the search for unknown disease variants, and hence the ability to interrogate a large number of SNPs covering the entire human genome is a prerequisite for this study design. In
parallel with the decreasing cost of genotyping, it has recently become technically feasible to geno-type thousands of samples in GWASs. As a result, more than 800 GWASs have been published since 2005 (http://www.genome.gov/gwastudies/), of which almost all have used the commercially avail-able whole-genome SNP genotyping arrays from Illumina or Affymetrix.
A series of whole-genome genotyping arrays have been introduced since 2005, such as the Affymetrix Human Mapping 100K 500K sets, and the Illumina HumanHap300 and HumanHap550 BeadChips.223,224 These genotyping arrays provide different degrees of genome coverage in different populations; lower coverage was achieved in African populations because of the greater genetic diversity in these populations. For example, the Illumina HumanHap550 Beadchip, which contains approximately 550,000 tag SNPs selected from the HapMap Phase I and II projects, achieved genome coverage of 87 per cent and 83 per cent in CEU and CHBþJTP populations, respectively, but only 50 per cent in YRI.220 – 222 Whole-genome geno-typing arrays such as the Illumina Human 1M Beadchip and Affymetrix SNP Array 6.0 offer almost complete genome coverage (.90 per cent) for HapMap CEU and CHBþJPT populations (Box 3). The more recent genotyping arrays, such as the Illumina Human 1M BeadChip and Affymetrix SNP Array 6.0, have enabled genotyping of up to one million SNPs and increased the sensitivity to detect CNVs because of higher marker density and more uniform marker distribution.225 For example, the Affymetrix SNP Array 6.0 contains more than
Box 3.
Genome coverage
1.8 million markers, half of which are SNPs, the remainder being non-polymorphic or copy number probes to enhance the power of detection of CNVs. Copy-number probes were deliberately selected so as to cover regions lacking SNPs or regions where SNPs are difficult to assay, such as repetitive sequences within segmental dupli-cations.226 In addition, markers were also chosen to target known copy number variable regions as reported in the Database of Genomic Variants (http://projects.tcag.ca/variation/). Employing such a design, these genotyping arrays have enabled researchers to discover novel CNVs, as well as to validate previously known CNVs. These more recent arrays were designed for the application of GWASs and CNV detection.
The first wave of GWASs utilised first-generation SNP genotyping arrays and focused mainly on common SNPs with MAF .5 per cent.132 Thus, expanding the coverage to include less common or rarer SNPs (MAF 1 – 5 per cent) is essential for new discoveries to be made in future GWASs. This step is now technically feasible and practically achievable with the arrival of second-generation SNP
geno-typing arrays (Illumina HumanOmni2.5 and
Omni5.0) in 2010; these are capable of genotyping 2.5 to 5.0 million SNPs (Illumina Whole-Genome
Genotyping Product Roadmap; http://www.
illumina.com/applications/gwas.ilmn). These arrays were designed to increase the coverage of SNPs down to a MAF of 1 per cent. In contrast to the first-generation arrays, the SNP selection in these latest genotyping arrays leverages the data from the 1000 Genomes Project.102 However, the promise of second-generation genotyping arrays for new discoveries in GWASs is conditional upon the ade-quacy of the statistical power of the studies to ident-ify the associations of rarer SNPs with complex traits. This suggests that larger sample sizes will be needed in future GWASs.
The era of GWASs
More than 4,000 SNPs have been reported to be associated with various human complex diseases
and traits with varying degrees of replication and success (http://www.genome.gov/gwastudies/).
Despite some notable successes in revealing numerous novel SNPs and loci associated with complex phenotypes, the results from GWASs have been disappointing, in that all the GWAS-SNPs collectively account for only a small proportion of the heritability of complex phenotypes. This is due
mainly to the small effect sizes of most
GWAS-SNPs (odds ratio ,1.5).5,10,89 The small effect sizes of the GWAS-SNPs have also limited their applications in disease risk prediction.227
Although several diseases have been claimed to be investigated by GWASs and meta-analyses of suf-ficiently large sample sizes, most of their heritability still remains unaccounted for. This missing herit-ability has stimulated much discussion on future strategies for detecting the remaining genetic var-iants associated with complex phenotypes. The proposed strategies range from increasing the sample sizes by combining several GWASs through meta-analysis in order to attain a higher statistical power, to more complicated experiments such as epigenetic studies.5,228 The methodologies for meta-analysis and for the merging of SNP geno-type data from multiple GWASs employing differ-ent genotyping arrays are now well developed and rely upon newly developed genotype imputation methods.229 – 231 By contrast, there are still many experimental and analytical uncertainties and chal-lenges to be faced in the context of epigenetic studies of complex phenotypes.232,233 Other approaches are summarised in Figure 1.
second tier of replication, where more SNPs from stage 1 are tested to assess their associations.236 (3) The role of CNVs is increasingly recognised as being associated with complex diseases and traits; thus, it is important to investigate their associations
with these complex phenotypes.111 (4)
Resequencing of the GWAS loci will be needed to uncover additional rarer variants. The success of this approach has been demonstrated in the discov-eries of multiple rare variants for type 1 diabetes and hypertriglyceridaemia.237,238 (5) Integrating GWAS results with other sources of genomic data, such as expression quantitative trait loci (eQTL) and ChIP-Seq, has led to the discovery of novel SNP associations.239,240 (6) Subgroup analysis of disease phenotypes is a powerful approach to identify-ing genetic variants that are specific to certain sub-types. For instance, differences in SNP associations for oestrogen receptor-positive and -negative breast cancer have been shown.241 (7) Pathway-based approaches have been developed using prior biological knowledge of gene function to facilitate more power-ful analysis of GWAS datasets.242(8) Most studies have not taken epistasis and gene–environment interactions into account, which could account for a proportion of the missing heritability of complex phenotypes; however, challenges associated with studying these interactions should also be noted.243,244
Genetic architecture of complex diseases
The genetic architecture of complex diseases has been the subject of intense debate over the past decade59,60 and has been polarised by the emer-gence of two opposing models: the CD/CV hypothesis and the multiple rare variant or common-disease rare-variant (CD/RV) hypothesis.245 The CD/CV model formed the basis of the HapMap Project and largely influenced the development of commercial genotyping arrays with respect to SNP selection. Therefore, the published GWAS using the HapMap data mainly involved the interrogation of the association of common SNPs (MAF.5 per cent) with complex diseases and traits.
One of the reasons that the CD/CV model became favoured was because of the sequencing technologies available at that time. Sanger sequen-cing did not allow the survey of rare variants in the whole genome. By contrast, the convenient high-throughput genotyping platforms have enabled efficient interrogation of up to one million SNPs throughout the genome, which eventually indirectly leads to the capture of almost all the SNPs in the HapMap Project. Furthermore, it is more affordable to genotype (rather than to sequence) the entire genomes of several thousand cases and controls as part of an adequately powered association study.
Currently, the results from the GWASs focus on common SNPs and explain only a small fraction of the heritability of complex phenotypes.5 The missing heritability has challenged the validity of the CD/CV hypothesis, and has also diverted
research endeavours toward rare
var-iants;109,237,238,246,247 however, published data have revealed the contributions of both common and rare variants to complex phenotypes. The results from GWASs have strongly supported the involve-ment of common variants, especially common SNPs, in complex phenotypes.132 Moreover, recent studies have shown that common SNPs can explain a greater proportion of the heritability than has been accounted for by recent GWASs. These SNPs, however, are often ‘hidden’ within the GWAS data, and will require larger sample sizes to be uncovered.248,249
The data supporting the roles of rare variants have also been accumulating from an increasing
number of studies of less-common
SNPs109,237,238,246 and rare CNVs.250 – 253 This suggests that the genetic architecture of complex phenotypes is likely to comprise both common and rare variants. The relative proportions of these var-iants remain to be determined and will remain unclear until all the genetic variants for most complex phenotypes are found; furthermore, the relative proportions are likely to vary between different complex phenotypes, with some pheno-types having a greater influence on the genetic sus-ceptibility risk by common variants, whereas other phenotypes may be more affected by rare variants. Being able to predict the genetic architecture of complex phenotypes is critical, however, as it will determine the future strategies to be adopted in seeking disease variants.
Homozygosity mapping
Homozygosity mapping has been shown to be useful in the identification of disease susceptibility genes in complex diseases.254,255 An ROH defines an uninterrupted stretch of a DNA sequence lacking heterozygosity in the diploid state (ie in the presence of both copies of the homologous DNA
segment). Thus, all the genetic variants within the homologous DNA segments are represented by two identical alleles that contribute to the homo-zygosity.28 Currently, there are no standardised cri-teria to define an ROH. Previous studies have focused on regions 1 Mb, however, and hence the true extent of homozygosity in the human genome could have been underestimated because shorter regions were not considered.28,256,257 More recent studies have defined ROHs as having a minimum length of 500 kb,258 the intention being to avoid underestimation of the number of such regions in the human genome.
Although long continuous ROHs were first documented a decade ago, until recently no large-scale population-based studies had been per-formed to assess the extent of ROHs in the human genome.259 The recent advances in the genome-wide detection and characterisation of ROHs have been driven mainly by the availability of highly accurate SNP databases such as the HapMap project28 and advanced genotyping technol-ogies.24,25 Genotyping a large number of SNPs on a microarray platform presents a powerful tool for detecting ROHs comprehensively across the whole genome, thereby enabling investigation of the number, length, location and distribution of the ROHs in the human genome in a more unbiased manner, as compared with microsatellite markers. It was not previously expected that the genomes of outbred populations would contain ROHs of several Mb in length until the early reports appeared in 2006/2007.28,256,257
Many novel causal genes or mutations under-lying autosomal recessive disorders have been
ident-ified through homozygosity mapping. This
approach is particularly useful for investigating these disorders in populations with a high preva-lence of consanguinity, as is evident from the many recent studies that have identified causal mutations.260 – 265
associated with lower blood pressure and total and low-density lipoprotein (LDL) cholesterol by measuring genome-wide heterozygosity.268 In addition to quantitative traits, inbreeding has also been found to be a significant positive predictor for a number of late-onset complex diseases, such as coronary heart disease, stroke, cancer and asthma.266 These studies have strongly supported the hypothesis that the genetics of complex pheno-types include a component which corresponds to recessively acting variants. The importance of ROHs to complex phenotypes remains largely unexplored; however, several studies have shown significant differences in ROHs between cases and controls in genome-wide investigations for schizo-phrenia269 and late-onset Alzheimer’s disease.270 Success was also achieved for complex quantitative traits such as height, where strong statistical evi-dence for an association of a particular ROH with height was obtained in a total sample size of .10,000. The height of individuals with this ROH was significantly higher (increased by 3.5 cm) than the individuals lacking the region.258 Cataloguing ROHs in human genomes and investi-gating their associations with complex phenotypes by building on existing GWAS data should be fruit-ful areas for future research.
Beyond SNPs: CNVs
A new era of CNV discovery began when two separate studies, published concurrently in 2004, identified several hundred deletions and duplications in the human genome.26,27 Such genetic abnormal-ities had actually been documented decades before, however, in clinical cytogenetics studies that found them to be a cause of various genomic or cytoge-netic disorders.271 The distinguishing feature of the recent studies was that these CNVs were found to be much more prevalent in the human genome than previously expected. These changes in copy number did not result in any clinical disorder or pathological phenotype and were found in the genomes of phenotypically normal individuals. As these submi-croscopic (,5 Mb) deletions and duplications were below the detection limit of traditional cytogenetics
tools such as fluorescence in situ hybridisation (FISH), these recent discoveries were credited to the use of whole-genome microarray technologies.272
Although these early whole-genome microarray studies discovered several hundred new CNVs, it was clear from the outset that that this would be a gross underestimate of the true total. These studies used ‘low-resolution’ microarrays such as represen-tational oligonucleotide microarray analysis (ROMA) containing 85,000 probes with a resolution of approximately one probe per 35 kb26or the bacterial artificial chromosome– comparative genomic hybridisation (BAC-CGH) array with a resolution of approximately one probe per 1 Mb.27 Further, these studies investigated a small sample size, which limited the efficiency of detection of less common CNVs. CNVs smaller than 50 – 100 kb would not have been detected because their size was below the resolution limit for these microarrays. Thus, both the sample size and the resolution of the microarray are critical factors that contribute to the discovery of less common and/or smaller CNVs.
The contribution of CNVs as a major source of genetic variation in human populations has become appreciated despite the limitations of the microarrays. The first comprehensive mapping of CNVs in 270 samples from the HapMap Phase I project identified a total of 1,447 copy number variable regions, cov-ering 360 Mb. These regions contained hundreds of genes, disease loci, functional elements and segmen-tal duplications.22 The limitations of ROMA and the BAC-CGH arrays have been overcome in later studies by the use of higher-resolution microarrays and larger sample sizes comprising several hundred samples.23,105,273 – 276High-resolution tiling oligonu-cleotide microarrays, comprising 42 million probes, were used to generate a comprehensive map of 11,700 CNVs.105 Yim et al.275 screened CNVs in 3,578 healthy, unrelated Korean individuals, using the Affymetrix SNP Array 5.0.
in copy number. These copy-neutral variations have also been found to be associated with disease.279 Collectively, these copy number and copy-neutral variations are broadly classified as ‘structural variations’. As discussed, the genome-wide mapping and detection of CNVs in different populations has advanced considerably since 2004, being driven mainly by microarray technologies such as oligonucleotide-CGH and SNP microar-rays. By contrast, the pace in identifying inversions and translocations in the human genome has been slower because more powerful and effective methods were not available until the advent of NGS technologies76 (Boxes 4 and 5).
The discovery of a 20 kb deletion located immediately upstream of the immunity-related GTPase family M gene (IRGM) underlying Crohn’s disease, and the identification of a 45 kb deletion that is in perfect LD with body mass index-associated SNPs near the neuronal growth regulator 1 gene (NEGR1),287,288 together with other studies
reporting evidence for LD of CNVs with
GWAS-SNPs at r2.0.5, suggest possible associ-ations of CNVs with a variety of different human complex diseases and traits.105 The genome-wide study performed by the Wellcome Trust Case Control Consortium (WTCCC) investigating the association between 3,400 common CNVs and eight complex diseases in 19,000 samples did not yield any novel discoveries;111 however, rare CNVs associated with various complex phenotypes have been identified in studies of schizophrenia,250,289,290 epilepsy251 and severe early-onset obesity.252,253 The studies on schizophrenia found that rare structural variations that disrupt multiple genes in neurodeve-lopmental pathways are over-represented in cases, as compared with controls.250,289
High-throughput sequencing
technologies and their impact on
genomic studies
The advent of high-throughput sequencing tech-nologies has initiated the ‘personal genome sequen-cing’ era for both normal and cancer genomes, and
large-scale genome sequencing studies such as the 1000 Genomes Project and the International
Cancer Genome Consortium. The
high-throughput sequencing technologies also provide new opportunities to study Mendelian disorders through exome sequencing and WGS. Several international projects have also been launched to explore functional genomics.
High-throughput sequencing technologies
NGS technologies have only been on the market since 2004, but have now largely replaced Sanger
sequencing technologies (owing to the
ultra-high-throughput production capacity of NGS technologies, which is a thousand times greater than that of traditional sequencing). One of the major differences is the ability of next-generation sequen-cers to simultaneously sequence millions of DNA fragments; hence, they are also referred to as mas-sively parallel sequencing technologies. This feature has considerably increased the number of nucleotides that can be sequenced per instrument run when compared with Sanger sequencing. The sequencing chemistry of NGS technologies, together with their ultra-high-throughput production capacity, has also reduced sequencing costs significantly, making large-scale or WGS studies much more afford-able.29 – 31 The sequencing technologies currently available can be broadly grouped into NGS technol-ogies such as the Roche 454 Genome Sequencer FLX (GS FLX) System, Illumina Genome Analyzer (GA) and HiSeq and Life Technologies Supported Oligonucleotide Ligation Detection System (SOLiD), and TGS (or single-molecule sequencing) technologies such as the HeliScope Single Molecule Sequencer (Helicos Biosciences).32
One of the more laborious steps in WGS using the Sanger method was the in vivo amplification step using bacterial cloning. This has now been substituted by the in vitro amplification of millions of DNA fragments by NGS technologies using emulsion polymerase chain reaction (PCR) (Roche GS FLX and Life Technologies SOLiD) or bridge amplification on a solid surface (Illumina GA and
Box 4.
Characterising structural variation by means of sequencing
The discovery of copy-neutral variations has been attributed to the development of the PEM method and concurrent advances in NGS technologies. The PEM method has also contributed greatly to the discovery of CNVs in the human genome.76,81,280 Further studies have also taken advantage of an important feature of sequencing data generated by NGS technologies, where several hundred million short sequence reads are produced per instrument run to detect CNVs based on the abundance or density of the sequence reads aligned to the reference genome. This approach is known as depth-of-coverage (DOC) and is similar to microarray-based methods, in that it is also unable to detect copy-neutral variations.281
PEM
In the PEM method, a library of DNA fragments with a fixed insert size is prepared and both ends of the DNA fragments are sequenced to generate ‘paired-end sequences’ (the sequences at both ends of the DNA fragments). This sequence information is then aligned against the reference genome. The underlying principle of PEM in detecting structural variations is reliance upon the discordance in insert size and orientation of the paired-end sequences being aligned to the reference genome to infer ‘simple’ deletion, insertion and inversion. Thus, when paired-end sequences aligned to the reference sequence display discordance from the expected insert size or distance, this is indicative of either a del-etion or an insertion, whereas discordance in orientation suggests the presence of an inversion (ie paired-end sequences are incorrectly oriented by comparison with the reference genome). Hence, the paired-end sequences are usually classified as ‘concordant pairs’ or ‘discordant pairs’; only the discordant pairs are informative for inferring structural variants. Other, more complex, rearrangements — such as ‘everted duplications’, ‘linked insertions’ and ‘hanging insertions’ — can also be detected.282
DOC
The DOC method utilises NGS data for CNV detection. This method is based on the DOC of the sequence reads to infer deletions and duplications. The DOC method is made possible by the pro-duction of several hundred million short sequence reads per instrument-run by NGS technologies. The principle underlying the DOC approach is based on the assumption that the sequencing process is uniform, so that the number of sequence reads mapping to a region follows a Poisson distribution. As such, the number of sequence reads should be proportional to the number of times that a particular region appears in the genome. Therefore, it is expected that a duplicated region will have more reads aligned with it, with the converse being true for deletions.281,282 The assumption that the sequencing process is uniform may not be valid, however, because of the sequencing bias of the NGS technologies, which leads to certain regions of the genome being over- or under-sampled, resulting in spurious signals.283 Despite their shortcomings, the PEM and DOC methods will continue to play a role in the discovery of structural variations until de novogenome assembly becomes more feasible.
Application in cancer studies
Box 5.
International effort to characterise structural variants using PEM
Proof-of-concept studies
The PEM method for detecting structural variants was first demonstrated by Tuzun et al. by mapping paired-end sequences data from a human fosmid DNA genomic library.285 The average insert size of a fosmid library is approximately 40 kb. This study identified 297 structural variants (139 insertions, 102 deletions and 56 inversions); however, sequencing of fosmid clones by means of Sanger sequencing is laborious and costly.285 These limitations have been overcome by NGS technologies which directly sequence the paired-end or mate-pair libraries without the need for cloning steps.76 Both of these studies applied the PEM approach to investigate structural variants in the same sample (NA15510) from the International HapMap Project. Their library insert sizes differed, however, and this has enabled a comparison of the sensitivity between these studies. Korbelet al.76were able to confirm 41 per cent of all deletion and inversion events detected by fosmid paired-end sequencing. Moreover, they identified an additional 407 structural variants in NA15510 that previously had not been detected by fosmid paired-end sequencing. This further suggests that several libraries with different insert sizes are needed to increase the sensitivity of PEM.
Human Genome Structural Variation Working Group
In addition to individual studies, a large-scale effort is currently being undertaken by the Human Genome Structural Variation Working Group comprehensively to map structural variants in phenotypi-cally normal individuals using the PEM approach.79 More specifically, the objective is to characterise the pattern of human structural variants at the nucleotide sequence level from a collection of 48 indi-viduals of European, Asian and African ancestry. This project plans to make fosmid clone libraries of approximately 40 kb insert size from the genomic DNA of 48 unrelated females. These samples were already genotyped by the HapMap Project. A larger insert size of approximately 150 kb prepared from BAC clone libraries will also be constructed from 14 unrelated HapMap males. This will aim to provide sequence information on structural variants that are too large to be included in the fosmid libraries, such as those associated with segmental duplications. As such, both the fosmid and BAC libraries will ensure the comprehensive capture of structural variants of varying sizes across the human genome.
technologies broadly can be divided into: (1) sequencing-by-synthesis mediated by DNA poly-merase (ie pyrosequencing for Roche GS FLX and sequencing by reversible terminator chemistry for the Illumina sequencing platform); and (2) sequencing-by-synthesis mediated by DNA ligase for Life Technologies SOLiD.29 – 31
Whole-genome resequencing can now be
accomplished relatively rapidly because of the avail-ability of the HGP template for alignment of the billions of short sequence reads produced by next-generation sequencers. This is necessary because the NGS technologies are characterised by short sequence read lengths of approximately 50 – 125 bp for both Illumina and Life Technologies sequencing platforms.29 – 31 This feature makes de novo sequen-cing, or the assembly of billions of short sequence reads into large contigs challenging — especially for large and complex genomes like the human genome.291 A longer read length is key to obtain-ing larger contigs with fewer gaps between them during the assembly steps. Although the latest improvements in sequencing chemistry and systems allow the Roche GS FLX to achieve a sequence read length of 500 bp on average, this is still mark-edly lower than the 800 bp to 1 kb length achieved by Sanger sequencing (http://www.454.com/).292 In addition to a short read length, NGS technol-ogies have higher sequence error rates, although this gradually has been improving.293
A relatively new addition in the NGS market is the Ion Torrent Personal Genome Machine
(PGM) produced by Life Technologies
(http://www.iontorrent.com/). The earlier NGS technologies relied on emission of either fluor-escent (Illumina and Life Technologies SOLiD sequencing platforms) or chemiluminescent (Roche GS FLX) light to detect and distinguish the nucleotides incorporated during sequencing. However, the Ion Torrent PGM uses proprietary semiconductor sensors to perform direct real-time measurement of the hydrogen ions released upon incorporation of nucleotides during sequencing. Several ion semiconductor sequencing chips will be available, with throughputs ranging from .10 Mb to .1 gigabase (Gb) per instrument run, but these are many-fold lower than the several hundred Gb of sequencing data generated by the latest Illumina HiSeq and Life Technologies SOLiD machines. The Ion Torrent PGM is therefore more suitable for smaller-scale targeted sequencing.
The first TGS instrument — the Heliscope Single Molecule Sequencer — is now commer-cially marketed by Helicos Biosciences. The Heliscope Single Molecule Sequencer or true single-molecule sequencing (tSMS) is vaguely classified as a TGS technology because it has fea-tures of both NGS and TGS technologies. It is considered to be a TGS platform because of its ability to perform single DNA molecule sequen-cing without the need for whole-genome amplifi-cation but the sequencing is still based on ‘cyclic sequencing’ (repeated cycles of sequencing)
com-prising several steps, such as flow of