e
-ISSN: 2278-067X,
p
-ISSN: 2278-800X, www.ijerd.com
Volume 5, Issue 11 (February 2013), PP. 78-85
A Study on the Application of Neural Network to the
Prediction of Weight Control
Hung-Teng Chang
1, Pin-Chang Chen
2, Han-Chen Huang
3, De-Hua Lin
41,2,4Department of Information Management, Yu Da University, Taiwan, R.O.C. 3(Corresponding Author)Department of Leisure Management, Yu Da University, Taiwan, R.O.C.
Abstract:- Based on literature review and data collection, this study enabled university students and their parents to understand the causes and severity of obesity. This study collected various factors affecting obesity. In addition, this study also established the model affecting obesity based on the characteristics of learning ability, classification and predication of back-propagation neural network in order to provide such information as reference for obese people to lose weight. This study used sampling method to conduct a questionnaire survey on obese students, in order to investigate their personal living habits and dietary habits. This study used the back-propagation neural network software – Alyuda NeuroIntelligence for the analysis, pre-processing, design, training and verification of data, in order to find out the correlation between the sum of these factors and obesity (in percentage), and used the model as the basis. The data collected from the questionnaires completed by the subjects were input into the model established in this study, in order to understand which individual habit combinations are the factors leading to obesity, as well as to provide such information as the reference for weight control.
Keywords:- Weight control, Neural networks, Obesity, Back-propagation neural network, Alyuda NeuroIntelligence.
I.
INTRODUCTION
In recent years, owing to the changes in living environment, most of the workers who used to be the working class have become white-collar workers. The office lifestyle, increase in the number of people who eat out, changes in lifestyles and eating habit, convenient transportation and lack of exercise habit and opportunity of most people have led to the increase in obese population and overweight. Moreover, chronic diseases indirectly or directly caused by obesity have become more and more common in young people.According to the studies from various fields in recent years, obesity seems to be associated with chronic diseases because it may lead to diseases such as cardiac diseases, hypertension, diabetes, renal diseases, respiratory diseases and cardiovascular diseases. Furthermore, obesity may also impose high pressure on the strongest part of body – bones, and thus lead to degenerative joint disease and wear and tear of bones, which has a severe impact on human health. This study selected obese university students as the subjects to find out relevant factors affecting obesity. Based on literature review and data collection, this study enabled students who were overweight and even troubled by obesity and their parents to better understand the influences of obesity, as well as to attach further importance to obesity issues and weight control approaches.
II.
LITERATURE REVIEW
A. Definition of Obesity
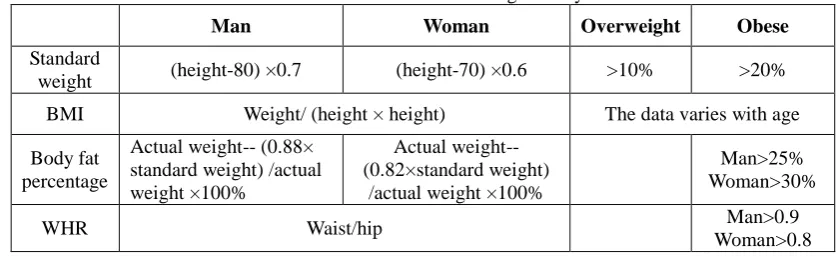
The definition of obesity varies with measurement methods [1-4]. There are four common measurement standards for obesity: 1) standard weight; 2) body mass index (BMI); 3) body fat percentage; 4) waist to hip ratio. The first two of them are measured based on height and weight, waist and hip ratio is measured based on body type and proportion and body fat percentage is the only standard which actually measures fat [5, 6]. However, because its measurement procedures are more complicated, this study used the BMI as the measurement standard. The explanations are given as follows:
(A) Standard Weight: The calculation of standard weight varies with races and regions. The current calculation method used in Taiwan is that used by World Health Organization. The standard weight of a man is:(height –80)* 70%. A man whose standard weight ≧10% is deemed overweight, and whose standard weight ≧20% is deemed obese. The standard weight of a woman is: (height - 70)* 70%. A woman whose standard weight ≧10 is deemed overweight, and whose standard weight
(B) Body Mass Index: Body Mass Index (BMI) is calculated as weight (kg)/[height (m)2] (weight/height2).
(C) Body Fat Percentage: Body fat percentage refers to the fat content in body (in percentage), namely, [ratio of total body fat and body weight]*100%. In general, it can be expressed in fat mass or Body Fat (%BF). Obesity is the medical condition in which the adipose tissue in body exceeds the proportion for maintaining normal function. A man whose BF% exceeds 25% of his weight is deemed obese, and a woman whose BF% exceeds 30% is deemed obese. The descriptions above are summarized as follows:
Man: actual weight-- (0.88× standard weight) / actual weight ×100%
Woman: actual weight -- (0.82× standard weight) / actual weight ×100%
Moreover, Wikipedia mentions another calculation method: Body fat% =1.2 × BMI + 0.23 × age - 5.4 - 10.8 × sex (man = 1; woman = 0). Although BF% can be used to calculate the ratio of fat in body, its calculation procedures are more complicated. Therefore, this study did not use it. (D) Waist-to-Hip Ratio (WHR): It is preferable to maintain the ratio of chest, waist and hip at 3: 2: 3.
WHR is regarded as the simplest index for assessing the fat accumulated in abdomen. Even though the weight of a person has not exceeded the standard, the fat in his/her body may threaten his/her health. For example, a man whose WHR is greater than 0.9 (waist/hip) or a woman whose WHR is greater than 0.8 is deemed overweight. However, the fat accumulated in abdomen of body may increase the risk of cardiovascular diseases. Based on the above, there are four standards for measuring obesity, including standard weight, BMI, body fat percentage and WHR. Among them, BMI is the newest measurement standard. In addition, owing to its convenience for use, it is most frequently used as the index for measuring obesity. The aforementioned four measurement standards are summarized in Table 1:
Table 1: Standards for Defining Obesity
Man Woman Overweight Obese
Standard
weight (height-80) ×0.7 (height-70) ×0.6 >10% >20% BMI Weight/ (height × height) The data varies with age
Body fat percentage
Actual weight-- (0.88× standard weight) /actual weight ×100%
Actual weight-- (0.82×standard weight)
/actual weight ×100%
Man>25% Woman>30%
WHR Waist/hip Man>0.9
Woman>0.8
B. Back-propagation Neural Network
This study used the back-propagation network (BPN) of neural network, a representative approach which has been commonly applied to the current neural network learning model. The oldest neural network is perceptron. However, it does not possess the learning ability of network. After the learning algorithm in the hidden layer was included, it can be used to solve not only linear problems, but also elliptic curve problems. After the BPN was improved, the more matured BNP used the gradient steepest descent method as the basic principle to minimize the error function [7]. The weight values were repeatedly revised to draw closer the inferred output value and the target output value, in order to achieve the ultimate objective of learning. In addition, because several hidden layers were added into the BPN, the problem of insufficient learning ability in the oldest neural network – perceptron was solved [8].
The learning model of back-propagation network is a supervisal one, and it possesses the functions of classification and prediction. During network computing, after the training samples were input into the network for networking training, the trained samples could be input into it to check whether the network was accurate, or the untrained data could be input into it for estimation of function [9].
III.
METHODOLOGY
affecting obesity. The data (%) obtained from this system is the proximity to obesity. The higher the percentage is, the more obese the subject is. The data could be provided as reference to obese students for weight control or their parents for adjusting the lifestyle and eating habit of university students. The data provided from this study are the correlation with obesity. The constitution of everyone is different, and thus the factors reflected by them are different. Relevant information can be provided as reference to individuals.
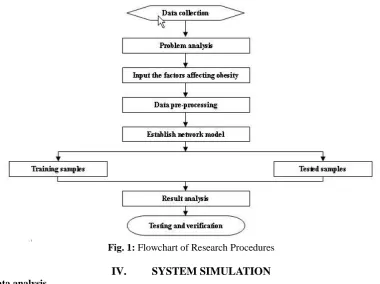
This study collected and arranged the data from obesity-related studies, analyzed the data background and referred to relevant studies to summarize the important affecting factors as the input variables to find out available data for data processing, including data scaling, variable combination, etc. Moreover, this study established a neural network model and set up various parameters. After the data were collected and the variables were properly selected, the data pre-processing was initiated, including the procedures such as selection of training samples and tested samples and their quantity, input of data or their combinations, data scaling, etc. [10-13]. The research procedures of this study are shown in Figure 1which describe as follows:
A. To collect the historical data concerning obesity, including the literature review on relevant previous studies.
B. To analyze the physical condition, dietary problems and working and living habits and environments of current university students.
C. To find out various factors leading to obesity. To find out the main factors, such as heredity, illness, exercise, diet, time, income, behavioral habit, living habit, medication, etc. to develop the questionnaire and to conduct the questionnaire survey on university students aged 18-21.
D. To use the Alyuda NeuroIntelligence software of neural network to analyze and process the survey results as the basic database.
E. To establish the accurate model and to use it to predict the factors leading to the obesity of university students.
F. To verify the analysis results.
Fig. 1: Flowchart of Research Procedures
IV.
SYSTEM SIMULATION
A. Data analysisThis study used the data of height and weight collected from the questionnaires as the basis to collect relevant factors, such as heredity, congenital diseases, dietary orientation, exercise habit, acquired diseases, psychological status, exercise intensity, exercise time, economic status, childhood obesity, sleep quality, stress status, medication, gender, number of meals, lifestyle, interpersonal relationship, dietary habit, negative emotions and personality. This study then performed statistical analyses on various data, respectively.
Fig. 2: Data Input
The function of analysis was activated, as shown in Figure 3. The final objective of prediction: obesity was selected in the field of Target.
Fig. 3: Data Analysis
The function button of analysis field is to input basic data in all the fields:
The meanings of basic data in the fields were analyzed. The software would actively look for unreasonable data and revise them. For example, a height which exceeds 3 meters.
The inadequate data in the fields would be presented with a shaded background. The missing data would be presented with a pale green background. Wrong data in the fields would be presented with a lavender background. Data presented with a dark red background would be isolated and would not be analyzed. Therefore, this software removed meaningless data, which improved the deficiency of generalization of he past neural network.
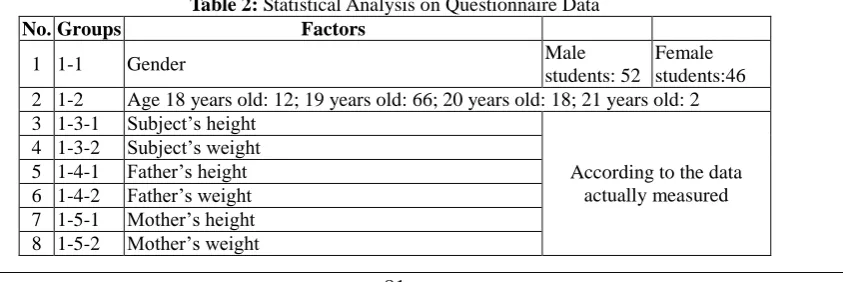
Among the 98 data input in the software, 70% of them were selected as the training samples. The software would arrange them into a basic model for the subsequent training procedure. 15% of the data were selected for testing, and 15% of them were selected for verification, namely, the subsequent testing procedure.
Table 2: Statistical Analysis on Questionnaire Data
No. Groups Factors
1 1-1 Gender Male
students: 52
Female students:46 2 1-2 Age 18 years old: 12; 19 years old: 66; 20 years old: 18; 21 years old: 2 3 1-3-1 Subject’s height
According to the data actually measured 4 1-3-2 Subject’s weight
Statistical Results Yes No
9 2-1-1 Whether the subject’s parents suffer from
congenital diabetes 2 96
10 2-1-2 Whether the subject’s grandparents suffer from
congenital diabetes 3 95
11 2-1-3 Whether the subject’s parents suffer from
congenital thyroid dysfunction 1 97
12 2-1-4 Whether the subject’s grandparents suffer from
congenital thyroid dysfunction 0 98 13 2-1-5 Whether the subject’s parents suffer from
congenital hyperinsulinism 3 95 14 2-1-6 Whether the subject’s grandparents suffer from
congenital hyperinsulinism 0 98
15 2-1-7 Whether the subject’s parents suffer from
congenital adrenal hyperfunction 2 96
16 2-1-8 Whether the subject’s grandparents suffer from
congenital adrenal hyperfunction 0 98 17 2-2-1 Father’s BMI (obesity) 34 64 18 2-2-2 Mother’s BMI (obesity) 33 65 19 3-1-1 Whether the subject suffers from diabetes 3 95 20 3-1-2 Whether the subject suffer from thyroid
dysfunction 1 97
21 3-1-3 Whether the subject suffers from hyperinsulinism 1 97 22 3-1-4 Whether the subject suffers from adrenal
hyperfunction 1 97
23 3-1-5 Whether the subject suffers from chronic otitis
media 8 90
24 3-1-6 Whether the subject suffers from tonsillitis 6 92 25 3-1-7 Whether the subject is on long-term medication 5 93
26 3-2-1 Whether the subject frequently drinks sugary
drinks 57 41
27 3-2-2 Whether the subject frequently eats fried food 12 86 28 3-2-3 Whether the subject frequently takes tonics 15 83 29 3-2-4 Whether the subject has regular meals 72 26 30 3-2-5 Whether the subject has a fixed amount of three
meals 52 46
31 3-2-6 Whether the subject overeats frequently 14 84 32 3-2-7 Whether the subject eats breakfast everyday 88 10 33 3-2-8 Whether the subject has a night snack frequently 22 76 34 3-2-9 Whether the subject’s lifestyle is normal 67 31 35 3-2-10 Whether the subject has sufficient sleep time 86 12 36 3-2-11 Whether the subject has a regular exercise habit 51 47
37 3-2-12 The subject’s heartbeat during exercise is greater
than 130 56 42
38 3-2-13 Whether the subject takes exercise for more than
30 minutes 55 43
39 3-2-14 Whether the subject frequently feel stressed 33 65 40 3-2-15 Whether the subject chats with fixed friends 85 13
41 3-2-16 Whether the subject frequently feel anxious and
depressed 14 84
42 3-2-17 Whether the living environment frequently makes
the subject feel nervous 17 81 43 3-2-18 Whether the subject vents emotions by eating 20 78
44 3-2-19 Whether the subject frequently eats snacks when
As shown in Table 2, among the 52 male students and 46 female students completing the questionnaires, 12 of them were aged 18, 66 of them were aged 19, 18 of them were aged 20 and 2 of them were aged 21. Among the 45 fields of factors, 2-2-4, 2-2-6 and 2-2-8 as completed by all the students were the same. Therefore, they were not included in the discussion. There were 42 input layers totally. Table 3 explained the factors correlated with obesity where 1 denotes Yes and 2 denotes No. In other words, the disease factor, living habit and dietary behavior mentioned in the statistical table of factors are all the factors leading to individual obesity.
Table 3: Factors Associated with Individual Obesity
Gender Age 2-2-1 2-2-2 3-2-1 3-2-2 3-2-4 3-2-5 3-2-7 3-2-8 3-2-9 3-2-10 3-2-12 3-2-13 3-2-14 3-2-15 3-2-18 3-2-20
Female 18 1 2 1 2 1 1 1 2 2 1 1 2 1 1 1 1
Male 18 1 2 1 2 1 2 1 1 1 1 1 1 1 1 2 2
B. Data Preprocessing
The Alyuda NeuroIntelligence software would automatically divide and arrange the input data and condense the 42 dependent variables in the input layers to [-1, 1]. The independent variable “obesity” in the output layer presented in the end was [0, 1], as shown in Figure 4.
Fig. 4: Data Preprocessing
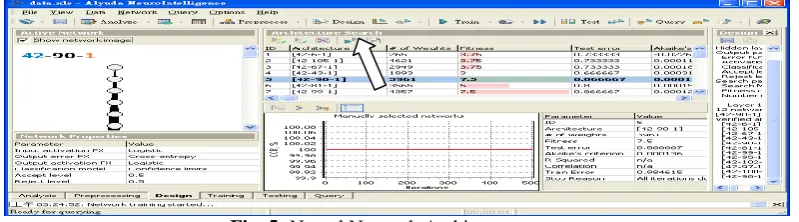
C. Neural Network Design
In terms of the design, Alyuda Neuro Intelligence automatically generalized 11~13 frameworks and presented the optimal neural network framework as reference. The back-propagation neural network framework selected (42-90-1) for setting up, as shown in the boldface text in Figure 5. “42” in the framework suggested that there are 42 data in the input layers (originally, there were 45 factors. 3 of them as completed by the subjects were completely the same, and thus were not included into the calculation). There could be multiple hidden layers. One hidden layer is usually used where the number of nodes (neurons) may vary and is automatically selected by the system. The target value is 1 in the output layer, which can be determined as obese.
Fig. 5: Neural Network Architecture
D. Data Training
Fig. 6: Data Training
The trained basic data input in the horizontal axis in the figure above were presented as the blue curve. After the data verification, they were presented as the green curve. The two curves reached the optimal convergence value at the red dot. The expected 500 times of repeated verification of the red curve significantly showed that the error converged to 200~250.
E. Data Testing and Evaluation
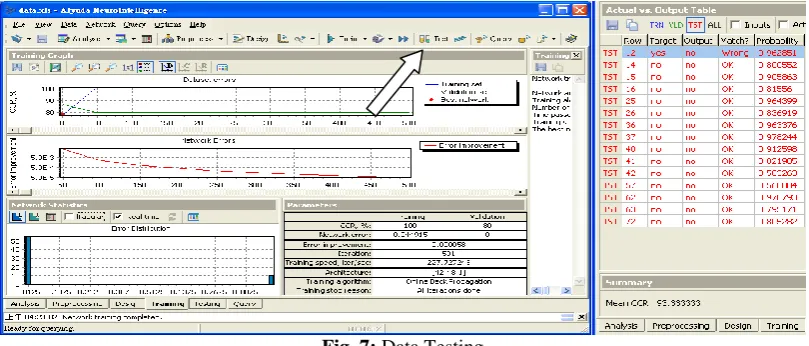
After the data training simulation, the predicted data and actually input data were verified. The predicted value, actual value and the instantaneous predicted value were mutually compared for verification. The results could be used to verify the accuracy of the predicted value trained from the network model. With the actual operation, testing and re-correction of model in this study, the feasibility and economic benefit could be predicted. The data testing and evaluation in this study are shown in Figure 7 and Table 4.
Fig. 7: Data Testing
Table 4: Verification of Simulation Training Serial No. Layer Correlation
1 42-90-1 86.67%
2 42-48-1 93.33%
3 42-105-1 86.67%
4 42-57-1 93.33%
5 42-6-1 86.67%
6 42-43-1 86.67%
7 42-37-1 86.67%
8 42-67-1 80.00%
9 42-14-1 86.67%
After the 10 repeated simulation trainings in this study, the mean reached 86.67%, verifying that the model can be used for the calculation of obesity and as a new index of obesity.
V.
CONCLUSION
The constitution of everyone is different, and the habits leading to obesity also vary with individuals. For example, theoretically, people who eat more sweets are prone to become fat. However, not everyone who eat sweets will become fat, and obese individuals may not necessary eat sweets frequently. The results can be presented as long as the respondents complete the questionnaires and the data were input into the software. This study investigated the research results based on data collection and literature review. This study collected various factors leading to obesity and investigated a series of adverse effects caused by obesity. With the integration of the Alyuda NeuroIntelligence system of neural network used in this study, a new concept for determination of obesity was developed. This index is the percentage integrating the correlation of various factors with obesity. If the percentage is closer to 1, the correlation is stronger. Such an index is different from the current anthropometric indices, such as BMI, WHR, triceps skinfold thickness, body fat and standard weight where height and weight are mainly assessed for calculation.
The model used in this study can explicitly point out which people are significantly correlated with obesity because various factors, other than weight and height, were taken into account. This model does not only simply use height and weight as the standards for measurement, but also can be provided to users for considering or selecting dietary behaviors and living habits, as well as assessing which factors may lead to obesity, to further achieve the objective of weight control.
REFERENCES
[1]. Anthea Wang, Linda S. Kinsinger, Leila C. Kahwati, Sandeep R. Das, Ziya Gizlice, Richard T. Harvey, Mary B. Burdick, Steven J. Yevich, “Obesity and Weight Control Practices in 2000 Among Veterans Using VA Facilities”, Obesity Research, Vol. 13, Issue 8, pp. 1404-1411, 2005.
[2]. Elissa Jelalian, Chantelle N. Hart, Robyn S. Mehlenbeck, Elizabeth E. Lloyd-Richardson, Jamie D. Kaplan, Katherine T. Flynn-O'Brien, Rena R. Wing, “Predictors of Attrition and Weight Loss in an Adolescent Weight Control Program”, Obesity, Vol. 16, Issue 6, pp. 1318-1323, 2008.
[3]. Suzanne Phelan, “Pregnancy: a “teachable moment” for weight control and obesity prevention”, American Journal of Obstetrics and Gynecology, Vol. 202, Issue 2, pp. 135.e1-135.e8, 2010.
[4]. Pamela J. Goodwin, Anne McTiernan, Rena Wing and Arthur Schatzkin, “Physical Activity, Weight Control, and Breast Cancer Risk and Survival: Clinical Trial Rationale and Design Considerations”, JNCI J Natl Cancer Inst., Vol. 101, No. 9, pp. 630-643, 2009.
[5]. Anna S. Mueller, Jennifer Pearson, Chandra Muller, Kenneth Frank, Alyn Turner, “Sizing up Peers Adolescent Girls’ Weight Control and Social Comparison in the School Context”, Journal of Health and Social Behavior, Vol. 51, No. 1, pp. 64-78, 2010.
[6]. Dennis T. Villareal, Marian Banks, Catherine Siener, David R. Sinacore, Samuel Klein, “Physical Frailty and Body Composition in Obese Elderly Men and Women”, Obesity Research, Vol. 12, Issue 6, pp. 913-920, 2004.
[7]. Zexu Zhang, , Shaoshuai Mou, , James Lam, , Huijun Gao, “New passivity criteria for neural networks with time-varying delay”, Neural Networks, Vol. 22, Issue 7, pp. 864-868, 2009.
[8]. Jorge J Palop, Lennart Mucke, “Amyloid-β–induced neuronal dysfunction in Alzheimer's disease: from synapses toward neural networks”, Nature Neuroscience, Volume 13, No 7, pp. 812-818, 2010.
[9]. Biswajeet Pradhan, Saro Lee, “Regional landslide susceptibility analysis using back-propagation neural network model at Cameron Highland, Malaysia”, Landslides, Vol. 7, Issue 1, pp. 13-30, 2010.
[10]. Runqing Huang , Lifeng Xi , Xinglin Li, C. Richard Liu, Hai Qiu, Jay Lee, “Residual life predictions for ball bearings based on self-organizing map and back propagation neural network methods”, Mechanical Systems and Signal Processing, Vol. 21, Issue 1, pp. 193-207, 2007.
[11]. Paulo J. Lisboa, Azzam F.G. Taktak, “The use of artificial neural networks in decision support in cancer: A systematic review”, Neural Networks, Vol. 19, Issue 4, pp. 408-415, 2006.
[12]. Hao Chen, Jitao Sun, “A new approach for global controllability of higher order Boolean control network”, Vol. 39, pp. 12-17, 2013.