A Hybrid System Based on Neural Network and
Immune Co-Evolutionary Algorithm for Garment
Pattern Design Optimization
Zhi-Hua Hu
Logistics Research Center, Shanghai Maritime University, Shanghai 200135, China Email: [email protected]
Abstract—The purpose of this study is to develop a system to utilize the successful experiences and help the beginners of garment pattern design (GPD) by optimization methods. A hybrid algorithm (NN-ICEA) based on Neural Network (NN) and immune co-evolutionary algorithm (ICEA) to predict the fit of the garments and search optimal sizes. ICEA takes NN as fitness function and procedures including clonal proliferation, hyper-mutation and co-evolution search the optimal size values. Then, a series of experiments with a dataset of 450 pieces of garments are conducted to demonstrate the prediction and optimization capabilities of NN-ICEA. In the comparative studies, NN-ICEA is compared with NN-GA to show the value of immune inspired operators. Four types of GPD methods are summarized and compared. Moreover, the hybrid system for general features of garment is discussed. The fit prediction based on NN can achieve the high accuracy with the error rate less than 0.2. The size optimization based on ICEA works well when number of the missing sizes is less than 1/3 of the total size number. The research is a feasible and effective attempt aiming at a valuable problem and provides key algorithms for fit prediction and size optimization. The algorithms can be incorporated into garment CAD system.
Index Terms—Garment pattern design, Hybrid system, Neural network, Immune co-evolutionary algorithm, Fit garment
I. INTRODUCTION
GPD is a complex job mainly depending on the experiences of designers. However, many garment pattern designers are required because the personality for garments is an increasing requirement. How to utilize the successful experiences and how to help the beginners are the problems in this study. How to design fit garment is a main problem in GPD. In this study, it is solved by NN-ICEA.
Because there is no possible mapping function between sizes and fit, NN is introduced to approximate a mapping between the sizes and the fit value. Inspired by immune system and co-evolutionary strategies, ICEA is designed to search the optimal sizes when they are unavailable. The trained NN acts as a fitness function. The unavailable sizes are encoded as a real-value vector. Clonal proliferation, hyper-mutation, co-evolution and immune elimination are designed for effective search. Clonal proliferation generates dynamical population.
Hyper-mutation acts as a variance method to generate diversity. The co-evolution process incorporates the domain knowledge in GPD to strengthen the superiors and tolerate the inferiors. The best one is kept in the immune memory to ensure the monotone evolution. Immune elimination keeps the population stable by eliminating the inferiors. Based on the proposed algorithms and the dataset, a series of experiments are conducted to show the prediction capability of NN and the optimization capability of ICEA.
II. BACKGROUND
A. Copy Intelligent methods in garment design
Although GPD theory tries to solve the problems as many as possible, the experiments of experts do play an important role in almost every aspect of GPD. Therefore, many researchers began to seek intelligent methods for GPD. In [1], an overview of the area of digital pattern developing for customized garment is given. In the literature, there are five types of intelligent methods in GPD.
(1) The first is based on mathematical models, programming methods or other computational models. In [2], the decomposition process of garment is studied by semi-group model. In [3], the geometry of garment is divided into fit zone and fashion zone. In [4], the different aspects of the pattern-making are analyzed and modeled in an object-oriented (OO) model. In [5], an automatic garment CAD system using 3D body scan data is developed. In [6], the mapping from the garment style design to 3D garment stereotype is built with the help of expert knowledge.
(2) The second relates to simulation methods. A new methodology is proposed to prepare and edit initial pattern shape in 3D space by simulating virtual cloth scissoring in [7]. In [8], a review of cloth simulation is given.
(4) The fourth is related to expert system, which has been embodied into almost all studies above. In [13], the study introduces the fundamental theories and methodologies used in the automatic making of basic patterns from 3D garment designs.
(5) Interactive evolutionary algorithm based approach is another active field. However, the existing researches mainly deal with the garment style design. In [14], a framework that fits the needs for virtual garment design and a prototype is presented.
There are some researches related to fit of garment. In [15], the fit problem is focused on. In [16], the article outlines the activities involved in setting up CAD systems to automatically customize garments for fit. In [9], the ease allowance of garment is focused on.
B. Hybrid system based on GA and NN
Generally, there are two types of hybrid algorithms (NN-GA) based on GA and NN. 1) NN is the major method while GA is a common training method for NN, or is to evaluate and optimize the neural network’s parameters and structure [17]; 2) GA acts as the major method and NN is employed to optimize, adjust or present the structure of feasible solution [18], constraints [19] and the fitness function [20] when they are difficult to present. Most of the studies concentrate on the first type of hybrid approach.
The multilayered feed forward network is a useful NN for function approximation [21-24]. The most popular method to perform the NN learning is the back propagation algorithm [25-27]. BP neural network [25-27] is one of the most well-known supervised learning neural network.
GA has been successfully applied in optimization. However, low convergence speed and lack of local search capability prevent the application of GA [28, 29]. In this study, two competitive algorithms including Immune Algorithm (IA) and Co-Evolutionary Algorithm (CEA) are employed to overcome the shortcomings of GA. Moreover, ICEA is developed to combine the power of IA and CEA. Selection, crossover and mutation in GA are strengthened in ICEA by immune inspirations.
C. Immune computation and co-evolutionary computation Artificial Immune System (AIS) inspired by the biological immune system has been applied to a variety of optimization problems [23, 30-33]. Studies have shown that AIS can avoid premature convergence and improve local search capability. Most IAs are designed inspired by clonal selection [34], negative selection [35] and immune network [36]. Another novel inspiration is the cooperative model [37] in immune system. Compared with GA, IA incorporates additional immune strategies such as clonal selection, hyper-mutation and negative selection to avoid the drawbacks of GA. Many researches show that IA can outperform GA in convergence, distribution and quality of solutions [30].
CEA is an Evolutionary Algorithm (EA). The fitness function in CEA depends on the relationships among individuals [38]. It appears to have many advantages over traditional EAs in dealing with large search space with
complex structures, non-intrinsic or complex objective measures [38]. The two kinds of co-evolution are competitive and cooperative evolution. The co-evolutionary strategies finally help to obtain better solutions [39].
III.THE HYBRID SYSTEM FRAMEWORK
A. The framework
In Figure 1, the framework of the hybrid system consists of two stages including fit prediction and size optimization. In fit prediction, the garment size vectors are normalized by the body sizes. Moreover, each piece of garment is tried on by a tester to give the fit value. The normalized size vectors are taken as the input of a Neural Network (NN), whereas the corresponding fit value is the output. The production of this stage is a trained NN. In size optimization, the size vector of a given garment is divided into two parts, a known size vector and an unknown size vector. ICEA searches the optimal size setting for the unknown size vector. The NN predicts the fit value of any full size vector.
Size vectors of N garments Size vector
of body
Size Normalization
Fit value of the N garments
N normalized size vectors
NN training
NN Predictor Xn
ICEA Xy
Parameters
Optimal [Xy Xn] Fit Prediction Size Optimization
Figure 1. The hybrid system framework
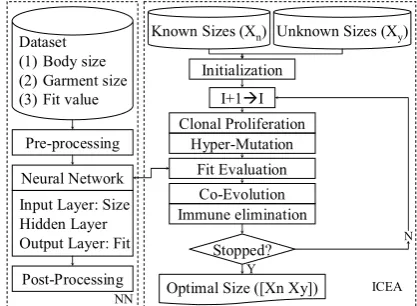
In Figure 2, a flowchart of the hybrid system is shown in detail. In the left, fit prediction is depicted. The composition of the dataset and the layered NN are shown. In the right, the flowchart of ICEA is given. The details of the procedures in NN-ICEA are studied in Section 3.1 and Section 3.2.
Dataset (1) Body size (2) Garment size (3) Fit value
Pre-processing
Neural Network Input Layer: Size Hidden Layer Output Layer: Fit
Post-Processing
Known Sizes (Xn) Unknown Sizes (Xy)
Fit Evaluation
Stopped? Clonal Proliferation
Co-Evolution Immune elimination
Hyper-Mutation
N
Optimal Size ([Xn Xy])
NN ICEA
Initialization I+1ÆI
Y
Figure 2. The hybrid NN-ICEA approach for GPD
B. Fit prediction by NN
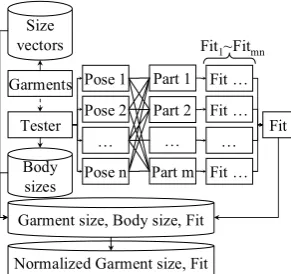
the tester are represented by size vectors. The tester wears the garment one by one to give the fit score of the specific body part in specific pose. Then, the scores of all parts and poses are summed as the fit value of the garment. Then, the garment sizes are normalized by body sizes. Finally, the dataset consists of vectors of normalized garment sizes and fit values. They are the input and output of NN respectively. The fit value is finally normalized to [ ]0,1.
Size vectors Garments
Tester Body sizes
… Pose 2
Pose n
Pose 1 Fit … Fit … … Fit …
Fit
Garment size, Body size, Fit Normalized Garment size, Fit
… Part 2
Part m Part 1
Fit1~Fitmn
Figure 3. Dataset acquisition for fit prediction
We use Fit( )⋅ to represent the mapping from the size vector to fit value. Neural network is a common technique to approximate this function. In GPD, net Breast line (B*), net Waist line (W*), net Hip line (H*)
and low part Length of the body (L*) are four typical body sizes and easy to be acquired. We denote the body size as δ that is corresponding to the garment size χ. A common normalization rule of size χ is commonly computed by Eq. (1)
χ χ
δ
← (1)
C. Size optimization by ICEA
Size optimization is to determine the unknown sizes by ICEA when NN is taken as the fitness function. The optimal sizes maximize the fit of the garment represented by ⎡⎣X Xy, n⎤⎦. The formal description of this problem is given
in Eq. (2).
Maximize: Fit X
(
⎡⎣ y Xn⎤⎦)
(2)Subject to: (1) ln<Xn<un
(2) Li<gi
(
⎡⎣Xy Xn⎤⎦)
<Ui(3) Xy=V
where, constraint (1) and (2) represent the boundaries of the unknown sizes and the size dependence relationships. Constraint (3) specifies the value of the known vector. The model searches the solution of Xn with a maximal Fit( )⋅ .
The trained NN is embedded into ICEA that is employed to search the optimal Xn of ⎡⎣Xy Xn⎤⎦. ICEA are
designed in detail in Algorithm 1.
Algorithm 1 (ICEA: Immune Co-Evolutionary
Algorithm)
Input Xy: the known size vector, Xy=V
[ln un]: the boundary vector of Xn
(
)
n y n n
L g X X U
⎡ ⎡⎣ ⎤⎦ ⎤
⎣ ⎦: the constraints
NN : the trained NN mapping ⎡⎣Xy Xn⎤⎦ to
(
y n)
Fitting X⎡⎣ X ⎤⎦
gen
p : the generations for ICEA
pop
p : the size of population
C
p : the upper bounds of the clonal ratio
Output Xn: The optimal solution of unknown size
vector Process
Step 1 Initialization. Xn is encoded into a real-value vector and initial population A=
{
Ab Ab1, 2, ,Abppop}
isgenerated. Abi∈A (i∈
{
1,2, ,ppop}
) is taken as an antibody while Abi j, is the j-th component inn X .
Step 2 Clonal selection and proliferation: Clonal Proliferation
A⎯⎯⎯⎯⎯⎯→B . The superior individuals are chosen to proliferate with a dynamic clonal ratio determined by their affinity values. The result population is denoted by B.
Step 3 Hyper-mutation: B⎯⎯⎯⎯⎯→Hyper Mutation C . The proliferated antibodies will endure mutation with dynamic probability to generate the diversity of the population.
Step 4 Fitness evaluation: Fit X
(
⎡⎣ y Abi⎤⎦)
. The population is evaluated by NN. The best individual is saved to IM={Abbest} that is animmune memory to register the best individual. Step 5 Co-evolution: C⎯⎯⎯⎯⎯Co-Evolution→D . The domain
knowledge in GPD is employed to perform co-evolutionary variations by cooperation and competition among individuals. The dominated individuals in the Pareto optimal set are tolerated while the non-dominated individuals are kept.
Step 6 Immune elimination: D⎯⎯⎯⎯→Elimination E .The inferior ones in the population are eliminated to keep the population stable.
Step 7 If the number of generations exceeds pgen, IM
is returned, else Goto Step 2.
In the following, the main procedures and concepts in Algorithm 1 are explained:
(1) In Step 1, the initial antibody population (A) is randomly generated satisfying the constraints in Eq. (2). The unknown vector Xn is encoded into a real-value
vector as antibody.
(2) In Step 2, the superior antibodies are chosen by a clonal selection probability (pclonal) that is determined by
affinity between antibodies ( AffAb Ab∼ ) and affinity between antibody and antigen (AffAb Ag∼ ). Antigen is the metaphor of the optimization objective. AffAb Ab∼ and
Ab Ag
Aff ∼ are defined in Eq. (3) and Eq. (4). The fitter the garment is, the higher AffAb Ag∼ is. Moreover, when the
garment is similar with others, AffAb Ab∼ is low.
( )
( )
(
)
k
i Ab Ag i
k Ab S
Fitting Ab
Aff Ab
Fitting Ab
∈
=
∑
( ) { }
{
}
{
}
,
min max
j i
j k
i j Ab S Ab
Ab Ab i
Ab S Ab S k j Ab Ab Aff Ab
Ab Ab
∈ −
∈ ∈
− =
−
∼ (4)
Where, a b− is the Euclidean distance of the two
vectors and represents the similarity of the two vectors. S is the antibody population. In Eq. (3) AffAb Ag∼ is defined to represent the affinity to the objective. AffAb Ab∼ in Eq. (4) is similar with the “crowding” strategy in Evolutionary Algorithm (EA). A better distribution of the population is indicated by a higher value of AffAb Ab∼ . Every antibody
i
Ab in population has the chance to be chosen and proliferated for pclonal( )Abi copies as defined in Eq. (5).
( ) int ~ ( ) ~ ( )
clonal i C Ab Ag i Ab Ab i
p Ab = ⎡⎣p Aff⋅ Ab ⋅Aff Ab ⎤⎦ (5) (3) In Step 3, every proliferated antibody will endure a hyper-mutation process. The mutation rate (pmut) in Eq.
(6) is dynamically determined by affinity. Because the antibody with lower AffAb Ab∼ shows more crowding in the
space, it has the higher probability to mutate.
( )
1 ~( )
Mut i Ab Ab i
P Ab = −Aff Ab (6)
(4) All antibodies are evaluated by NN in Step 4. The best one is memorized by IM. As the fit value is determined by the entire size vector, Fit X
(
⎡⎣ y Abi⎤⎦)
is used to get the fit value by NN.(5) In Step 5, strategies of cooperation and competition are introduced to achieve co-evolution on the antibody population (C). The concept of “Pareto Dominance” in multi-criteria decision making is employed to model the containment relationship between the human body and the garment. If a size vector a={a a1, , ,2 an} is said to be dominated by b={b b1, , ,2 bn}, denoted as a b≺ , a strong logic condition in Eq. (7) must be satisfied.
(
a b≺)
⇔ ∀(
( )(
i ai≤bi) ( )(
∧ ∃i ai≠bi)
)
(7)Or else,
a b
=
ora
≺
cb
. The notation “≺
c ” represents the non-domination relation. Moreover, another concept “Pareto set” (P
) in Eq. (8) is defined to compute the clusters in which antibodies dominate each other.(
) (
(
) (
)
)
(
)
: ,
P a b≠ ∧ a b≺ ∨ b a≺ → a P b P∈ ∈ (8) There are probably more than one P on C. In the view of GPD, garments in the same P have the containment relationship in every pairs. Competitions exist in the same P because the garments in the same P with lower fit value can be discarded. This type of co-evolution is competitive co-evolution. According to the definition of Pareto Set, garments in different Pareto set can not be compared directly by the sizes. They are co-existed to cooperate for optimization. The traditional operator “crossover” in EA is a common implementation of cooperative co-evolution. In this study, a simple one point crossover operator is employed with the probability pcrossover. In competitive
co-evolution, the size of population decreases and then it increases for cooperative co-evolution. Therefore, from C to D the size variation (increase or drop) can not be determined.
(6) Step 6 is to keep the size of the antibody population stable. If D>ppop, the inferior antibodies are chosen to be
eliminated until D=ppop. If D<ppop, new antibodies are recruited by random generation.
(7) ICEA is terminated when it has run for pgen
iterations.
ICEA is an EA with dynamic population. In Eq. (9) and (10), the procedures and the variation of the population size are summarized.
Clonal Proliferation
A⎯⎯⎯⎯⎯⎯→B
Hyper Mutation
B⎯⎯⎯⎯⎯→C
Co-Evolution
C⎯⎯⎯⎯⎯→D
Elimination
D⎯⎯⎯⎯→E
(9)
E = A < B = C (10)
IV.CASE STUDY AND APPLICATIONS
A. Data set preparation
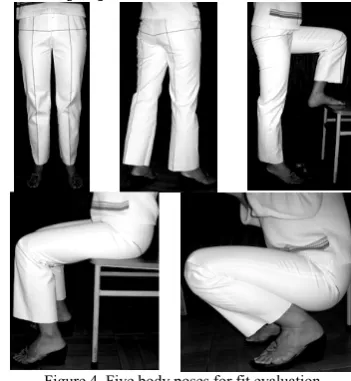
We consider 450 different pieces of pants with almost the same style and material. A female GPD designer is invited as a tester. For each piece of pant, an average fit score is given by the tester for 5 to 10 times. As shown in Figure 4, five poses as shown are used. Five body parts include Waist, Hip, Crotch, Thighs and Knees. Therefore, in every time, 25 scores are recorded. Every score is defined in the range [−3,3]. Finally, the summed score is
normalized to [0,1].
Figure 4. Five body poses for fit evaluation
(
)
* * * *
1/ 1/ 87, 1/ 1/ 95, 1/ 1/ 8 ,
, ,
H L H W
H H L L
INA INA UBW UBW FC FCW
BH BH
α β δ
α β
δ δ δ
δ
= = = = = − =
← ⋅ ← ⋅
← ⋅ ← ⋅ ← ⋅
← ⋅
(11)
B. NN training
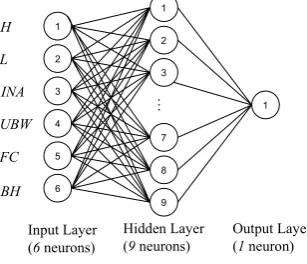
A three-layer BP neural network Figure 5 is built in Matlab with the following settings: 1) the neurons of the input, hidden and output layers are 6, 9 and 1; 2) the transfer function of the hidden layer is “tansig”; 3) the transfer function of the output layer is “logsig”; 4) the limit of training epochs is 4000; 5) training function is “train”; 6) the limit of network error rate is 0.001; and 7) other parameters use the default settings in Matlab toolbox. The input data is normalized to [0, 1] to simplify the training process.
1
2
3
4
5
6
1
2
3
7
8
9
…
1
Input Layer (6neurons)
Hidden Layer (9neurons)
Output Layer (1neuron)
H
L
INA
UBW
FC
BH
Figure 5. Architecture of neural network
The neurons of the hidden layer are determined by maximizing the training performance. We train the neural network whose hidden layer has 6~12 neurons by randomly chosen 400 records. As the result, the setting of 9 neurons gets the minimal error rate and its performance is acceptable. Therefore, the final NN uses 9 neurons in the hidden layer. In training NN, 400 records are randomly chosen as the training set while other 50 are the test set. E Ab( )i represents the average evaluation value of
i
Ab by three experts. err NN( ) is defined in Eq. (12) to
represent the quality of NN. The error rates of the pants in the test set of NN are shown in Figure 6 for demonstration. Although the fit prediction of about 20% pants has the error rate over 0.2, the other 80% are lower.
( )
( )
(
)
(
)
( ) 1/
i
Ab i i
err NN = avg∀ E Ab −Fit Ab (12)
0 0.1 0.2 0.3 0.4 0.5 0.6 0.7 0.8 0.9 1
1 4 7 10 13 16 19 22 25 28 31 34 37 40 43 46 49 Trousers
E
rro
r
Figure 6. Error rate of fit prediction by NN
C. Size optimization
ICEA is implemented by Matlab. All experiments are performed in a personal computer (P4 CPU, 512M RAM). Because the pants in the test dataset are probably not the “best” designs, for each optimal solution returned by ICEA, three experts are invited to give their evaluation values and finally the average score is used for comparison. The average fit score of
Ab
i by experts is( )
iE Ab . As the definition in Eq. (12), the prediction error by NN-ICEA is defined by Eq. (13).
( )
i 1( )
ierr Ab = −E Ab (13)
We use err Ab( )i to evaluate ICEA because Abi is
computed by ICEA. It is different from Eq. (12) that the evaluated size vector in Eq. (12) is extracted from the test dataset. The purpose of NN-CEIA is to search the optimal sizes with the maximizing fit value. However, the fit value in CEIA is computed by NN. The optimal sizes with maximal fit by NN are computed by CEIA. In Eq. (13), the fit of the optimal size is reevaluated by experts. It is rational that this fit value replaces the value by NN to evaluate the optimization performance of ICEA.
The parameters of ICEA are listed bellow.
(1) ⎡⎣Xy Xn⎤⎦ is the six sizes, H, L, INA, UBW, FC and BH. In every time, one or more than one size is missing to test ICEA.
(2)
[
ln un]
: the boundary vector of Xn is determinedby normalizing the minimal and maximal values of the trained dataset.
(3) ⎡⎣Ln g(⎣⎡Xy Xn⎤⎦) Un⎤⎦: in this test, they are set to empty.
(4) pgen=100, ppop=20, pC=10 and pcrossover=0.9
A series of experiments with Xn∈{1,2,3,4,5} are
conducted to evaluate the performance of ICEA. For each
n
X , ICEA runs for 10 times with randomly chosen Xn
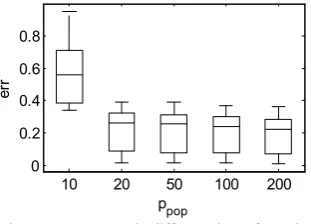
when Xn is satisfied. Then, err( )⋅ in Eq. (13) is computed. In Figure 7, err( )⋅ is shown in a Box plot [40]. When only one size misses, the prediction error is low than 0.2. The effect of Xn =2 is acceptable withAvg err
(
( )⋅ ≈)
0.3.However, when Xn>2 , the prediction error sharply
increases. It can be concluded that NN-ICEA works well when Xn ≤X / 3.
1 2 3 4 5
0 0.2 0.4 0.6 0.8
er
r
|Xn|
Figure 7. Error rate of ICEA compared with experts
In order to reveal the effects of the parameters including generation, population size and clonal proliferation ratio, we conduct a series of experiments to study the error rate when Xn =2, pcrossover=0.9 , with
(1) The effect of various settings of generation. We set
gen
p with 50, 100, 200, 500 and 1000 to test how the
generation number affects the error rate defined in Eq. (13). In Figure 8, the Box plot depicts err( )⋅ in every 10 runs. It can be observed that the more generations produce the lower error rate. However, when the runtime is considered, pgen=100 can be the best setting.
50 100 200 500 1000
0 0.2 0.4 0.6
er
r
pgen
Figure 8. Error rate of ICEA compared with experts
(2) The effect of various sizes of population. The value of ppop is the most serious parameter affecting the
performance. In this experiment, pgen=100 , pC=10 ,
0.9
crossover
p = and Xn =2. The algorithm runs for ten times.
pop
p is assigned 10, 20, 50, 100, 200. In the ten times for
each setting of the population, the run time is of little difference. Therefore, we use the average runtime to evaluate the performance. The runtime in this experiment does not include the time to train NN and the evaluation process by experts. In Figure 9, populations of different sizes of are compared in the runtime. In Figure 10, the error rates in different sizes of population are shown. From the two figures, it can be drawn that ppop=20 is the
best setting when the runtime is important.
0 20 40 60 80 100 120 140 160
10 20 50 100 200
Population
M
inut
es
Figure 9. Average runtime in different sizes of population
10 20 50 100 200
0 0.2 0.4 0.6 0.8
er
r
ppop
Figure 10. Error rate in different sizes of population
3) The effect of various ratios of clonal proliferation. The clonal proliferation affects two aspects of algorithm including the function of immune inspired operators and the performance produced by these complex operators. However, they improve the search capability of
optimization. In this experiment, pgen=100 , ppop=20 ,
0.9
crossover
p = and Xn =2. The algorithm runs for 10
times.
p
C is assigned 1, 10, 15, 20 and 30. Like Figure 9 and Figure 10, Figure 11 and Figure 12 depict the runtime and the error rate for different pC. Although more clonesdecrease err
( )
⋅ , the more runtime is required. Moreover, after pC=10 , the large pC seems produce less improvement when decreasing err( )⋅ .0 20 40 60 80 100
1 10 15 20 25
Clone rate
M
inut
es
Figure 11. Average runtime in different sizes of population
1 10 15 20 25
0 0.2 0.4 0.6 0.8 1
er
r
pC
Figure 12. Error rate in different sizes of population
D. Comparisons between NN-GA and NN-ICEA
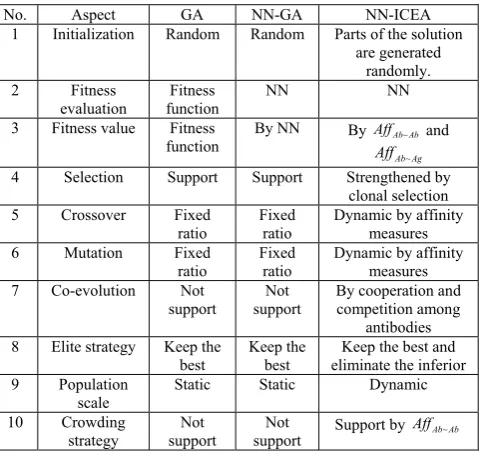
Dr. Dipankar Dasgupta maintains a repository of AIS at (http://ais.cs.memphis.edu/?q=node/8) in which many researches are proved to have improved GA. The advantages of IA and CEA have been studied in literature [28-30]. In Table 1, we give a comparison to show the advantages of ICEA.
The traditional GA and NN-GA are compared with NN-ICEA. We compare the three algorithms in 10 aspects. From the table, it can be drawn: 1) NN-GA differs from GA in the fitness evaluation approach; 2) NN-ICEA is superior to NN-GA by strengthening the implementation and introducing novel strategies inspired by immune system; 3) NN-ICEA carefully considers the complex problem and tries to take full advantage of expertise evaluation; 4) In NN-ICEA, the probabilities of selection, crossover and mutation, and other many indicators are all determined dynamically, whereas in GA and NN-GA they are predefined statically.
E. Comparison of the design methods in GPD
are employed to design the garment pattern automatically in some extent. For example, the pattern can be designed by the geometry decomposition and composition models [2-4, 41, 42]. The 2D/3D mapping system tries to generate 2D shapes from 3D human model [5]. The rule-based expert system is another way to support utilizing the experience [6, 13]. All of these researches try to generate 2D garment pattern by a mapping to predefined stereotypes. Third, the interactive approaches try to utilize the coordination among designers and consumers [7, 14, 15]. Although the interactive methods are probably not applied to GPD in the literature, some researchers have achieved the success in garment style design. In this study, the optimization model and algorithm are the fourth type of methods in GPD. We attempt to construct the problem of fit garment design as an optimal model and then to solve it by intelligent algorithm.
TABLE I. COMPARISONS AMONG GA,NN-GA AND NN-ICEA
No. Aspect GA NN-GA NN-ICEA
1 Initialization Random Random Parts of the solution
are generated randomly. 2 Fitness
evaluation
Fitness function
NN NN
3 Fitness value Fitness
function
By NN By AffAb Ab∼ and
Ab Ag
Aff ∼
4 Selection Support Support Strengthened by
clonal selection 5 Crossover Fixed
ratio
Fixed ratio
Dynamic by affinity measures 6 Mutation Fixed
ratio Fixed ratio Dynamic by affinity measures 7 Co-evolution Not
support
Not support
By cooperation and competition among
antibodies 8 Elite strategy Keep the
best
Keep the best
Keep the best and eliminate the inferior 9 Population
scale
Static Static Dynamic
10 Crowding strategy
Not support
Not
support Support by AffAb Ab∼
F. Extensions to support general evaluation of garment The studied case in this paper is the two main planes of a piece of regular female pant. In order to make it more practical in industry, the following extensions are possible and realizable. 1) Other types of garments can be supported by building corresponding geometry models. 2) The beauty or other subjective features of garments can be introduced to be optimized as done in this study. 3) The material properties such as electricity and thickness can be considered by introducing adjusting rules of the size values. However, 4) because the color and other stylish features of garments are different from the size-dominated features, they should be modeled independently with different skills. However, a more general system can be built to integrate these features for optimization of garment style, pattern and technical design.
V.CONCLUSION
In this paper, we propose NN-ICEA for GPD optimization. First, the problem of GPD is studied, and the backgrounds including intelligent methods in garment design, hybrid system based on NN and GA, immune computation and co-evolutionary computation are summarized. Second, the framework of NN-ICEA is studied. Two stages including fit prediction based on NN and size optimization based on ICEA are studied in detail. Third, a series of experiments and comparative studies present the promising performance of prediction and optimization of ICEA. It can be concluded that NN-ICEA for GPD optimization aiming at a valuable problem and provides a valid solution that can be used in garment CAD systems.
As for future research directions, the study generates three important points. First, the studied dataset need to be enriched. The current scale is difficult to study all sizes of the garment such as pants. Second, in order to present the fuzzy and stochastic nature of the garment and body sizes, it should be modeled as fuzzy vector or stochastic vector. Third, it is valuable to incorporate NN-ICEA into garment CAD system thus the 2-D and 3-D effects of garments can provide intuitive impressions.
ACKNOWLEDGMENT
This work was supported in part by the high-tech research and development program of China (No. 2007AA04Z105), and Shanghai Municipal Science Commission Local University Capability Project (No. 08170511300).
REFERENCES
[1] Y.-C. Yang, W.-Y. Zhang, and C. Shan, "Investigating the development of digital patterns for customized apparel,"
International Journal of Clothing Science and Technology, vol. 19, pp. 167-177, 2007.
[2] R. Ng, C. K. Chan, T. Y. Pong, and R. Au, "Algebraic modelling of pattern design: the abelian pattern semi-group," International Journal of Clothing Science and Technology, vol. 7, pp. 33-43, 1995.
[3] S. Kim and C. K. Park, "Basic garment pattern generation using geometric modeling method," International Journal of Clothing Science and Technology, vol. 19, pp. 7-17, 2006. [4] T.-H. Koh, E.-W. Lee, and Y.-T. Lee, "An object-oriented model of apparel pattern making," International Journal of Clothing Science and Technology, vol. 9, pp. 367-379, 1997. [5] S. M. Kim and T. J. Kang, "Garment pattern generation from body scan data," Computer-Aided Design, vol. 35, pp. 611-618, 2003.
[6] Y. Liu and Z.-F. Geng, "Three-Dimensional Garment Computer Aided Intelligent Design," Journal of Industrial Textiles, vol. 33, pp. 43-54, 2003.
[7] I. H. Sul and T. J. Kang, "Interactive garment pattern design using virtual scissoring method," International Journal of Clothing Science and Technology, vol. 18, pp. 31-42, 2006. [8] K.-J. Choi and H.-S. Ko, "Research problems in clothing
simulation," Computer-Aided Design, vol. 37, pp. 585-592, 2005.
Journal of Clothing Science and Technology, vol. 20, pp. 161-173, 2008.
[10]R. Ng, "Garment pattern design with artificial neural network and fuzzy logic," presented at International Fashion Culture Festival, Shanghai, 2004.
[11]A. Chen, J. Fan, and W. Yu, "A study of shirt pattern drafting methods, part 1: experimental evaluation of existing methods," Sen-I Gakkaishi, vol. 59, pp. 319-332, 2003.
[12]A. Chen, J. Fan, and W. Yu, "A study of shirt pattern drafting methods, part 2: prediction of shirt patterns using human body anthropometrical data," Sen-I Gakkaishi, vol. 59, pp. 328-333, 2003.
[13]J.-J. Fang and Y. Ding, "Expert-based customized pattern-making automation: Part I. Basic patterns," International Journal of Clothing Science and Technology, vol. 20, pp. 26-40, 2007.
[14]P. Volino, F. Cordier, and N. Magnenat-Thalmann, "From early virtual garment simulation to interactive fashion design," Computer-Aided Design, vol. 37, pp. 593-608, 2005.
[15]C. C. L. Wang, Y. Wang, and M. M. F. Yuen, "Design automation for customized apparel products," Computer-Aided Design, vol. 37, pp. 675-691, 2005.
[16]C. L. Istook, "Enabling mass customization: computer-driven alteration methods," International Journal of Clothing Science and Technology, vol. 14, pp. 61-76, 2002. [17]N. Ötzürk and F. Ötzürk, "Hybrid neural network and
genetic algorithm based machining feature recognition,"
Journal of Intelligent Manufacturing, vol. 15, pp. 287-298, 2004.
[18]S. Salcedo-Sanz, Y. Xu, and X. Yao, "Hybrid meta-heuristics algorithms for task assignment in heterogeneous computing systems," Computers and Operations Research, vol. 33, pp. 820-835, 2006.
[19]S. Salcedo-Sanz and X. Yao, "A hybrid Hopfield network-genetic algorithm approach for the terminal assignment problem.," IEEE Trans Syst Man Cybern B Cybern, vol. 34, pp. 2343-2353, 2004.
[20]S. L. Mok, C. K. Kwong, and W. S. Lau, "A Hybrid Neural Network and Genetic Algorithm Approach to the Determination of Initial Process Parameters for Injection Moulding," Int J Adv Manuf Technol, vol. 18, pp. 404-409, 2001.
[21]R. Pino, J. Parreno, A. Gomez, and P. Priore, "Forecasting next-day price of electricity in the Spanish energy market using artificial neural networks," Engineering Applications of Artificial Intelligence, vol. 21, pp. 53-62, 2008.
[22]B.-R. Chang and H.-F. Tsai, "Forecast approach using neural network adaptation to support vector regression grey model and generalized auto-regressive conditional heteroscedasticity," Expert Systems with Applications, vol. 34, pp. 925-934, 2008.
[23]P. C. L. Hui, K. C. C. Chan, K. W. Yeung, and F. S. F. Ng, "Application of artificial neural networks to the prediction of sewing performance of fabrics," International Journal of Clothing Science and Technology, vol. 19, pp. 291-318 2007.
[24]J. Fan, E. Newton, R. Au, and S. C. F. Chan, "Predicting garment drape with a fuzzy-neural network," Textile Research Journal, vol. 71, pp. 605-608, 2001.
[25]T.-L. Lee, "Back-propagation neural network for the prediction of the short-term storm surge in Taichung harbor, Taiwan," Engineering Applications of Artificial Intelligence, vol. 21, pp. 63-72, 2008.
[26]W.-J. Deng, W.-C. Chen, and W. Pei, "Back-propagation neural network based importance-performance analysis for
determining critical service attributes," Expert Systems with Applications, vol. 34, pp. 1115-1125, 2008.
[27]S.-W. Yu, K.-J. Zhu, and F.-Q. Diao, "A dynamic all parameters adaptive BP neural networks model and its application on oil reservoir prediction," Applied Mathematics and Computation, vol. 195, pp. 66-75, 2008. [28]Y. Kimura and K. Ida, "Improved genetic algorithm for
VLSI floorplan design with non-slicing structure,"
Computers & Industrial Engineering, vol. 50, pp. 528-540, 2006.
[29]J.-T. Tsai, W.-H. Ho, T.-K. Liu, and J.-H. Chou, "Improved immune algorithm for global numerical optimization and job-shop scheduling problems," Applied Mathematics and Computation, vol. 194, pp. 406-424, 2007.
[30]T.-H. Hou, C.-H. Su, and H.-Z. Chang, "Using neural networks and immune algorithms to find the optimal parameters for an IC wire bonding process," Expert Systems with Applications, vol. 34, pp. 427-436, 2008.
[31]R. Agarwal, M. K. Tiwari, and S. K. Mukherjee, "Artificial immune system based approach for solving resource constraint project scheduling problem," International Journal of Advanced Manufacturing Technology, vol. 34, pp. 584-593, 2007.
[32]Z.-H. Zhang, "Immune optimization algorithm for constrained nonlinear multiobjective optimization problems," Applied Soft Computing Journal, vol. 7, pp. 840-857, 2007.
[33]B. Liu, Y.-S. Ding, and D. Ruan, "A reinforcement learning intelligent controller based on primary–secondary response mechanism of immune system," Dynamics of Continuous, Discrete & Impulsive Systems, Series B: Applications & Algorithms, vol. 14, pp. 557-574, 2007.
[34]W.-S. Dong, G.-G. Shi, and L. Zhang, "Immune memory clonal selection algorithms for designing stack filters,"
Neurocomputing, vol. 70, pp. 777-784, 2007.
[35]X.-B. Cao, H. Qiao, and Y.-W. Xu, "Negative selection based immune optimization," Advances in Engineering Software, vol. 38, pp. 649-656, 2007.
[36]F. Freschi and M. Repetto, "VIS: An artificial immune network for multi-objective optimization," Engineering Optimization, vol. 38, pp. 975-996, 2006.
[37]N. Toma, S. Endo, and K. Yamada, "A study of a parallelized immune coevolutionary algorithm for division-of-labor problems," Artificial Life and Robotics, vol. 9, pp. 76-80, 2005.
[38]R. P. Wiegand, "An Analysis of Cooperative Coevolutionary Algorithms, Ph.D. Thesis," vol. Ph.D: George Mason University, 2004.
[39]M. L. Wong, S. Y. Lee, and K. S. Leung, "Data mining of Bayesian networks using cooperative coevolution,"
Decision Support Systems, vol. 38, pp. 451-472, 2004. [40]R. McGill, J. Tukey, and W. Larsen, "Variations of
boxplots," The American Statistician, vol. 32, 1978. [41]M. S. Sontag and J. D. Schlater, "Clothing and Human
Values: A Two-Dimensional Model for Measurement "
Clothing and Textiles Research Journal vol. 13, pp. 1-10 1995.
[42]R. Ng, "Computer modeling for garment pattern design," in
The Hong Kong Polytechnic University, vol. PhD, 1998.