Safety Separation Assessment in Free Flight
Based on Conflict Area
Zhang Zhaoning
(Civil Aviation University of China / College of Air Traffic Management, Tianjin, China) Email:[email protected]
Sun Chang, Zhou Peng
(Civil Aviation University of China / College of Air Traffic Management, Tianjin, China) Email:[email protected], [email protected]
Abstract—Free flight is an effective way to solve the
congestions of air traffic flow. In order to guarantee the flight security, there is great significance to study on collision risk assessment in free flight. This paper applies the idea of collision risk of fixed route based on conflict area for reference, firstly designs a conflict area and establishes the collision risk model in free flight on the basis of it, and then gives the calculation of the parameters in the model. The model considers the influence of communication, navigation and surveillance performance to the probability of overlap and introduces the probability of the failure of controller’s monitoring. The numerical example shows that the model can evaluate the collision risk in free flight effectively.The inverse problem of collision risk model is explored, then the minimum safety separation in free flight is got by simulating, and the advice of reduce the separation is given.
Index Terms—free flight, conflict area, collision risk
I. INTRODUCTION
Under the current air traffic control mode, the flight route of the civil aircraft is set up according to the radio beacon limited by ground-based navigation system. Since these facilities can not be established in any place, the aircraft usually can not choose the most direct route to the destination, so that the utilization of the airspace is not enough and the world's air routes are increasingly congested. To solve this problem, an American named William﹒Hatton proposed the idea of free flight in 1965, whichtransferred the control of aviation from the ground to the sky, so that the pilots can choose their own route to solve the traffic congestion. On October 1995, the U.S. Radio Technical Commission for Aeronautics (RTCA) defined the free flight formally as[1,2]: “…a safe and efficient flight operating capability under instrument flight rules (IFR) in which the operators have the freedom to select their path and speed in real time. Air traffic
restrictions are only imposed to ensure separation, to preclude exceeding airport capacity, to prevent unauthorized flight through Special Use Airspace, and to ensure safety of flight. Restrictions are limited in extent and duration to correct the identified problem. Any activity which removes restrictions represents a move toward free flight.” In order to guarantee the flight security, it is necessary to study the collision risk in free flight environment.
There are many results in the study of collision risk both at home and abroad, divided into non-free flight and free flight. In non-free flight, the best known is the Reich model which was established in the1960s on the analysis of long-range air traffic in the longitudinal, lateral and vertical direction respectively, and the model is mainly applied to the calculation of the relationship between collision risk and the interval[3]. However, the Reich model is not suitable for the collision risk calculation of cross route, so some researchers have proposed the collision risk assessment methods of cross route, and the collision model based on conflict area is established in [4]. In free flight, [5] presented the estimation methods of collision probability in free flight, and used the Monte Carlo method and examples to analyze. [6] used the fault tree analysis method to establish the reduced aircraft separation risk assessment model (RASRAM), the model has a quantified analysis between the relationship of reducing the security interval and collision risk. [7] studied the collision risk assessment model under the route in free flight, and used the Monte Carlo method to simulate. The study of collision risk assessment in free flight in the domestic currently is still in its infancy stage, [8] analyzed the common models in free flight and the application scope, merits and drawbacks of each model, which put forward the tendencies of the research of collision risk assessment in free flight in the future. [9] proposed the effect factors of aircraft positioning error in free flight, and the effect value of each important factor on collision risk was computed respectively.
At present, the collision risk model in free flight is mainly based on ideas of parallel routes, but the flight route is multi-directional in free flight, it is more likely to have cross conflict between two aircraft, so it is more
Based on National Science Foundation “Safety Assessment of Airborne Separation for Free Flight based on Stochastic Differential Equation” (No.71171190)
objective to use the idea of collision risk in cross route. The influence of communication, navigation and surveillance (CNS) performance to the probability of overlap is considered, the probability of the failure of controller’s monitoring is introduced and finally the collision risk model in free flight is established. It has important study significance to guarantee the flight security.
II. ESTABLISHMENT OF COLLISION RISK MODEL BASED ON CONFLICT AREA IN FREE FLIGHT
The model mainly uses the collision risk method of fixed route based on conflict area, which firstly designs a conflict area, secondly establishes the collision risk model in free flight, and then gives the calculation of each parameter in the model.
A. Design of Conflict Area
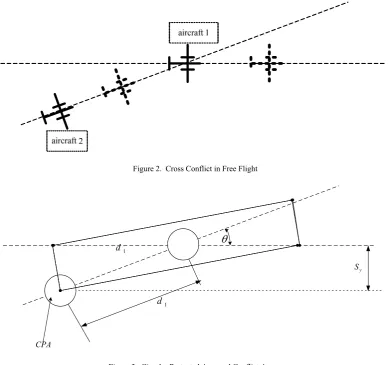
Free flight can not only reduce the flight time of the airlineand reduce fuel consumption, but also obtainmore amount of flight because of the full use of airspace. However, the increase in the number of flight and the multidimensionality of the path of free flight also increase the likelihood of flight conflict, the aircraft in the given airspace may have the cross conflict with the other aircraft, as shown in Figure 2.
In the fixed cross route, a conflict area around the route intersection is set, the controller guarantees the flight security by means of control that makes sure two planes not appear simultaneously in the same region. In order to establish the collision risk model based on conflict area, we must first understand three basic concepts: critical volume of collision, circular protected area (CPA) and conflict area [4].
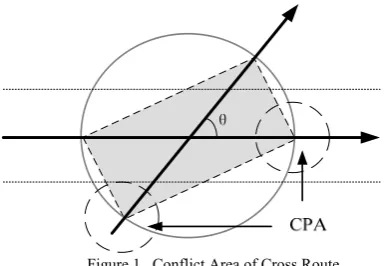
Critical volume of collision is a cylinder that its radius is the sum of the radius of the two planes and its height is the half of the sum of the height of the two planes; circular protected area uses the lateral separation standard to determine the lateral separation point and draws the circle with the radius of the distance between the lateral separation point and the route intersection; the rectangular area determined by the circle and the intersection of two intersecting routes is the conflict area, as the shadow shown in Figure 1.
Figure 1. Conflict Area of Cross Route
As the free flight environment is not related to the specific route, so design a similar conflict area refer to cross route, as shown in Figure 3. Where, d1 denotes the
distance between the intersection and the lateral separation point, Sy denotes the minimum of lateral separation, θ denotes the angle of the cross conflict. B. Establishment of Collision Risk Model
In order to establish the collision risk model in free flight, the following principal assumptions are made: 1) the location of the aircraft is independent mutually; 2) the effect of the weather or other factors is not considered; 3) the horizontal and vertical position of the aircraft is independent mutually; 4) the two conflict aircraft are of the same kind, the case of adjacent planes is considered; 5) the controllers only monitor the aircraft in free flight, not implement control before the short term conflict alert alarms.
The two aircraft in the conflict area at the same time have the collision risk, the model studies two cases by the method of weight: the controller operates normally and fails to monitor. The calculation of collision risk is as follow:
{
}
2
(1
)
CR
VOP NP
HCP
NHCP
α
α
= ×
×
×
−
×
+ ×
(1)Here, CR denotes the collision risk, with the number of fatal accidents per flight hour to represent; VOP denotes the probability of the vertical overlap in the same flight level; NP denotes the average number of aircraft passed the intersection per flight hour; αdenotes the proportion of the planes through intersection to all the planes through the intersection in case of the failure of controller’s monitoring; HCP denotes the probability of horizontal overlap in case of controller’s monitoring; NHCP denotes the probability of horizontal overlap in case of the failure of controller’s monitoring.
According to some reference data [10], the probability of the failure of controller’s monitoring is very small, the probability of horizontal overlap in case of failure is also small, so α×NHCP is relatively much smaller than others and can be ignored. Thus the assessment model can be further approximately simplified as follow:
(
)
2 1
CR= ×VOP NP× × −
α
×HCP (2) Here, NP can be obtained from the flight data, the calculation of VOP, HCP and αwill be analyzed in the following.1) Calculation of the probability of vertical overlap Most of the collision risk models mainly consider the influence of navigation performance to collision risk, a few consider the influence of communication and surveillance performance. In free flight environment, we gradually get out of specific equipment requirements of CNS, but give requirements from its performance which can be achieved. Here, from the positioning error the plane caused by CNS performance when flying, the probability of vertical overlap under the specified intervals is calculated.
Figure 2. Cross Conflict in Free Flight
θ
CPA
1
d
1
d
y
S
Figure 3. Circular Protected Area and Conflict Area
that in free flight the position error of vertical direction caused by CNS performance meets the normal distribution of N(0,σ2). Further assume that aircraft position errors respectively caused by CNS are independent mutually and all meet the normal distribution: NC(0, σC2), NN(0, σN2), NS(0, σS2). So it is easy to deduce:
2 2 2 2
C N S
σ
=
σ
+
σ
+
σ
(3) The probability density function of flight vertical collision risk can be expressed as follow:2
2
1
(z)
exp
2
2
z
f
σ
πσ
⎛
⎞
=
⎜
−
⎟
⎝
⎠
(4)Now only consider the yaw caused by CNS performance environment, assumed that the deviation to the above of expected route is positive, the below to be negative. Suppose that the flight time of the aircraft flying in free flight airspace is T, and T is evenly divided into n, n=T/t. The vertical deviation distance of the aircraft caused by CNS performance z in every t period meets z~(0, σ2). z
i1, zi2 respectively denotes the vertical deviation distance of the first and the second aircraft in the i th(i=1,2,…,n) t period, the total vertical deviation distance in flight time T can be expressed as
1 1
1
2 2
1 n
i i
n
i i
Z
z
Z
z
=
=
=
=
∑
∑
(5) Thus the vertical distance Z between the two aircraft in flight time T is Z=d+Z1-Z2, among which d denotes the initial vertical distance between the two aircraft.Because Z1~N1(0, nσ2), Z2~N2(0, nσ2), the following formulas can be deduced:
2
1 2
2
~
(0, 2
)
( , 2
)
Z
d Z
Z
d N
n
N d n
σ
σ
= +
−
+
=
(6)The formula (4) shows that the probability density function of vertical distance between aircraft is as follow:
(
)
22
1
( )
exp
4
2
z d
f z
n
n
πσ
σ
⎡
−
⎤
=
⎢
−
⎥
⎢
⎥
⎣
⎦
(7)
(
)
z 2 2( )
1
exp
4
2
z z z z S S S SP
f z dz
z d
dz
n
n
πσ
σ
− −
=
⎡
−
⎤
=
⎢
−
⎥
⎢
⎥
⎣
⎦
∫
∫
(8)where Sz denotes the given vertical separation between the two aircraft in free flight.
In 1994, the required navigation performance (RNP) in ICAO RNP Manual[12] is defined as: when the aircraft operates in a certain route, airspace or area, RNP is determined by the value to achieve the expected navigation performance accuracy at least 95% of flight time. The definition of required communication performance (RCP) and required surveillance performance (RSP) is similar. Since under the required security interval, the vertical yaw error caused respectively by CNS performance, once the CNS performance environment is determined, it is necessary to ensure that 95% of flight time is in the specified accuracy.
Assume that CNS performance in free flight is RNP n1, RCP n2, RSP n3, and then the following relationship is obtained[13] :
1 1 2 2 3 3 2 2 2 2 2 2
1
z
exp
d
0.95
2
2
1
z
exp
d
0.95
2
2
1
z
exp
d
0.95
2
2
n n n n n V n V c c n V n V s sz
z
z
σ
πσ
σ
πσ
σ
πσ
− − −−
=
−
=
−
=
∫
∫
∫
(
)
(
)
(
)
(9)σn, σc, σsrespectively denotes the variance component of deviation distance caused by navigation, communication and surveillance performance in the vertical direction, V denotes the vertical speed of the two aircraft in free flight.
We can deduce that:
1 2 3
0.5102
0.5102
0.5102
n c sn
n V
n V
σ
σ
σ
=
=
=
(10)So the standard deviation σ of the vertical deviation distance in free flight can be expressed as follow:
2 2 2 2
2 2 2 2 2
1 2 3
0.2063(
)
n c s
n
n V
n V
σ
=
σ
+
σ
+
σ
=
+
+
(11)That is
2 2 2 2 2
1 2 3
0.2063(
n
n V
n V
)
σ
=
+
+
(12)Put(12)into(8),we can deduce that
(
)
z
2 2 2 2 2
1 2 3
2
2 2 2 2 2
1 2 3
( )
1
2
0.2063(
)
exp
4
0.2063(
)
z z z z S S S S
P
f z dz
n
n
n V
n V
z d
dz
n
n
n V
n V
π
− −=
+
+
⎡
−
⎤
×
⎢
−
⎥
×
+
+
⎢
⎥
⎣
⎦
∫
∫
(13)
The result of Pz is VOP.
2) Calculation of the probability of horizontal overlap in case of controller’s monitoring
There are already some literatures to calculate the probability of horizontal overlap in the domestic[14], here we use the idea to deduce the probability of horizontal overlap in case of controller’s monitoring.
Rmin denotes the actual distance of the two aircraft in the nearest point, Rcol denotes the size of the aircraft fuselage, then
(
min col)
HCP P R
=
<
R
(14)Where
R
mint VV
0 1 2sin
V
θ
=
Δ
.
Because
x
0x
0ε
∧=
+
,x
0=
V t
2 0,so0 1
min
(
x
) sin
V
R
V
ε
θ
∧−
=
Δ
(15)Then we can deduce that
0 0 0 0 1 min 1
(
) sin
(
)
=
(
)
sin
=
(
)
=
(
)
col col col col col colx
V
HCP P R
R
P
R
V
V
P
x
R
V
P
x
A R
P
A R
x
A R
ε
θ
ε
θ
ε
ε
∧ ∧ ∧ ∧⎛
−
⎞
⎜
⎟
=
<
=
<
⎜
Δ
⎟
⎝
⎠
⎛
−
<
Δ
⎞
⎜
⎟
⎜
⎟
⎝
⎠
⎛
−
< ×
⎞
⎜
⎟
⎝
⎠
⎛
− ×
<
−
< ×
⎞
⎜
⎟
⎝
⎠
(16)
Where, A=|△V/V1sinθ|, V1 denotes the speed of the first aircraft, △V denotes the vector of V1-V2, θdenotes the angle between the two cross aircraft.
So the probability of horizontal overlap of the aircraft in case of controller’s monitoring on the cross route is
( )
0 0 0 0 ˆ ˆˆ
ˆ
HCP
col( )g
d
col x x A R
x x A R
f
ε
x d x
ε
+ ⋅
− − ⋅
∫ ∫
=
(17)Where,
0
ˆ
x
denotes the estimated distance between aircraft 2 and the intersection when aircraft 1 is located in the intersection, εdenotes the error of0
ˆ
①Calculation of probability density function
g x
( )
ˆ
0 Because the two aircraft can not appear in the conflict area at the same time, so0
ˆ
x
should meet0 1
ˆ
2
x
≥
d
. Where d1 denotes the distance between the intersection and the lateral separation point, it is calculated as follow:1
sin
60 180
180
60
arcsin
sin
180
y
S
d
π
πθ
π
⎡
⎛
⎞
⎤
⎢
⎜
×
⎟
⎥
⎝
⎠
⎢
⎥
=
×
×
⎢
⎛
⎞
⎥
⎜
⎟
⎢
⎝
⎠
⎥
⎣
⎦
(18)
Sy denotes the minimum of given lateral separation in free flight.
To simplify the calculations, assumed that
0
ˆ
x
meets the uniform distribution between (2d1,2d1+D), D is a constant, then( )
01 1
1
, 2
2
ˆ
0,
d
x
d
D
g x
D
others
⎧
< <
+
⎪
= ⎨
⎪⎩
(19)According to the relative data in non-free flight, D=250,then
( )
01 1
1
, 2
2
250
ˆ
250
0,
d
x
d
g x
others
⎧
< <
+
⎪
= ⎨
⎪⎩
(20)②Calculation of probability density function f(ε)
Because the probability of collision is usually small and heavily depends on the tail of the distribution ε, so assumed that εmeets the double exponential distribution:
( )
1
2
f
e
ε λ
ε
λ
−
=
(21) We can deduce that1 0
0
1 0
ˆ 2 250
ˆ 2
1
d
ˆ
500
col
col
d x A R
d x A R
HCP
e d
x
ε
λ
ε
λ
− + + ⋅
− ⋅
⋅
∫
∫
1
=
(22)Calculate it by integral, the result is as follow:
exp exp
500
2 2 250
1 1
exp exp
AR AR
col col
HCP
d d
λ
λ
λ
λ
λ
− −
+
× − − −
⎡
⎛
⎞
⎛
⎞
⎤
⎜
⎟
⎜
⎟
⎢
⎜
⎟
⎜
⎟
⎥
⎢
⎝
⎠
⎝
⎠
⎥
⎣
⎦
⎡
⎛
⎞
⎛
⎞
⎤
⎜
⎟
⎜
⎟
⎢
⎜
⎟
⎜
⎟
⎥
⎢
⎝
⎠
⎝
⎠
⎥
⎣
⎦
=
(23)
Where, λ=RNP/2.996, calculated by the required navigation performance in free flight.
3) Calculation of the probability in case of the failure of controller’s monitoring
The large domestic transport aircraft is fitted with airborne collision avoidance system, which effectively prevents the air collision accidents. In free flight environment, the presence of collision avoidance system is essential, and much more important and dependent than non-free flight. The collision avoidance system includes two kinds: ground collision avoidance system ——Short Term Conflict Alert (STCA) and airborne collision
avoidance system——Traffic alert and Collision Avoidance System / Airborne Collision Avoidance System (TCAS / ACAS). The former is for controllers, which sends an alarm message to the controller before flight interval is less than the standard interval, the controller takes appropriate measures to make the aircraft return to the normal safe interval; if the control intervention fails, the interval continues to reduce, until the TCAS triggers an alarm message to the pilot, and provides the appropriate Traffic Advisory (TA) and Resolution Advisory (RA). Since in free flight, the controllers only implement monitoring to the aircraft, not control before the ground collision avoidance system alerts, so we assume that the probability of the failure of controller’s monitoring is equivalent to the failure probability of ground collision avoidance system. The flow of the aircraft within a certain time meets uniform distribution, so in case of the failure of monitor, the proportion of the planes through intersection to all the planes through the intersection can be calculated as the failure probability of ground collision avoidance system.
[10] calculated the failure probability of TCAS and STCA by Fault Tree Analysis (FTA) and analyzed the system reliability successfully. The fault tree also takes human factors and CNS performance into account, responses the free flight environment comprehensively.
FTA is one of the primary analysis methods in safety engineering system. In the design of the system, FTA analyzes a variety of factors (including hardware, software, environment, human factors ) that may result in system failure, draws logic diagram (ie, fault tree), and then determines the possible combinations or probability of occurrence that make the system failure. People can take appropriate measures to improve the reliability of the system.The basic principle of STCA is: if the system determines the current interval of the two aircraft is less than the separation standard, the system considers that the two aircraft have a conflict, then it issues a warning signal to the controller; if the system determines the two aircraft has a probability of dangerous approach according to the current position,but not yet have a conflict, the system considers that the two aircraft have a potential conflict, then it issues a early warning signal to the controller.
According to the working principle of FTA and STCA, assume “S” as the top event, which means the failure of the STCA system, use Ai(i=1,2,3) as the middle events,
Figure 4 The Fault Tree of the Failure of the STCA System
The specific event and the probability of the occurrence of each event is shown in Table I.
TABLE I
NAMEOFTHEEVENTANDTHEPROBABILITYOFEACH EVENT
SYMBOL EVENT PROBABILITY
1
A the pilots don’t take the conflict disentangle
strategies
) ( )
(X1 P X2
P +
2
A the pilots take the conflict disentangle strategies
falsely
) ( )
(X3 P A3
P +
3
A the pilots misunderstand the conflict disentangle
strategies
) ( ) (X4 P X5
P ⋅
1
X the response of the ground
workers delay 3.0×10 -3
2
X failure of the
communication 1.0×10⁻⁷
3
X the ground workers take
the strategies falsely 4.0×10⁻⁴
4
X the pilots understand the conflict disentangle
strategies falsely
4.0×10⁻⁴ 5
X the ground workers don’t
correct timely 2.0×10 -1
According to Figure 3, use the basic knowledge of FTA, we can get the probability of occurrence of the top event is:
1 2
1 2 3 3
1 2 3 4 5
( )
( )
( )
(
)
(
)
(
)
( )
(
)
(
)
(
)
(
)
(
)
P S
P A
P A
P X
P X
P X
P A
P X
P X
P X
P X
P X
=
+
=
+
+
+
=
+
+
+
⋅
(24)
According to the probability of each event shown in Table 1, by the formula (24) we can calculate that the failure probability of the ground collision avoidance system is p=p(S)=3.48×10⁻³,it can be served as α, that is
α=3.48×10⁻³.
III. NUMERICAL EXAMPLE
However, free flight is still in the design and experiment stage now, this paper uses a part of Shanghai control area as a collision risk assessment area in free flight. Select the free flight area including routes G204 and A470, and the aircraft type is B747-400. Here, we fix the CNS performance environment of the plane (RNP1, RCP400, RSP2), the average number of aircraft passed the intersection per flight hour is 15. The reference data is shown in Table II.
TABLEII
RELATIVE PARAMETER VALUE IN FREE FLIGHT (UNIT: NMILE, KT) PARAMETER
n
n
1n
2n
3VALUE 30 1 400 2
PARAMETER
V
d
S
zS
yVALUE 2.5 0.165 0.28 1.62 PARAMETER
R
colV
1θ
α
VALUE 0.038 495 88 3.48
×
10-3Calculate the probability of vertical overlap VOP according to (13), calculate the probability of horizontal overlap HCP according to (23), then put α=3.48×10⁻³,
NP=15 into (2), we can get that CR=6.37×10⁻⁹ times/ per flight hour.
The evaluate result shows that the collision risk under the given conditions is 6.37×10⁻⁹ times / per flight hour, meets the safety level of 1.5×10⁻⁸ times / per flight hour set by ICAO. It shows that the collision risk assessment model in free flight can be successfully used to estimate collision risk, and demonstrates that the assessment model is feasible.
IV. CALCULATION OF THE MINIMUM SAFETY SEPARATION
A. the Improved Model of Safety Separation in Free Flight
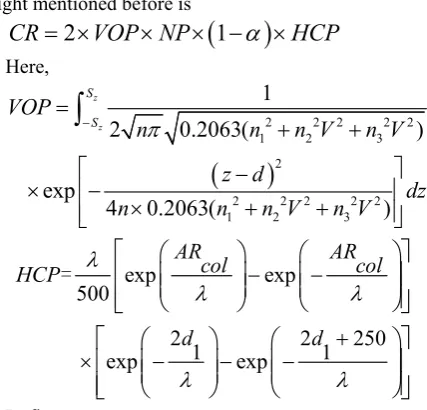
The collision risk model based on conflict area in free flight mentioned before is
(
)
2
1
CR
= ×
VOP NP
×
× −
α
×
HCP
Here,
(
)
2 2 2 2 2
1 2 3
2
2 2 2 2 2
1 2 3
1
2
0.2063(
)
exp
4
0.2063(
)
z
z
S S
VOP
n
n
n V
n V
z d
dz
n
n
n V
n V
π
−
=
+
+
⎡
−
⎤
×
⎢
−
⎥
×
+
+
⎢
⎥
⎣
⎦
∫
exp exp
500
2 2 250
1 1
exp exp
AR AR
col col
HCP
d d
λ
λ
λ
λ
λ
− −
+
× − − −
⎡
⎛
⎞
⎛
⎞
⎤
⎜
⎟
⎜
⎟
⎢
⎜
⎟
⎜
⎟
⎥
⎢
⎝
⎠
⎝
⎠
⎥
⎣
⎦
⎡
⎛
⎞
⎛
⎞
⎤
⎜
⎟
⎜
⎟
⎢
⎜
⎟
⎜
⎟
⎥
⎢
⎝
⎠
⎝
⎠
⎥
⎣
⎦
=
(
)
2 1 exp exp
500
col col
AR AR
T NP α λ
λ λ
⎡ ⎛ ⎞ ⎛ ⎞⎤ × × − × ⎢ ⎜ ⎟− ⎜− ⎟⎥ ⎝ ⎠ ⎝ ⎠
⎣ ⎦
=
2 2 2 2 2
1 2 3
1
2
0.2063(
)
z
z S
S
n
π
n
n V
n V
−
×
+
+
∫
(
)
22 2 2 2 2
1 2 3
exp
4
0.2063(
)
z d
dz
n
n
n V
n V
⎡
−
⎤
×
⎢
−
⎥
×
+
+
⎢
⎥
⎣
⎦
Then
1 1
2
2
250
exp
d
exp
d
CR T
λ
λ
⎡
⎛
⎞
⎛
+
⎞
⎤
= ×
⎢
⎜
−
⎟
−
⎜
−
⎟
⎥
⎝
⎠
⎝
⎠
⎣
⎦
(25)Define the given safety level as PGiven,
Given
P
=
CR
(26) We can get the improved model of safety separation in free flight is1 1
2
2
250
exp
d
exp
d
P
GivenT
λ
λ
⎡
⎛
−
⎞
−
⎛
−
+
⎞
⎤
=
⎜
⎟
⎜
⎟
⎢
⎝
⎠
⎝
⎠
⎥
⎣
⎦
(27)When the other conditions are known, for a given safety level PGiven, the safety separation d1 in free flight can be calculated by relevant algorithm and formula (27). B. Algorithm
Since formula (27) is a complex exponential equation which is non-linear, we can’t get the answer directly but by the iterative algorithm.
Iterative algorithm is a basic method to solve the problem by computer, which can use the characteristics of computers that includes the fast computing speed and suitable for repetitive operation. It allows the computer to repeat a set of instructions, in each execution of this instruction, a new value can be induced from its original value of the variable.
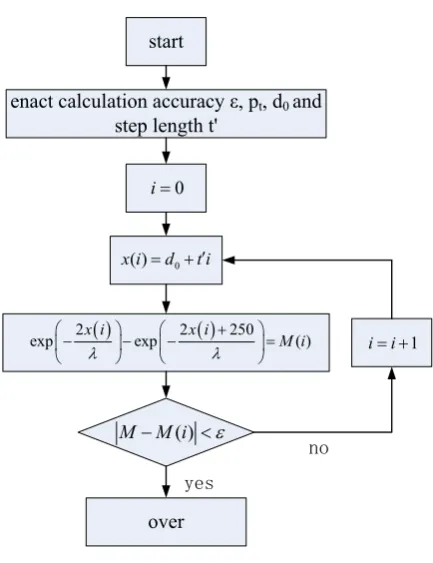
Here, in order to calculate the safety separation d1, we use the equal step iterative algorithm. Take the lateral separation of parallel route as the lateral separation in free flight and implement the algorithm based on the initial value. The flow chart of algorithm is shown in Figure 5. Where,ε denotes the accuracy of control, pt denotes the safety level, d0 denotes the initial value of the exponential equation, t’ denotes the step length.
start
enact calculation accuracy ε, pt, d0 and step length t'
over
0 ( )
x i =d +t i′ 0
i=
( ) ( )
2 2 250
exp x i exp x i M i( )
λ λ
+
⎛− ⎞− ⎛− ⎞=
⎜ ⎟ ⎜ ⎟
⎝ ⎠ ⎝ ⎠
( )
M M i− <ε
1
i i= +
yes
no
Figure 5 The Flow Chart of Algorithm
Consider the calculation of x(i) as d1 that meets the exponential equation, then the minimum safety separation in free flight can be obtained from this.
C. Result and Analysis
Use MATLAB to simulate, the specific values are the same as the numerical example below, the simulation result is shown in Table III.
TABLE III SIMULATION RESULT
The simulation result shows that: in a given safety level, the safety separation in free flight calculated by equal step iterative algorithm is 14.6n mile. From the relevant provisions of flight separation, the minimum separation standard of aircraft on the cross route is the distance measured by the distance measure equipment with the longitudinal separation of 40km, which requires the two aircraft fly on the same flight level and the crossing angle is less than 90°. The simulation result is smaller than the required standard of flight separation on the fixed route, it is because that the required accuracy in free flight is larger than traditional fixed route flight, the model and algorithm presented in this paper is based on CNS performance of Next Generation Civil Aviation Transportation System (NGCATS). It shows that in the case of ensuring the safety level set by ICAO and
parameters simulation result
ε pt t’ d1/n mile
meeting the required CNS performance, the safety separation in free flight can be appropriately reduced.
V. CONCLUSION
This paper presents a preliminary study on collision risk model in free flight. We have applied the idea of collision risk of fixed route based on conflict area for reference, by considering the influence of CNS performance to the probability of overlap and introduce the probability of the failure of controller’s monitoring and at last established the collision risk model in free flight. The numerical example shows that the model can evaluate the collision risk in free flight effectively. The inverse problem of collision risk model is explored, then the minimum safety separation in free flight is got by simulating, and the advice of reduce the separation is given. But the probability of horizontal overlap in case of the failure of controller’s monitoring is not considered in the model, which is a future research direction.
REFERENCES
[1] Final Report of RTCA Task Force 3-Free Flight Implementation[R]. Washington DC: RTCA Inc,1995. [2] Special Report on Free Flight[R].Aviation Week and Space
Technology, 1995.
[3] Reich.P.G. Analysis of long-range air traffic systems: separation standards I II III [J]. Journal of the Institute of Navigation. 1966, 19(1):88-98, 1966, 19(2)169-186, 1966, 19(3):331-347.
[4] Anderson D, Lin X G.Collision risk model for a crossing track separation methodology [J].Journal of Navigation, 1996, 49(3):337-349.
[5] Paielli, R. A, Erzberger, H. Conflict probability estimation for free flight[R].NASA Ames Research Center, Moffett Field, CA: NAS 1.15:110411; A-962310 ,1996.
[6] Cassell Rick, Smith Alex, Shepherd Roger. Risk assessment model for free flight - terminal area reduced separation[C].//Proceedings of the 1996 15th AIAA/IEEE Digital Avionics Systems Conference, Atlanta: Piscataway, 1996: 73-80.
[7] Everdij, Mariken H.C., Blom, Henk A.P., Bakker, Bert G.J. Modelling lateral spacing and separation for airborne separation assurance using Petri nets [J]. Journal of Simulation, 2007, 83(5):401-414.
[8] Lu Tingting, Zhang Zhaoning, Liu jimin. Study on Safety Aassessment of Free Flight Collision Risk[J]. Aeronautical Computing Technique, 2010,40(6):25-29. [9] Cai Ming, Zhang Zhaoning, Wang Lili. Research on
Collision Risk in Free Flight[J]. Aeronautical Computing Technique,2011,41(1):51-56.
[10]Sui Dong. New method for safety assessment of parallel routes[J].Transactions of Nanjing University of Aeronautics &Astronautics, 2009,26(1):36-43.
[11]Geert Moek, Edward Lutz, William Mosberg.Risk Assessment of RNP 10 and RVSM in the South Atlantic Flight Identification Regions [R]. Annapolis: ARINC, 2001.
[12]Doc 9613-AN/937, Manual on Required Navigation Performance[S].ICAO, Second Edition, 1999.
[13]Zhang Zhaoning, Wang Lili, Li Dongbin. Introduction to Security Assessment on Airborne Separation[M].Science Press, Beijing, 2009.
[14]Zhang Zhaoning, Zhang Xiaoyan. Research and Application on Collision Risk of Crossing Tracks. Aeronautical Computing Technique, 2007,37(2):1-4. Zhang Zhaoning was born in Hebei Province in China on July 1964. He received the BS, MS and Ph.D degrees from Hebei Normal University, Nankai University and Tianjin University respectively. He is now a professor of College of Air Traffic Management in Civil Aviation University of China . His current research interests include air traffic plan and management, traffic information engineering and control, signal and information processing.