Performance Analysis of Some New
CFAR Detectors under Clutter
Long Cai
Institute of Acoustics, Chinese Academy of Sciences, Beijing, China Email: [email protected]
Xiaochuan Ma, Qi Xu, Bin Li, and Shiwei Ren
Institute of Acoustics, Chinese Academy of Sciences, Beijing, China Email: {floralway, libinee, rswbit}@163.com
Abstract—In order to improve the radar’s detection
performance under Pearson distributed background clutter, the problem of designing CFAR detectors is studied in this paper. Three kinds of distributed fuzzy CA scheme and two kinds of OS scheme are proposed. The numerical simulations prove that CA CFAR detector based on algebraic sum fusion rule provides more robust detection performance in homogenous background clutter, CASO based on algebraic-sum rule shows detection improvement in multi-target environment, CAGO based on MIN rule provides better false-alarm-control capacity under clutter-edge condition, and OSSO CFAR offers better detection performance than OS CFAR in multiple interrupt-target situation.
Index Terms—radar network, detection, CFAR, fuzzy,
CAGO, CASO, OS
I. INTRODUCTION
Constant false alarm rate (CFAR) technique plays an important role in radar network signal processing. CA CFAR detector is a classical scheme, in which the decision threshold is computed adaptively on the assumption that the background noise amplitude samples are independent identically distributed random variables. CA CFAR is optimum in homogeneous noise or clutter[1], unfortunately, it suffers performance degradation in multiple-target or non-homogeneous environment. In order to alleviate this problem, Rohling[2] modified the common CA CFAR technique by replacing the arithmetic averaging estimator of clutter power with a new data fusion rule based on order statistics method, which is called as OS CFAR detector. Similar information fusion works included CAGO[3], CASO[4], CMLD[5] , TM[6],etc.
CFAR detectors should consider the clutter model when deciding decision threshold and expressing false alarm rate. Conventional CFAR detector treats the background clutter as Gaussian model. Nowadays, heavy-tailed distribution especially Pearson distribution has been proved to be more appropriate to model actual data such as impulsive signal[7], sea clutter[8] and active sonar returns[9]. It has been proved that CA, CAGO/CASO, OS detectors still maintain constant false alarm rate under homogeneous Pearson distributed clutter[10-11].
Traditional statistical detection technique treats observations as random variables and determines the most probable choice between ‘signal presence’ and ‘signal absence’. However, these quantized functions result in incomplete information. Fuzzy logic detection is a new choice, where the decision is not restricted to the presence or absence of a signal. Some work dealing with fuzzy CFAR detection has been reported in literature
[12-14]
.
In this paper, we propose three new detection network systems adopting fuzzy CA, CAGO, and CASO schemes, and develop two kinds of new information fusion technique called OSGO and OSSO based on OS under Pearson distributed background clutter. The work is organized as follows. In section II, we introduce Pearson distribution and some classical detectors under such clutter, in section III, we derive the mathematic model of fuzzy CA/CAGO/CASO-CFAR detectors, in section IV, four kinds of fusion rules used in radar network system are introduced, in section V, we introduce OSGO and OSSO schemes, some simulation results are presented in Section VI. Section VII is the conclusion.
II. PEARSON DISTRIBUTION AND DETECTORS A. Pearson Distribution
Pearson distribution is a kind of symmetrical alpha-stable distribution when the character parameter
α
equals to 1/2. If a variable follows Pearson distribution, the probability density function is[15, p.10]:
2
3 / 2 2
( ) ( 2 )(1 / )
X
x
p x = γ π x e−γ (1) The cumulative density function is:
(
)
2 1 ( ) , 0
( )
{
}
X r X x
P x
=P
≤ = −φγ
x
x
≥ (2)here γ is the scale parameter which reflects the clutter power level, φ( )x denotes the cumulative density function of the standard Gaussian distribution N(0,1):
2
( )x 1 2 x exp(-y / 2)dy
φ π
−∞
so Pearson distribution belongs to single parameter distribution, it means the scale parameter could be estimated by common methods such as CA, OS, CAGO/CASO.
B. CA/CAGO/CASO CFAR Detectors
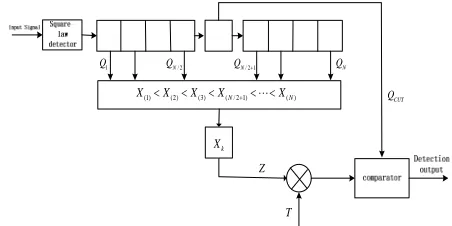
The structure of CA-CFAR detector is depicted in Fig. 1,where qCUTis the output of the cell under test (CUT), others are output of reference sliding cells, N is the length of reference window, T is the threshold parameter to achieve a certainPfa for a given window of size N. z
is the estimation of the power level of background clutter, which must be adaptive to the change of clutter power level. Various CFAR systems are distinguished by the way this threshold is obtained. The adaptivedecision rule
is 1
0
H
CUT H
q ><Tz, whereH1denote target presence, H0denote target absence. In our study, zis the mean of Nvariables following Pearson distribution, so
z
also follow the Pearson distribution with the scale parameter equaling toN
γ [9]
, the probability density function of z is
3 / 2
2/ 2
1 ( )
2 Z
N z N
f z
z
e
γγ π
−
= (4)
then Pfaof the CA-CFAR is:
0 0
Pr( ) ( ) ( )
CA
fa CUT Z Tz X
P = q >Tz H =
∫
∞ f z∫
∞p x dxdz(
)
23 / 2 0
/ 2
1
2 / 1
2
N z
N
Tz e dz
z
γ γ
γ
π
∞ −
=
∫
⎡
⎣
Φ −⎤
⎦
(5)let y=γ / x
,
2
0
2
( ) x t
Erf x e dt
π
−
=
∫
,
Pfa can beexpressed as
(
)
20
/ 2
2
/ 2
CA fa
N z
N
P Erf y T e γ dy
π
∞ −
=
∫
(6)by (6), we can see that CA is also a CFAR method for Pearson background. We have
2
0
1
( ) px arctan c
Erf bx e dx
p p
π
∞ −
=
⎛
⎜
⎞
⎟
⎝
⎠
∫
(7)by using (7) in (6),we could get the exact elementary expression of Pfa:
2 1
arctan CA
fa
P
TN
π
=
⎛
⎜
⎞
⎟
⎝
⎠
(8)by (8), we could easily get the threshold parameter under given Pfa and N.
CUT
q
1
1 N i i
z
N =q
= ∑
/ 2
N
q
1
q qN/ 2+1 qN
T
Figure 1. Block diagram of CA-CFAR detector
Fig. 2 is the model of CAGO and CASO CFAR detectors. Ignoring the similar mathematical analysis above, here we just give the results. The false alarm rate of CAGO and CASO detector is:
2
0
/ 4
2
2 2
GO Ny
fa
N y y N
Erf Erfc dy
T
P e
π
∞ −
= ⎛⎜ ⎞⎟ ⎛⎜ ⎞⎟
⎝ ⎠ ⎝ ⎠
∫
(9)2
0
/ 4
2
2 2
SO Ny
fa
N y y N
Erf Erf dy
T
P e
π
∞ −
=
⎛
⎜
⎞
⎟
⎛
⎜
⎞
⎟
⎝
⎠
⎝
⎠
∫
(10)according to [16], we have
4 1 1
arctan arctan
/ 2 1
GO fa
TN TN
P
π
= −
+
⎛ ⎛ ⎞ ⎛ ⎞⎞
⎜ ⎜ ⎟ ⎜ ⎟⎟
⎝ ⎝ ⎠ ⎝ ⎠⎠ (11)
4arctan 1
1 SO
fa
NT
P
π +
=
⎛
⎜
⎞
⎟
⎝
⎠
(12)CUT Q
: ( , )
: ( , )
GO Z Max U V SO Z Min U V
= =
/ 2 1
2N i i
Q
N∑= / 2 1
2 N i i N
Q
N=∑+
/ 2 N Q
1
Q QN/ 2 1+ QN
U V
Z
T
Figure2. Model of CAGO/CASO detector C. OS CFAR Detectors
The procedure that takes place in an OS CFAR system is shown in Fig. 3.
CUT
Q
/ 2
N
Q
1
Q QN/ 2 1+ QN
Z
T
(1) (2) (3) ( / 2 1)N ( )N
X <X <X <X + < <" X
k
X
Figure 3.Model of OS detector
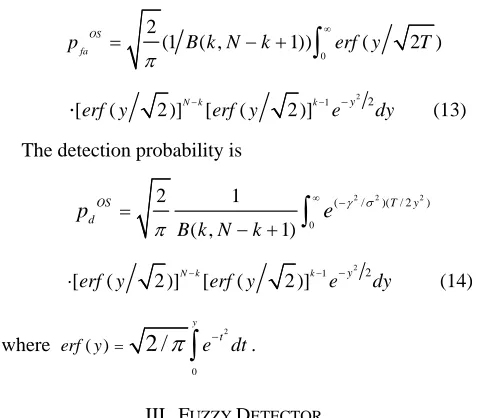
0
2
(1 ( , 1)) ( 2 )
OS fa
p B k N k erf y T
π
∞
= − +
∫
2
1 2
[erf y( 2 )]N k− [erf y( 2 )]k− e−y dy
⋅
(13)The detection probability is
2 2 2
0
( / )( / 2 )
2 1
( , 1)
OS T y
d
B k N k
p e γ σ
π
∞ −
=
− +
∫
2
1 2
[erf y( 2 )]N k− [erf y( 2 )]k− e−y dy
⋅ (14)
where
2
0
( )
2 /
y t
erf y =
π
∫
e− dt.III. FUZZY DETECTOR
In the fuzzy detector proposed in [13], the membership function
w
is defined so that it maps theobservation space to a value between 0 and 1 indicating the degree to which the test is indicative to the hypothesis ‘no signal’ and ‘signal’. The membership function corresponding to the false alarm space was defined as
w y( )=Pr(Z > y Z∈N(0,σ2)) (15) here
y
is the observation. The membership function monotonically decreases ensuring that stronger observations are assigned smaller membership to the ‘no target’ hypothesis. If w y( )<Pfa, the detector declares atarget present. In our case, the clutter power level is unknown, so the threshold should be adaptive. We define the membership function as
(
0)
( ) Pr | 1 X( )
w x = X >x H = −F x (16)
where x=qCUT /z,qCUT is the output of cell under test,
z
is the estimate of background clutter power level, Xis a variable defined as X =QCUT /Z, here QCUT and Zdenote the variables corresponding to qCUT and
z
, and( )
X
F x is the cumulative density function of X, so w x( )
monotonically decreases with
x
. If w x( )is smaller than the decision threshold, we declares a target present. It is worth noting that the random variable formed by applying the cumulative distribution function to any continuous random variable is uniformly distributed on [0,1] , therefore the distribution of the membership function w x( ) is uniformly distributed on [0,1], comparing (10) to (5), we could get the membership function of fuzzy CFAR by changing Tin (8) tox
. As to CA-CFAR under Pearson distributed background clutter, we have2 1
( ) arctan w x
xN
π
=
⎛
⎜
⎞
⎟
⎝
⎠
(17)The structure of the fuzzy CA-CFAR under Pearson distributed background clutter is depicted in Fig. 4.
/ 2
N q
1
q
/ 2 1
N
q + qN
2 1
( ) arctan
w x
xN
π
⎛ ⎞
= ⎜ ⎟
⎝ ⎠
1 1
CUT N i i
q x
q
N =
=
∑
CUT
q
Figure 4. Fuzzy CA-CFAR detector
As the method mentioned above, we could design corresponding fuzzy CAGO/CASO detectors. Utilizing the same processing procedure, we could get the membership function of fuzzy CAGO/CASO CFAR detectors by changingTin (11) and (12) to
x
.4 1 1
(arctan arctan )
/ 2 1
( ) CAGO
xN xN
w x
π
= −
+
⎛
⎞
⎛
⎞
⎜
⎟
⎜
⎟
⎝
⎠
⎝
⎠
(18)4
arctan 1
( )
1 CASO
w x
xN
π
=
+
⎛
⎞
⎜
⎟
⎝
⎠
(19)Fig. 5 is the model of fuzzy CAGO and CASO CFAR detector.
/ 2
N q
1
q qN/ 2 1+ qN
1 1
CUT N i i
q x
q
N =
=
∑
... ... qCUT
CAGO:
CASO:
4 1 1
( ) (arctan arctan ) / 2 1
w x
xN xN
π
⎛ ⎞ ⎛ ⎞ = ⎜⎝ ⎟⎠− ⎜⎝ + ⎟⎠
4 1
( ) arctan 1
w x
xN
π
⎛ ⎞
= ⎜⎝ + ⎟⎠
Figure 5. Fuzzy CAGO/CASO CFAR detector
IV. DISTRIBUTED FUZZY DETECTOR
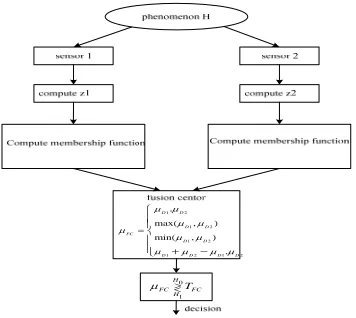
In this paper, we consider a distributed system consisting of two antennas and a fusion center as shown in Fig.6. Each antenna computes the value of membership function µD1andµD2by the received vector Q, the values are sent to fusion centre to produce the global value. Detector compares the global value to a decision threshold to decide whether a target is present. In this paper, we consider four kinds of fusion rules: MAX, MIN, algebraic-product, algebraic-sum.
A. MAX
1 2
max( D , D )
µ= µ µ (20)
the pdf of µFC is given as
1 2 2 1
( ) ( ) ( ) ( ) ( )
D D D D
fµ m =Fµ m ⋅fµ m +Fµ m ⋅fµ m (21)
0 1
H
FC FC
H
T
µ ><
1 2 1 2 1 2 1 2 1 2
max( , ) min( , )
.
.
D D D D FC
D D D D D D
µ µ
µ µ
µ
µ µ
µ µ µ µ
=
⎧ ⎪ ⎪ ⎨ ⎪
⎪ + −
⎩
Figure 6. Two-element distributed fuzzy CFAR detector
fµ = ⋅2 m, 0 ≤m≤1 (22) The relationship betweenPfaand Tis given by
2 0 2
T
fa fa
P =
∫
⋅ ⋅m dm=T ⇒ =T P (23)If we utilize the binary AND in this CFAR system, the relationship between the global false alarm rate Pfa and
local false alarm rate
( )
fa LP is
2
( ) ( )
fa fa L fa L fa
P = P ⇒ P = P (24)
If a target present was declared when using MAX rule,
we have
1 2 1 2
1 2
1 1
max( , ) max( , )
( ) ( )
D D D D fa
D fa D fa
D fa L D fa L
T P
P and P
P and P
µ µ µ µ
µ µ
µ µ
< ⇔ <
⇔ < <
⇔ < <
(25)
So the binary AND fusion rule also declares that there is a target. It indicates that the MAX fusion rule is equivalent to the binary AND.
B. MIN
µ =min(µ µD1, D2) (26)
1( ) (1 2( )) 2( ) (1 1( )) 2(1 )
D D D D
fµ m ⋅ −Fµ m + fµ m ⋅ −Fµ m = −m
(27)
2 02(1 ) 1 (1 )
T fa
P =
∫
−m dm= − −T⇒ = −T 1 1−Pfa (28)
like the MAX fusion rule, we show that the MIN fusion rule is equivalent to the binary OR. In this case, the relationship between the global false alarm probability
fa
P and the local false alarm probability
( )
Pfa L isderived as
2
2( ) ( ) ( ) 1 1
fa fa L fa L fa L fa
P = P − P ⇒ P = − −P (29)
If a target present was declared when using MIN rule, we have
1 2 1 2
1 2
1 1
min( , )
min( , ) 1 1
1 1 1 1
( ) ( )
D D
D D fa
D fa D fa
D fa L D fa L
T
P
P or P
P or P
µ µ µ µ
µ µ
µ µ
<
⇔ < − −
⇔ < − − < − −
⇔ < <
(30)
So the binary OR fusion rule declares that there is a target. And we see that the MIN fusion rule is equivalent to the binary OR logic.
C. Algebraic product
1 2
D D
µ µ= ⋅µ (31)
( ) 1 ln( ) m
du
f m m
u
µ =
∫
= − (32)The relationship betweenPfaand Tis given by
0 ln( ) (1 ln( ))
T fa
P =
∫
− u du=T − T (33)D. Algebraic sum
1 2
D D
µ µ= +µ (34)
( )
f mµ =m (35) The relationship betweenPfaand Tis given by
2
0
1
2 T
fa
P =
∫
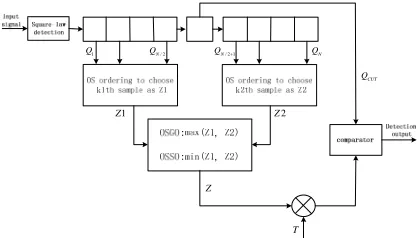
mdm= T (36)V. OSGO/OSSOCFARDETECTOR
The OSGO and OSSO CFAR detectors’ structure is depicted in Fig. 7, the precious and following sets of cells are independently ordered. Respective outputs are Z1 and Z2, which are the k1th largest sample of the precious reference window, and the k2th of the following window. The probability density function of Z1 and Z2 is given by
/ 2 1 1
2
1 1 1 1 2
3/ 2
1
( ) [2 ( ) 1]
( 1, / 2 1 1)
1
2
[1
(
)]
(
)
2
N k
Z
k k x
p x x
B k N k
x
e
x
γ
φ γ
γ
φ γ
π
−
− − −
= −
− +
−
(37)
/ 2 2 2
2
2 1 2 1 3/ 2 2
[ ]
1
( ) [2 ( ) 1]
( 2, / 2 2 1)
2
1 ( )(
)(1/
)
N k Z
k k x
p x x
B k N k
x
x
e
x
γ
φ γ
φ γ
γ
−
− − −
= −
− +
−
(38)
CUT Q / 2 N Q 1
Q QN/ 2 1+ QN
1
Z Z2
Z
T
Figure 7. OSGO and OSSO CFAR detector A. OSGO Detector
In OSGO CFAR, as discussed above, the clutter level is estimated by selecting the greater one of Z1 and Z2, therefore the statistic ZOSGO is given by
ZOSGO =max(Z Z1, 2) (39) the probability density function of ZOSGO is
1( ) 2( ) 2( ) 1( )
( ) Z Z Z Z
OSGO p z P z p z P z
p z = +
(40)
herePZ1( )z and PZ2( )z is the cumulative density function of Z1 and Z2. According to this, the probability of false alarm rate for OSGO scheme can be calculated for a fixed factor T
0 0
0
Pr{ } Pr{ } OSGO( )
OSGO
fa Y TZ Y Tz p z dz
p = ≥ =
∫
∞ ≥ (41)using (37), (38) and (40) in (41), it could be expressed as
2
2
2
1 2 1
/ 2 1 1 1 0
/ 2 2 2 1 2 / 2 2
2 1 / 2 1 1 1
1 2
( 1, / 2 1 1) ( 2, / 2 2 1)
[2 ( ) 1][[2 ( ) 1] [1 ( )]
[2 ( ) 1] [1 ( )] [2 ( ) 1]
[1 ( )] [2 ( ) 1] [1 ( )]
k k
N k k
N k k N k
k N k k
OSGO fa z y z y
B k N k B k N k
y
y y
T
z z e dz y
y z z e
P π φ φ φ φ φ φ φ φ φ + − ∞ − − − ∞ − − − − ∞ − − − = − + − + − − − − − + − − − −
∫
∫
∫
22 dz dy]
(42)
like OS CFAR, the false alarm rate is controlled by the scaling factor T and it does not depend on the dispersion parameter
γ
of the Pearson-distributed parent population.The probability of detection of OSGO CFAR is expressed as
1 0 1
Pr{ } Pr{ } OSGO( )
OSGO
d Y TZ Y Tz p z dz
p = ≥ =
∫
∞ ≥ (43)using (37), (38) and (40) in (43), we obtain
2 2 2 2 2 2 2
1 2 1
( )( )
/ 2 1 1 1 0
/ 2 2 2 1 2 / 2 2
2 1 / 2 1 1 1 2
/
1 2
( 1, / 2 1 1) ( 2, / 2 2 1)
[ ][[2 ( ) 1] [1 ( )]
[2 ( ) 1] [1 ( )] [2 ( ) 1]
[1 ( )] [2 ( ) 1] [1 ( )] ]
k k
N k k
N k k N k
k N k k
OSGO d T y z y z y
B k N k B k N k
e y y
z z e dz y
y z z e dz dy
P γ σ π φ φ φ φ φ φ φ φ + − − ∞ − − − ∞ − − − − ∞ − − − = − + − + − − − − + − − − −
∫
∫
∫
(44)We can see from this expression that pd is controlled by the ration of the clutter dispersion γ and the power of target σ .
B. OSSO Detector
In OSGO CFAR scheme, the clutter level estimation comes from the smaller value of the Z1 and Z2.
1 2
min( , )
OSGO
Z = Z Z (45)
Its probability density function is[10]:
1 2 2 1
( ) Z ( )(1 Z ( )) Z ( )(1 Z ( ))
OSSO
p z = p z −P z +p z −P z (46) The probability of false alarm of OSSO CFAR is expressed as
0 0
0
Pr{ } Pr{ } OSSO( )
OSSO
fa Y TZ Y Tz p z dz
p = ≥ =
∫
∞ ≥ (47)using (37), (38) and (46) in (47),we obtain
2
2
1
/ 2- 1 0
2 1-1 2
/ 2- 2 2-1 2 0
2 1
[2 ( ) 1][2 ( ) 1]
( 1, / 2 1 1)
2
2 1
[1 ( )]
( 2, / 2 2 1)
2
[2 ( ) 1][2 ( ) 1] [1 ( )]
k
N k
k k
N k k OSGO
fa OSSO fa y y y
f f y
B k N k
p T
f y e dy
B k N k
p
y
f f y f y e dy P
T P ∞ ∞ − − = − − − + − + − + − − − −
∫
∫
(48) like the probability of detection of OSSO CFAR, it could be expressed as1 1
0
Pr{ } Pr{ } ( )
OSSO
d OSSO
p = Y ≥TZ =
∫
∞ Y ≥Tz p z dz (49) using (37), (38) and (46) in (49), we obtain2 2 2 2 2 2 2 2 1
/ 2 1 2
0 1
1 1 2
/ 2 2 2 1
2 2
0
2 1
[ ][2 ( ) 1]
( 1, / 2 1 1)
2
2 1
[1 ( )]
( 2, / 2 2 1)
2
[ ][2 ( ) 1] [1 ( )]
OSSO d T k N k y y k k T y
N k k OSGO
y
d
P e y
B k N k
y e dy
B k N k
e y y e dy P
γ σ γ σ φ π φ π φ φ − ∞ − − − − − ∞ − − = − − + − + − + − − −
∫
∫
(50)VI. SIMULATION AND DISCUSSION
20 log s
GSNR σ
γ
= (51)
hereσsis the fluctuating parameter.
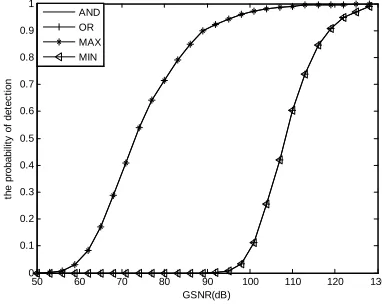
In Fig. 8, we compare the detection performance of identical detection systems using MAX, MIN fusion rules with binary AND, OR logic rules. We take CA-CFAR for example, it is shown that MAX fusion rule performs exactly as binary AND, and MIN fusion rule performs exactly like binary OR, which is constant with the theory analysis.
50 60 70 80 90 100 110 120 130 0
0.1 0.2 0.3 0.4 0.5 0.6 0.7 0.8 0.9 1
GSNR(dB)
th
e
pr
obab
il
it
y
of
det
ec
ti
on
AND OR MAX MIN
Figure 8. Detection probability of MAX/MIN and AND/OR
In Fig. 9, we plot the detection probability of fuzzy CA CFAR detector against different general GSNR under homogenous clutter. We could observe that the detection performanceof detector system using algebraic sum and MAX fusion rules achieves at Pd ≥0.5 when
70
GSNR= dB . When 70dB≤GSNR≤95dB , the detector using algebraic sum fusion rule offers best detection performance. When GSNR>95dB , the performance of the algebraic sum fusion rule is very close to algebraic product fusion rule, and better than MAX and MIN fusion rule. We could conclude from the simulation results that the algebraic sum fusion rule is the most robust scheme compared to other fuzzy fusion rules.
50 60 70 80 90 100 110 120 130 0
0.1 0.2 0.3 0.4 0.5 0.6 0.7 0.8 0.9 1
GSNR(dB)
th
e prob
abi
lit
y
of
det
e
c
ti
on
algebraic sum algebraic product MAX MIN
Figure 9.Detection probability of CA-CFAR
We analyze the detection performance of CASO detector based on fusion rules under multi-target
environment. Fig. 10 is the case that there are two interrupt targets in left reference window, Fig. 11 is the case when there are two in the right window and one in the left window with equal generalized interference signal-to-noise which is 20dB. As we can see, in two cases, CASO detector based on algebraic-sum fusion rules is the most robust to the interrupt targets.
30 40 50 60 70 80 90 100 110 120 130 0
0.1 0.2 0.3 0.4 0.5 0.6 0.7 0.8 0.9 1
GSNR(dB)
th
e
p
ro
b
a
b
ilit
y
o
f
d
e
te
c
tio
n
Performance of Fuzzy CASO CFAR Detectors
CASO-AND CASO-OR CASO-Algesum CASO-Algepro CASO-MAX CASO-MIN
Figure 10. Detection probability of fuzzy CASO (IL = 2, RL = 0)
30 40 50 60 70 80 90 100 110 120 130 0
0.1 0.2 0.3 0.4 0.5 0.6 0.7 0.8 0.9 1
GSNR(dB)
th
e
p
ro
b
a
b
ilit
y
o
f
d
e
te
c
tio
n
Performance of Fuzzy CASO CFAR Detectors
CASO-AND CASO-OR CASO-Algesum CASO-Algepro CASO-MAX CASO-MIN
Figure 11. Detection probability of fuzzy CASO (IL = 1, RL = 2)
In Table I, we compare the false-alarm-control capacity of fuzzy CAGO CFAR detector under non-homogeneous condition such as clutter-edge environment, which is very common due to snow, rain and wind in practical condition. The numerical results in table I show that the false alarm rate control capacity of MIN rule is better than those of other rules.
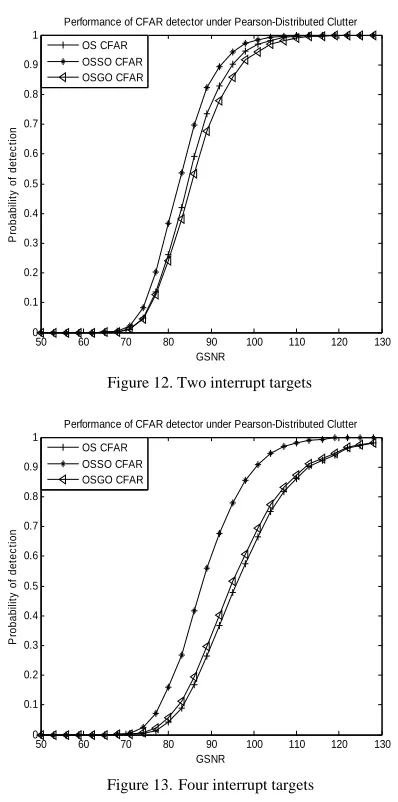
We compare the detection performance of the OSGO, OSSO and OS CFAR detectors in the presence of multiple targets with equal generalized interference signal-to-noise ratio (GINR), GINR=20dB. In Fig. 12, there are two interrupt targets in the reference window, OSSO is the best detector. When detection probability is
TABLE I.
FALSE ALARM RATE CONTROL OF FOUR FUZZY RULE
ratio algesum algepro MAX MIN
50%, OSSO exhibits 4dB superiority in GINR than OS, OSGO shows the worst detection probability.
In Fig. 13, when four interrupt targets exist in left reference window or right reference window, the performance of OS and OSGO CFAR detectors began to degrade, and suffer more serious detection loss, while OSSO still keep robust, 6dB GINR improvement is gained. OSGO shows comparable performance with OS when interrupt target increases. When the interrupt targets number is beyond 4, as shown in Fig. 14, the OS and OSGO CFAR detection schemes appear totally invalidated, but the OSSO CFAR is still not very affected.
It is worth to point out the OSGO CFAR detector has all the advantages of OS CFAR with a negligible CFAR loss when the interrupt target number is not too large, OS complexity is O N( 2) , as to OSGO and OSSO, the complexity is (1 / 2) (O N2), so it needs only one half of processing time compared to OS CFAR detector.
50 60 70 80 90 100 110 120 130
0 0.1 0.2 0.3 0.4 0.5 0.6 0.7 0.8 0.9 1
GSNR
P
robab
ilit
y
of
de
te
c
tio
n
Performance of CFAR detector under Pearson-Distributed Clutter
OS CFAR OSSO CFAR OSGO CFAR
Figure 12. Two interrupt targets
50 60 70 80 90 100 110 120 130
0 0.1 0.2 0.3 0.4 0.5 0.6 0.7 0.8 0.9 1
GSNR
P
robab
ilit
y
of
de
te
c
tio
n
Performance of CFAR detector under Pearson-Distributed Clutter
OS CFAR OSSO CFAR OSGO CFAR
Figure 13.Four interrupt targets
50 60 70 80 90 100 110 120 130
0 0.1 0.2 0.3 0.4 0.5 0.6 0.7 0.8 0.9 1
GSNR
P
rob
abi
lit
y
o
f det
ec
ti
on
Performance of CFAR detector under Pearson-Distributed Clutter
OS CFAR OSSO CFAR OSGO CFAR
Figure14. Six interrupt targets
VII. CONCLUSION
In this paper, we have proposed several kinds of new CFAR detector, analyzed the performance in multi-target and clutter-edge environment, when the background clutter follows Pearson distribution. Fuzzy CA/CAGO/CASO detectors offer detection superiority and better false-alarm-control capacity, OSSO CFAR is more robust to interrupt targets than OS, OSGO CFAR owns all the advantages of OS CFAR. Performance analysis of multiple-sensor network system is the next step of research.
ACKNOWLEDGMENT
This research work is supported by the National Natural Science Foundation of China and GUCAS Science and Technology Research Foundation.
REFERENCES
[1] Finn H M, Johnson R S, “Adaptive detection mode with threshold control as a function of spatially sampled clutter- level estimates,” RCA Review, 1968. 29(9): 414-463.
[2] Rohling,H, “Radar CFAR threshold in clutter and multiple target situations,” IEEE Transactions on Aerospace and Electronic Systems, pp. 608-621.1968.
[3] Hansen V G, “Constant False Alarm Rate Processing in Searches,” IEEE International Radar Conference, London, pp. 325~332. 1973.
[4] Trunk G V, “Range Resolution of Targets Using Automatic Detectors,” IEEE Trans On AES pp.750~755.1978. [5] Richard J T, Dillard G M, “Adaptive Detection Algorithoms
for Multi-target Situations,” IEEE Trans. on AES,PP.338~343.1977
[6] Gandhi P P, Kassam S A. Analysis of CFAR Processors in Nonhomogeneous Background. IEEE Trans, on AES,PP427~445.1977
[7] Pierce R D. Application of the positive alpha-stable distribution. IEEE Signal Processing Workshop on Higher-Order Statistics, Banff, Alberta, Canada, July1997: 420–424.
[9] Tsakalides P, Trinci F, Nikias C L. Performance assessment of processors in Pearson-distributed clutter, IEEE Transactions on Aerospace and Electronic Systems, vol. AES-36, 4, October 2000: 1377–1386.
[10] Tsakalides P, Trinci F, Nikias C L. Performance assessment of CFAR processors in Pearson-distributed clutter, IEEE Transactions on Aerospace and Electronic Systems, vol. AES-36, 4, October 2000: 1377–1386. [11] Zouberda Messali, Faouzi Soltani. Performance of
Distributed CFAR Processors in Pearson Distributed Clutter. EURASIP Journal on Advance in Signal Processing. volume 2007, ID 21825
[12] Leung, S.W., Minett, J.W. The use of fuzzy spaces in signal detection, Fuzzy Sets Syst. 2000,114: 175-0184. [13] Leung, S.W., Minett, J.W. A fuzzy approach to signal
integration. IEEE Trans. on Aerospace and Electronic System, 2002, 38(1): 346-351.
[14] Amir Zaimbashi, Mohammad Reza Akhavan Saraf, Hamid MirMohamad-Sadeghi. Binary and Fuzzy Distributed CFAR Detectors. Proceedings of the 5th European Radar Conference October 2008, 384-387.
[15] A.Papoulis, Probability Random Variables and Stochastic Processes, McGraw-Hill, New York, NY, USA, 3rd edition, 1991.
[16] Nadarajah S, Comments on “Performance analysis of someCFAR detectors in homogeneous and non-homogeneous Pearson-distributed clutter,” Signal Processing, 2007, 87(3): 1169–1170.
Long Cai received the B.S. degree from Harbin Institute of Technology, Harbin, China, in 2006 and the M.S. degree from Chinese Academy of Sciences (CAS), Beijing, China, in 2009, both in electrical engineering. He is currently working towards the Ph.D. degree with the Institute of Acoustics, Chinese Academy of Sciences.