ISSN (Online): 2320-9364, ISSN (Print): 2320-9356
www.ijres.org Volume 3 Issue 7
ǁ
July. 2015
ǁ
PP.48-55
Comparative Computational Modelling of CO
2Gas Emissions for
Three Wheel Vehicles
Chidiebere Metu, Sunday Christopher Aduloju*, David Agarana, Elizabeth
Udeh, Sumaila Onimisi Sheidu
National Engineering Design Development Institute,PMB 5082, Nnewi Anambra State, Nigeria.
ABSTRACT
Quest for a greener environment and energy conservation has led a number of research studies to increase fuel economy and reduce emissions in developmental design of vehicles.This study illustrates how a vehicular body shape affects fuel consumption and gas emission. Solid models for two different tricycles were done and simulated using Solid works flow xpress, Mathematical models were applied to compare the rate of fuel consumption and gas emission between the simulated models. The result shows thatNASENI TC1 consumes less fuel and invariably emits less CO2 when compared with RFM 1.
I.
INTRODUCTION
Fuel economy is described as that proportion of energy released by a fuel combustion process which is converted into useful work[1].For vehicles, it is measured in miles per gallon (MPG) in USA or kilometers per litre (km/L) in places like Netherlands, Denmark, etc. it is also known as fuel consumption in some part of the world like Europe, Canada, New Zealand and Australia and it is measured in (L/100km) [2].
In 2004, on the average cars in the United States of America have 8.7L/100km as its fuel consumption rate and in 2012 cars in the European countries have 5L/100km on the average, likewise for motorcycles the fuel consumption ranges from 1.5L/100km to about 2.8L/100km [3].This shows a remarkable decrease when compared to that of cars because of the specifications of the engine. The fuel consumption from different samples of tricycles ranges from 2.8L/100km to 4L/100km [4]. This range in fuel consumption also depends on the specification/type of the engine and also varies between manufacturers. Larger engine type consumes more fuel [5]. Generally, modern vehicles are designed to have a better fuel economy without compromising any of its design criteria.
Numerous factors are known to affect the fuel consumption of vehicles and developing ways to reduce these factors could be achieved during vehicle design.Some of these factors are internal while the rest are external. The internal factors depend on the engine capacity and mechanical components of the vehicle while the greatest external factor is air resistance or drag force [6]. Drag force is the external force that opposes the direction of thrust of a vehicle and it is expressed as: [6]
𝐷 =12𝐶𝑑𝜌𝐴𝑉2 --- 1
Where:
D is the drag force in Newton Cd is the coefficient of drag
𝜌is the density of air in kg/m3 A is the frontal area in m2
V is the velocity of the vehicle in m/s.
are caused by air pollution from transportation sector, volcanic ash and gases, smoke and trace gases from forest fires etc. [8]
The transportation sector is known to be one of the contributors of GHG emissions in developing and developed countries. Although some developing countries do not have a good record of emission’s caused by transportation sector, developed countries like America does. Cline (1991) specified that transportation accounts for an essentialelement of greenhouse gases (especially CO2) emission [10].It is a major contributor of carbon dioxide (CO2) and other GHG emissions from human activity, accounting to approximately 14% of total
anthropogenic emissions globally [11]. These anthropogenic emissionsinclude carbon monoxide (CO), hydrocarbons (HC), nitrogen oxides (NOx) and fine particles, these compounds are known to play a major role in air pollution. United States Environmental Protection Agency (USEPA) reported that transportation sources were responsible for 77% of CO emissions, 45% of NOx, 36% of volatile organic compounds, and 22% of particulates in the US during the year 1993 [12]. USEPA (2012) also reported that the transportation sector accounts to about 28% of the total GHG emission in United States of America, which is equivalent to 1827.28 million metric tons of CO2 emission [13].Cars, trucks, motorcycles, and buses are known to emit significant
quantities of these anthropogenic compounds [14].
Minimizing the use of fuel in order to reduce emissions in the transportation sector is an important short-term and long-short-term goal. In order to reduce the amount of fuel consumption, more fuel efficient vehicle models should be produced as well as operating exiting ones efficiently. The most simple and conveniently implemented method used in the estimation of fuel consumption is based on utilization of mathematical models. Evaluating fuel efficiency is an important factor to consider while designing vehicle. Based on this, evaluation is usually performed via mathematical modeling and simulation, the main constructive parameters of the vehicle may bedetermined at the design stage and steps to reduce fuelconsumption may be taken [15]. Several mathematical models for estimating fuel efficiency and gas emissions are described in literature. Generally, analytical mathematical models used in computation of fuel consumption and gas emission in vehicles due to drag effect can be applied to tricycles.
Comprehensive studies on dynamic stability and aerodynamics analysis on Cargo-type tricycles has been done by authors of [16, 17]. This paper focuses on the comparative analysis of fuel consumption and gas emissions of two models of cargo-type tricycles with reference to their body shapes. The first model is the referenced model (RFM1) while the second model (NASENI TC1) is the tricycle designed and constructed by National Engineering Design and Development Institute (NEDDI) Nnewi, an institute under National Agency for Science and Engineering Infrastructure (NASENI). The tricycles are modeled and simulated using Computational Fluid Dynamics (CFD) capability of Solidworks flowxpress software and the necessary data needed for analysis were generated. The use of the software and mathematical models reduces the need for costly physical testing and prototyping.
Metu et al, (2014) did an extensive review of the mathematical models available in estimating the fuel consumption of tricycles. In their work, they opined the use of mathematical model formulated by Silvia et al. The proposed model evaluates fuel consumption Qs measured in litres per 100km, on the basis of hourly fuel
consumption and engine via the following relation [18]
𝑄𝑠=𝑔𝑒 𝑃10𝑉𝑟𝑙+𝑃𝑤+𝑃𝑎
𝑎𝜂𝑇𝜌𝑓 ---2
Where
𝑔𝑒is the specific fuel consumption, g·kWh-1
𝑃𝑟𝑙is the power required to overcome the rolling resistance of the road, KW
𝑃𝑤is the power required to overcome the resistance of air, kW
𝑃𝑎is the power required to overcome the resistance of inertial acceleration, kW,
𝑉𝑎is the average speed of the vehicle, km/h
𝜂𝑇is the efficiency of transmission
𝜌𝑓is the fuel density in kg/l
Equation 2 assumes that the vehicle constantly operates in acceleration mode, Specific fuel consumption is assumed to be constant and at optimal and the engine power is determined according to this assumption.
For vehicles/tricycles travelling at the speed of 113km/hr (70miles/hr) and above, 65% of the power generated is used to overcome drag force at this speed[19]. Thus the total power can be simplified by taking aerodynamic drag force into consideration as shown;
Power = 𝐷×𝑉
0.65= 𝐶𝑑𝐴𝜌 𝑉3
1.3 ---3
Where
D is the drag force
Cd is the coefficient of drag ρ is the density of air in kg/m3
A is the frontal area in m2
The easiest and most accurate way of calculating transport emissions is to record energy and/or fuel use and employ standard emission conversion factors to convert energy or fuel values into CO2 emissions [20]. Every
liter of fuel consumed will result into a certain amount of CO2 emissions. The energy based method uses the
following formula in calculating emissions
CO2 emissions = FC xFECF ---4
Where,
FC is the fuel consumption in litres and FECF is the fuel emission conversion factor
Table 1 below gives the fuel emission conversion factor for different kind of fuels used in Kg CO2/litre or in Kg
CO2/kg
Table 1: Wheel to well Fuel Emission Conversion Factor
Source: Guidelines for Measuring and Managing CO2 Emission from Freight Transport Operations Cefic, and
ECTA (2011)
II.
Methodology
Computational Fluid Dynamics (CFD) simulations were carried out for Referenced Model (RFM 1) and National Agency for Science and Engineering Infrastructure Tricycle Cargo (NASENI TC1). The drag forces were generated for the two models at different speed of 40Km/h, 50Km/h, 60Km/h, 70Km/h, 80Km/h, 90Km/h and 100Km/h. Parameters considered in the simulation are drag force, air density, coefficient of drag and frontal area, all are shown in tables 2 and 3
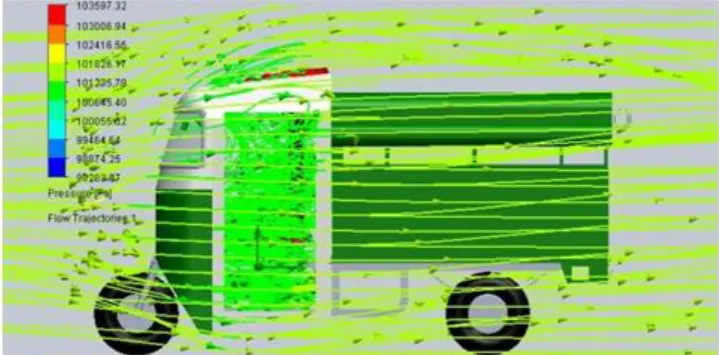
Figure 1:Pressure distribution of RFM 1 at the speed of 100km/h
Fuel type Kg CO2/litre Kg CO2/kg
Motor Gasoline 2.8
Diesel Oil 2.9
Gas Oil 2.9
Liquefied Petroleum Gas (LPG) 1.9
Compressed Natural Gas (CNG) 3.3
Jet kerosene 3.5
Residual Fuel Oil 3.5
Biogasoline 1.8
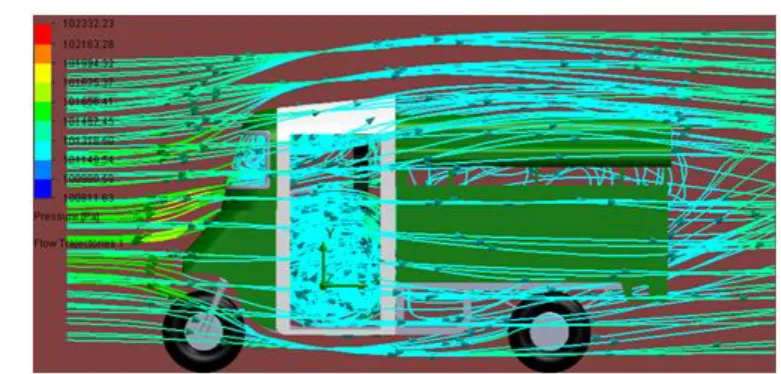
Figure 2: Pressure distribution of NASENI TC1 at 100km/h
Figure 1 and 2 shows the simulation and pressure result of RFM1 and NASENI TC1 respectively at the speed of 100km/h. The flow trajectory shows the movement of air molecules around the tricycles in the computational domain. Equation 2 and 3 were used to evaluate the fuel consumption and the power required in overcoming drag force for the two models respectively.
Furthermore, some necessary assumptions were made. These assumptions includes that the efficiency of transmission will be constant and therefore can be taken to be 0.95, the engine operates constantly in an acceleration mode, the specific fuel consumption of the engine is 800g/KWh and the density of fuel is 0.77Kg/L. These assumptions will be the same for both cases.
Considering the fact that the tricycle engine uses motor gasoline as its fuel, equation 4 was used to evaluate the rate of CO2 emissions for the two models.
III.
RESULT AND DISCUSSION
Table 2: Aerodynamic result for RFM 1
Drag force (N) Area (m2) Speed (km/h) Velocity (m/s) ρ(kg/m2) Cd
10.819 2.315 40 11.11 1.165 0.065
16.911 2.315 50 13.89 1.165 0.065
24.357 2.315 60 16.67 1.165 0.065
33.125 2.315 70 19.44 1.165 0.065
43.276 2.315 80 22.22 1.165 0.065
54.782 2.315 90 25.00 1.165 0.065
67.643 2.315 100 27.78 1.165 0.065
From tables 2 and 3, the coefficient of drag, Cd of RFM1 and NASENI TC1 is 0.065 and 0.055 respectively.
This gives a percentage difference in the Cd from RFM 1to NASENI TC1 as 15.385%.
Table 4 shows the result analysis of power required to overcome drag force, fuel consumption and CO2
emission rate for the two tricycles models at different speeds. At 100Km/h, the percentage difference of the of power required to overcome drag force, fuel consumption and CO2 emission rate from RFM 1 to NASENI TC1
is 13.793%, 13.61% and 13.56% respectively.
Table 3: Aerodynamic analysis for NASENI TC1
Drag force (N) Area (m2) Speed (km/h) Velocity (m/s) ρ(kg/m2) Cd
9.352 2.365 40 11.11 1.165 0.055
14.618 2.365 50 13.89 1.165 0.055
21.055 2.365 60 16.67 1.165 0.055
28.634 2.365 70 19.44 1.165 0.055
37.409 2.365 80 22.22 1.165 0.055
47.355 2.365 90 25 1.165 0.055
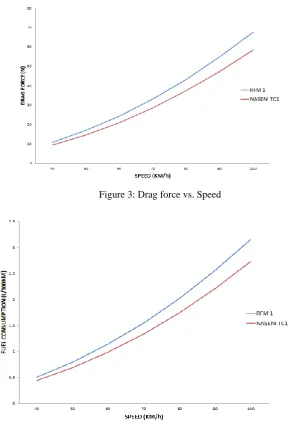
Figure 3: Drag force vs. Speed
Figure 4: Fuel consumption vs. Speed
Table 4: Analysis of power, Fuel consumption and CO2 emissions
Velocity (Km/h)
Power (KW)
Fuel consumption (L/100Km) CO2 emissions
(KgCO2/100Km)
RFM 1 NASENI
TC1
RFM 1 NASENI
TC1
RFM 1 NASENI
TC1
40 0.1849 0.1599 0.5055 0.4372 1.4154 1.2242
50 0.3614 0.3124 0.7905 0.6833 2.2134 1.9132
60 0.6247 0.54 1.1387 0.9843 3.1884 2.756
70 0.9907 0.8564 1.5478 1.338 4.3338 3.7464
80 1.4794 1.2788 2.0224 1.7482 5.6627 4.895
90 2.107 1.8214 2.5603 2.2133 7.1688 6.1972
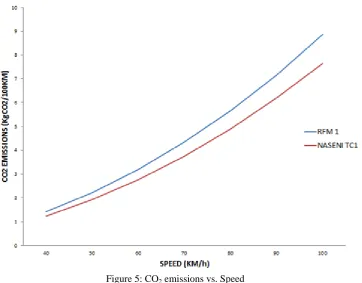
Figure 5: CO2 emissions vs. Speed
Figure 3, 4 and 5 shows the plots of drag force, fuel consumption and rate of CO2 emissions against speed
respectively. It is deduced from the figures that the drag forces, fuel consumption and CO2 emissions increases
with an increase in speed. Secondly, NASENI TC1 has a reduced
Fuel consumption rate, reduced rate of CO2 emissionsand reduced amount of driving power when compared
to RFM 1.
Figure 6 and 7 shows the plots of CO2 emission against fuel consumption for NASENI TC1 and RFM1
respectively. It is deduced from the plot that the rate of emission increases with increase in fuel consumptionfor the two models.Analysis on the power, fuel consumption and CO2 emissions for the tricycle models show that
NASENI TC1 uses less power to overcome drag force when compared to RFM1. Therefore, RFM1 will use more fuel and will pollute the atmosphere more than NASENI TC1
Figure 7: CO2 emissions vs. Fuel consumption for RFM 1
IV.
CONCLUSION
Study of fuel consumption and CO2 emissions of cargo tricycles with reference to their body has been
carried out.The Two tricycles were modeled, simulated for aerodynamics effects. The power required to overcome drag, Fuel consumption and CO2 emissions was calculated. The results show that NASENI TC1 has a
fuel consumption rate of 2.73L/100km and emits 7.65 KgCO2/100Km while RFM1 consumes 3.16L/100km and
emits 8.85KgCO2/100Km.
This result shows that NASENI TC1 is more fuel efficient and emits lesser CO2 when compared to RFM 1.
V.
RECOMMENDATION
To reduce CO2 emissions and fuel consumption to the required target in the transportation sector, it is
recommended that;
Vehicle body shape designs should be improved upon,
Improve vehicle maintenance,
Improve vehicle operation (eco-efficient driving) and
Make use of energy sources with a lower carbon intensity during vehicle design.
VI.
ACKNOLEDGEMENT
This project was supported by National Agency for Science and Engineering Infrastructure (NASENI) and National Engineering Design Development Institute (NEDDI).
REFRENCES
[1.] BusinessDictionary.com (2015).Fuel efficiency. Retrieved from http://www businessdictionary.com/definition/fuel-efficiency.html.
[2.] Wikipedia.org (2014) fuel efficiency. Retrieved from http://www.en.m.wikipedia.org/wiki/fuel_efficiency.
[3.] Wikipedia (2014, October 8). Fuel economy in automobiles. Retrieved from http://en.wikipedia.org/wiki/Fuel_economy _in_automobiles.
[4.] Totalmotocycle.com (2014). Best Scooter MPG Guide. Retrieved from http://www.totalmotorcycle.com/MotorcycleFuel EconomyGuide/best-scooter-MPG.htm.
[5.] Beststarmotor.com (2006).TW150ZH-2B (150CC/200CC Three Wheeler). Retrieved from http://www.bestarmotor.com/ product/GasolineThreeWheeler-TW150ZH-2B.html.
[6.] Michael R., Crumley J. (2007). Gas Mileage Dependence on Area and Drag Coefficient. Spring 1-6.
[7.] USEPA. (1994). National Air Quality and Emissions Trends Report, pp. 2, 6, 46, 52. United States Environmental Protection Agency, Washington, DC, USA
[8.] P.N. Ndoke, O. D. Jimoh (2005). Impact of Traffic Emission on Air Quality in a Developing City of Nigeria.AU Journal, 8 (4), 222-227.
[9.] Scientificamerican.com (2014). 2014 to Be Hottest Year Ever Measured. Retrieved from http://www.scientificamerican.com/ article/2014-to-be-hottest-year-ever-measured/.
[10.] Cline, W.R. 1991. Scientific basis for the greenhouse effect. Econ. J. 101, 904-919.
[12.] USEPA. 1993. Guide to Environmental Issues, Doc. No. 520/B-94-01 United States Environmental Protection Agency, Washington, DC, USA.
[13.] USEPA. (2014). Sources of Greenhouse Gas Emissions. Retrieved from http://www.epa.gov/climatechange/ghgemissions/ sources.html.
[14.] L.Yu, D. Small (2003). Vehicle Emissions. The UMAP Journal, 24 (4), 451-472.
[15.] Michael B. C., Efraim S., Alon K. (2013) Analytical Modeling of Fuel Consumption. Energies. 6,117-127.
[16.] Ekuase A., Aduloju S.C, Ogenekaro P., Ebhota W.S., Dania D.E. (2015). Determination of Center of Gravity and Dynamic Stability Evaluation of a Cargo-type Tricycle. American Journal of Mechanical Engineering . 3(1), 26-31
[17.] Agarana D., Ekuase A., Odomagah E.S., Olah S., Dania D. (2015) . Aerodynamics Comparative Analysis of CargoTruck Tricycles. International Journal of Engineering and Technology. 5(6), 375-385
[18.] Metu C., Aduloju S.C., Bolarinwa G.O, OlenyiJ.,Dania D. E. (2014) Vehicle Body Shape Analysis of Tricycles for Reduction in Fuel consumption. Innovative System Design and Engineering. 5 (11), 91-100.
[19.] Silva, C., Ross, M., & Farias, T. (2009). Analysis and simulation of “low-cost” strategies to reduce fuel consumption and emissions in conventional gasoline light-duty vehicles. Energy Conversion and Management, 50(2), 215-222