The EWMA Control Chart Based on Robust Scale Estimators
Nadia Saeed
College of Statistical and Actuarial Sciences University of the Punjab, Lahore, 54000-Pakistan [email protected]
Shahid Kamal
College of Statistical and Actuarial Sciences University of the Punjab, Lahore, 54000-Pakistan [email protected]
Abstract
The exponentially weighted moving average (EWMA) chart is very popular in statistical process control for detecting the small shifts in process mean and variance. This chart performs well under the assumption of normality but when data violate the assumption of normality, the robust approaches are needed. We have developed the EWMA charts under different robust scale estimators available in literature and also compared the performance of these charts by calculating expected out-of-control points and expected widths under non-symmetric distributions (i.e. gamma and exponential). The simulation studies are being carried out for the purpose and results showed that amongst six robust estimators, the chart based on estimator relatively performed well for non-normal processes in terms of its shorter expected width and more number of expected out-of-control points which shows its sensitivity to detect the out of control signal.
Keywords: Exponentially weighted moving average (EWMA), Robust estimator, Expected points out-of-control (EPO), Expected width (EW), Interval width (IW).
1. Introduction
In statistical process control, the control charts are used to monitor a process. Under the normal process the control charts help in detecting the moderate to large changes in the process parameters (Montgomery, 2001 and Figueiredo and Gomes, 2009).
available addressing the effect of non-normality on the performance of control charts for example Schilling and Nelson (1976), Rocke (1989, 1992), Bai and Choi (1995), Chakraborti (2000), Castagliola (2000), Nedumaran and Pignatiello (2001), Chakraborti et al. (2004), Jensen et al. (2006) and Riaz et al. (2013).
Robust estimators are developed for many problems like estimating location, scale and regression parameters. Since these estimators have good performance for the data drawn from wide range of probability distributions especially non-normal, the paper addresses the performance of robust scale estimators in EWMA charts for detecting small shifts. Robust method can also perform well for the mixture of two normal distributions.
Many robust estimators for scale are available in literature for example Gini's mean difference G, and etc. The preferable estimator should have relatively high breakdown point; a breakdown point of an estimator is the proportion of incorrect observations, an estimator can handle before giving an arbitrarily bad result. Some literature on the robust estimation can be found in Hampel (1971), Hoaglin et al. (1983), Lax (1985), Hampel et al. (1986), Elamir, (2001), Figueiredo and Gomes, (2009) and Schoonhoven et al. (2011).
The main objective of the research is to compare the performance of robust scale estimators for EWMA chart as this chart is more efficient than Shewhart chart for detecting small shifts. For the comparison six robust scale estimators i.e. Gini's mean difference (G), , , MAD, Robust Tau (Tau ̂) and Fast (F ) are considered for developing the control limits of EWMA chart and data are simulated from normal, gamma and exponential distributions. The performance of the robust control charts is being compared on the basis of expected number of out-of-control points (EPO) and expected width (EW) of the control limits under non-symmetrical distributions (i.e. exponential and gamma).
2. Methodology
The Exponentially Weighted Moving Average (EWMA) chart is considered as an alternative to Shewhart control charts for estimating the small shifts in process. Its performance is considered equivalent to CUSUM chart but it is easier to calculate in many situations. The EWMA control charts are often used for individual measurements. However in rational subgroups of size n>1, we can replace with ̅ and with ̅
√ (Montgomery, 2001). The EWMA chart was first introduced by Robert (1959) and further work was done by Crowder (1989ab) and Lucas and Saccucci (1990).
The variate is considered as exponentially weighted moving average which is defined as:
The starting value is considered as ̅ for sample data. Since is the weighted average of all sample means, the two control limits, upper control limit (UCL) and the lower control limit (LCL), for EWMA chart are as follows:
√
√
The control limits increases as „i‟ increase until they stabilized at steady state value. The stabilized control limits can be calculated as:
√
√
The factor L is the width of the control limits and is the process standard deviation. The EWMA statistic is being plotted against each sample and limits are used to detect the out-of-control signal (for further details see Montgomery, 2001).
2.1 Robust Scale Estimators
Robust statistics can give useful results if the classical assumptions are not met i.e. the assumption of normality (Huber, 1981). This means if the data violate the assumptions, robust estimators can still perform better; having reasonable efficiency, small bias and asymptotically unbiased. A class of M-estimators is available in literature. Most of them are based on median which is most resistant against outliers and has 50% breakdown point. These estimators include Gini's mean difference G, the Median Absolute Deviation about the median (MAD), and etc. (for further details see Rousseeuw and Croux, 1993).
From the class of robust M-estimators, the operational definitions of some robust scale estimators used in this research are:
i. Gini Mean Difference ( ):
Gini mean difference can be formulated as:
∑ | | ( )
Since √ , so
√
ii. The Median Absolute Deviation from median (MAD) estimator:
The median absolute deviation (MAD) was developed by Hampel (1974). It can be computed as:
| |
where the inner median is the median of observations and outer median is the median of absolute values of the deviations taken from the inner median. For a normal population, is considered an estimator of .
iii. The Estimator for Scale
Rousseeuw and Croux (1993) proposed two estimators as alternative to MAD, called and . Since MAD performed well for symmetric distributions but has low efficiency for normal distribution, the proposed estimators proved more efficient than MAD. The first estimator can be computed as:
{ (| |)}
where the outer median is the median of medians of | | . To reduce the small sample bias, is used as an estimator of and is bias adjusting constant.
iv. The Estimator for Scale:
The second proposed estimator by Rousseeuw and Croux (1993) is , which can be formulated as:
| |
where ([ ] ), it is assumed that is 2.2219 times the kth order statistic of the
( ) distances between data points. To reduce the small sample bias, is used as an estimate of where is correction factor.
v. The robust Tau-estimate of Scale (Tau ̂):
The Tau-estimate, introduced by M. G. Kendall is based on the ranks of the observations. The estimator is denoted by ̂ by using the following expression:
̂
⁄
vi. The Fast Estimator for Scale (F ):
This is the efficient alternative to MAD. The F function is a shorter alias like SD and MAD. The estimator is proposed by Rousseeuw and Croux (1993) due to its greater efficiency. The estimator belongs to the family of M-estimators. The F estimator can be obtained through faster computation with more than 80% efficiency and with 50% breakdown point. The efficiency of F estimator is confirmed through simulations (Smirnov and Shevlyakov, 2014).
2.2 EWMA control Limits based on robust estimators:
For the rational subgroups (n>1), each sample mean is transformed into EWMA statistic as ̅ before plotted on chart, the initial value is the overall average ̿ over m samples.
The role of robust estimators in the development of control charts is well stated by Rocke (1989) and it has become an area of interest in the recent years (see Elamir & Seheult, 2001; Khoo & Sim, 2005; Shahriari et al., 2009; Schoonhoven & Does, 2012 and Zwetsloot, Schoonhoven, & Does, 2015).
The EWMA control limits based on Gini scale estimator G are developed by Elamir and Seheult (2001) as:
̿ ̅ ̿
̿ ̅
where √
The other five control limits based on , , MAD, Tau ̂ and F scale estimators can also be derived by using the same approach used by Elamir and Seheult (2001) as
̿ ̅ , ̿ ̅ , ̿ ̅, ̿ ̂ ̅ and ̿ ̅ .
3. Monte-Carlo Simulation
The Monte-Carlo simulations are carried out for the calculation and comparison of simulated control limits of EWMA chart based on different robust estimators under study.
3.1 Simulation 1
Results Discussion
The findings of table 1 showed that is performing better for both normal and exponential distributions at weighting factor λ=0.1 because of having shorter interval width (IW) and hence more resistant for the generation of an out-of-control signal. The effect of the tighter control limits signaling the more points out of control and hence a need of corrective action is observed for normal and exponential processes. However MAD performed better for gamma distribution. Furthermore at λ=1.0, the control limits of EWMA chart based on estimator has relatively shorter interval width for normal and both non-normal distributions.
Table1: Control limits of EWMA chart for six robust estimators under different distributions (n=5, m=50)
Estimators
N(0,1) Gamma (2,2) Exp (1)
=0.1
UCL 0.2402 1.0790 1.2076
LCL -0.1056 0.8368 0.8908
IW 0.3458 0.2422 0.3168
UCL 0.2360 1.0712 1.1723
LCL -0.1014 0.8446 0.9260
IW 0.3374 0.2265 0.2463
UCL 0.2169 1.0588 1.1685
LCL -0.0822 0.8570 0.9299
IW 0.2991 0.2019 0.2386
MAD UCL 0.2323 1.0588 1.1689
LCL -0.0976 0.8570 0.9295
IW 0.3299 0.2018 0.2394
Tau ̂ UCL 0.2209 1.0601 1.1688
LCL -0.0863 0.8557 0.9295
IW 0.3072 0.2044 0.2393
F UCL 0.2193 1.0599 1.1714
LCL -0.0847 0.8559 0.9270
IW 0.3040 0.2039 0.2445
=1.0
UCL 0.7420 1.5036 1.6381
LCL -0.7522 0.5494 0.2480
IW 1.4942 0.9542 1.3900
UCL 0.7106 1.4521 1.5700
LCL -0.7209 0.6009 0.3161
IW 1.4315 0.8512 1.2540
UCL 0.6580 1.4371 1.5410
LCL -0.6683 0.6159 0.3451
IW 1.3264 0.8213 1.1960
MAD UCL 0.6707 1.5003 1.5634
LCL -0.6810 0.5526 0.3227
IW 1.3516 0.9477 1.2407
Tau ̂ UCL 0.6643 1.4460 1.5621
LCL -0.6745 0.6069 0.3240
IW 1.3388 0.8391 1.2381
F UCL 0.6812 1.4455 1.5623
LCL -0.6914 0.6075 0.3238
3.2 Simulation 2
As shown in the literature that the limits based on robust estimator should outperform for non-normal process. For this purpose the second simulation is being carried out to compare the performance of EWMA chart based on six estimators under study. As it has been discussed in the literature that the large sample shows consistent behaviour for the performance measures of control intervals (Elamir, 2001 and Li et al. 2011). Furthermore it has also been observed in table 1 that the difference in interval widths is small, therefore large sample is needed to compare the performance of proposed control charts. For the purpose, one thousand random samples (m=1000) with n=5 & 10 are generated from gamma(2,2) and exponential(1) distributions.
For the calculation of control limits, ten values of weighting factor are considered (λ=0.1, 0.2, … , 1.0). Out of one thousand samples the number of out-of-control points beyond the six limits along with their interval widths is calculated. The complete simulation process is repeated for one thousand times (R=1000) and expected number of out-of-control points and expected widths are calculated. The six boxplots of the interval widths in each panel of the figures 1-4 under gamma and exponential distributions with n=5, 10 and λ=0.1, 0.2, … , 1.0 are constructed for the purpose.
Results Discussion
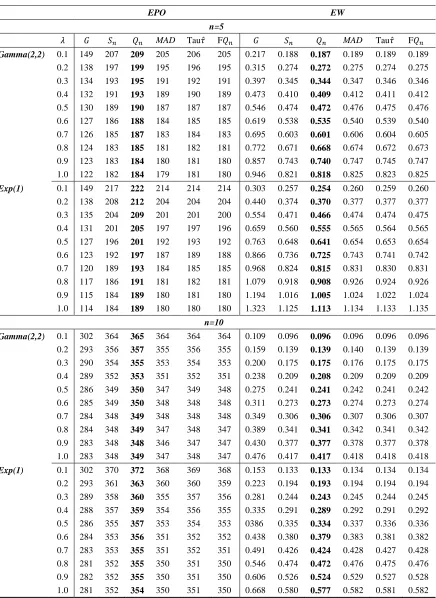
The Expected Points Out of control (EPO) is considered a good measure to show the performance of the control charts used by Elamir and Seheult (2001). The more points out of control limits show that there is a need for corrective action. Over one thousand simulation runs, the more expected out-of-control points ensures the capability of the chart to detect the out-of-control signal.
Table 2: EPO along with EW of EWMA charts based on six robust estimators for non-symmetrical distributions under different subgroup sizes
EPO EW
n=5
MAD Tau ̂ F MAD Tau ̂ F
Gamma(2,2) 0.1 149 207 209 205 206 205 0.217 0.188 0.187 0.189 0.189 0.189 0.2 138 197 199 195 196 195 0.315 0.274 0.272 0.275 0.274 0.275 0.3 134 193 195 191 192 191 0.397 0.345 0.344 0.347 0.346 0.346 0.4 132 191 193 189 190 189 0.473 0.410 0.409 0.412 0.411 0.412 0.5 130 189 190 187 187 187 0.546 0.474 0.472 0.476 0.475 0.476 0.6 127 186 188 184 185 185 0.619 0.538 0.535 0.540 0.539 0.540 0.7 126 185 187 183 184 183 0.695 0.603 0.601 0.606 0.604 0.605 0.8 124 183 185 181 182 181 0.772 0.671 0.668 0.674 0.672 0.673 0.9 123 183 184 180 181 180 0.857 0.743 0.740 0.747 0.745 0.747 1.0 122 182 184 179 181 180 0.946 0.821 0.818 0.825 0.823 0.825 Exp(1) 0.1 149 217 222 214 214 214 0.303 0.257 0.254 0.260 0.259 0.260 0.2 138 208 212 204 204 204 0.440 0.374 0.370 0.377 0.377 0.377 0.3 135 204 209 201 201 200 0.554 0.471 0.466 0.474 0.474 0.475 0.4 131 201 205 197 197 196 0.659 0.560 0.555 0.565 0.564 0.565 0.5 127 196 201 192 193 192 0.763 0.648 0.641 0.654 0.653 0.654 0.6 123 192 197 187 189 188 0.866 0.736 0.725 0.743 0.741 0.742 0.7 120 189 193 184 185 185 0.968 0.824 0.815 0.831 0.830 0.831 0.8 117 186 191 181 182 181 1.079 0.918 0.908 0.926 0.924 0.926 0.9 115 184 189 180 181 180 1.194 1.016 1.005 1.024 1.022 1.024 1.0 114 184 189 180 180 180 1.323 1.125 1.113 1.134 1.133 1.135
n=10
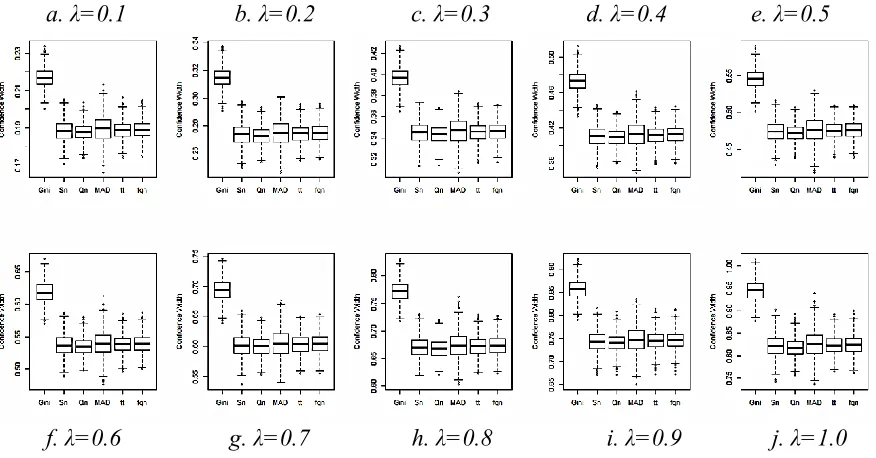
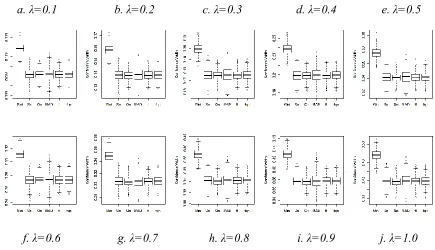
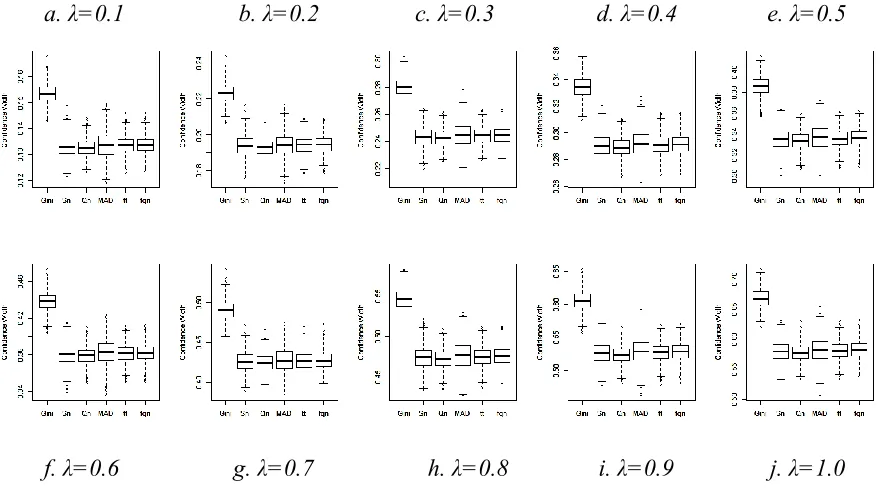
The six boxplots are constructed on the simulated widths of the EWMA control intervals based on six robust estimators. For 1000 random samples generated from Gamma(2,2) distribution, each with subgroup size 5, the widths of control limits are calculated by using λ=0.1. The whole process is repeated 1000 times and the boxplots are constructed for 1000 interval widths. The multiple boxplots are shown in figure 1(a). The complete process is repeated by using λ=0.2, 0.3,……,1.0 and the plots are shown in figure 1, panels (b) to (j). The figure 2 (a) to (j) shows box plots for exponential (1) distribution. Similarly the effect of subgroup size 10 is observed in figures 3 and 4, each with panels (a) to (j).
It can be shown in the figures 1 and 2 (each with panels a-j) that EWMA chart based on estimator has consistent and smaller interval width as compared to other robust estimators. The trend is same for every value of weighting factor λ and for both non-symmetric distributions (gamma and exponential). The shorter the width of the boxplot shows the lesser variation in the simulated interval widths. The shorter interval widths ensure that the control interval is more precise. Similarly figures 3 and 4, each with panels (a) to (j) are constructed for subgroup size 10. These figures also show that the control limits of EWMA chart based on estimator would be more precise than the control limits based on any other robust estimator under study because of shorter interval width and hence more resistant for the outliers.
a. λ=0.1 b. λ=0.2 c. λ=0.3 d. λ=0.4 e. λ=0.5
f. λ=0.6 g. λ=0.7 h. λ=0.8 i. λ=0.9 j. λ=1.0
a. λ=0.1 b. λ=0.2 c. λ=0.3 d. λ=0.4 e. λ=0.5
f. λ=0.6 g. λ=0.7 h. λ=0.8 i. λ=0.9 j. λ=1.0
Figure 2: box plots of interval widths of six control intervals under Exp (1) with n=5.
a. λ=0.1 b. λ=0.2 c. λ=0.3 d. λ=0.4 e. λ=0.5
f. λ=0.6 g. λ=0.7 h. λ=0.8 i. λ=0.9 j. λ=1.0
a. λ=0.1 b. λ=0.2 c. λ=0.3 d. λ=0.4 e. λ=0.5
f. λ=0.6 g. λ=0.7 h. λ=0.8 i. λ=0.9 j. λ=1.0
Figure 4: box plots of interval widths of six control intervals under Exp (1) with n=10.
4. Concluding Remarks
The control charts based on different scale estimators give tighter limits and hence provide greater sensitivity than the standard charts. By comparing the performance of EWMA chart based on six scale estimators (i.e. , , , MAD, Tau ̂ and F ), the simulations suggest that the chart based on estimator has greater sensitivity amongst all other charts. It is already proved that estimator shares good properties of estimator like simple formula, the definition which is suitable for asymmetric distribution and 50% breakdown point. In addition the efficiency of estimator is also high for Gaussian distribution (Rousseeuw and Croux, 1993). For its remarkable properties, it is considered best scale estimator. Our findings also justified that the control chart based on estimator is relatively more sensitive in detecting the out-of-control signal for both normal and non-normal processes.
As conclusion, the EWMA control chart based on estimator is preferable due to its good performance for normal and non-normal processes and hence it is most recommendable.
References
1. Amin, R. W. and Searcy A. J. (1991). A nonparametric exponentially weighted moving average control scheme. Communication in Statistics-Simulation and
Computation, 20, 1049-1072.
2. Amin, R. W. and Wollf H. (1995). The behavior of EWMA-type quality control schemes in the case of mixture alternatives. Sequential Analysis, 14,157-177. 3. Bai, D.S. and Choi, I.S. (1995). ̅ and R control charts for skewed populations. J.
of Quality Technology, 27(2), 120–131.
4. Castagliola, P. (2000). ̅ control chart for skewed populations using a scaled weighted variance method. International J. of Reliability, Quality and Safety
Engineering, 7(3), 237–252.
5. Chakraborti, S. (2000). Run length, average run length and false alarm rate of Shewhart ̅ chart: exact derivations by conditioning. Communications in Statistics
– Simulation and Computation, 291, 61–81.
6. Chakraborti, S., Van der Laan, P., Van de Wiel, M. A. (2004). A class of distribution-free control charts. J. Roy. Statist. Soc. Ser. C-Appl. Statist.
53(3):443–462.
7. Crowder, S. (1989a). Design of exponentially weighted moving average schemes.
Journal of Quality Technology, 21, 155-162.
8. Crowder, S. V. (1989b). A simple method for studying run length distribution of exponentially weighted moving average charts, Technometrics, Vol. 29.
9. Daniel, Wayne W. (1997). Applied Nonparametric Statistics, (2nd ed.), Wadsworth Publishing.
10. Elamir E. and Seheult A. (2001). Control charts based on linear combinations of order statistics. Journal of applied statistics, 28, 457-468.
11. Elamir, E. 2001. Probability distribution theory, generalizations and applications of L-moments. Ph.D. Thesis, Durham University.
12. Figueiredo F and Gomes M. L. (2009). Monitoring industrial processes with robust control charts. REVSTAT – Statistical Journal, 7(2), 151–170
13. Gan, F. (1995). Joint monitoring of process mean and variance using exponentially weighted moving average control charts. Technometrics, 37, 446-453.
14. Hampel, F.R. (1971). A general qualitative definition of robustness, Annals of
Mathematical Statistics, 42, 1887–1896.
15. Hampel F.R. (1974). The influence curve and its role in robust estimation. J. Am.
16. Hampel, F.R., Ronchetti, E.M., Rousseew, P.J. and Stahel, W. (1986). Robust
Statistics: The Approach Based on Influence Functions, Wiley, New York.
17. Hoaglin, D.M., Mosteller, F. and Tukey, J.W. (1983). Understanding Robust and
Exploratory Data Analysis, Wiley, New York.
18. Huber, P. J. (1981), Robust Statistics. New York: John Wiley.
19. Hunter, J. (1986). The exponentially weighted moving average. Journal of
Quality Technology, 18,203-210.
20. Jensen, W.A., Farmer J, L.A., Champ, C.H. and Woodall, W.H. (2006). Effects of parameter estimation on control chart properties: a literature review. J. Quality
Technology, 38, 349–364.
21. Khoo, M.B.C. and Sim, S.Y. (2005), “A robust exponentially weighted moving average control chart for the process mean”, Journal of Modern Applied
Statistical Methods, 5(2), Article 21.
22. Lax, D.A. (1985). Robust estimators of scale: finite sample performance in long-tailed symmetric distributions. J. Amer. Statist. Assoc., 80, 736–741.
23. Li, H. Q., Tang, M. L., Poon, W.Y., Tang, N. S. (2011). Confidence interval for the difference between two poisson rates. Communication in Statistics –
Simulation and Computation, 40:9, 1478 – 1493.
24. Lucas, J. and Saccucci, M. (1990). Exponentially weighted moving average control schemes: Properties and enhancements. Technometrics, 32, 1-13.
25. Macgregor, J. F. and T. J. Harris (1993). The exponentially weighted moving variance. Journal of Quality Technology, 25,106-118.
26. Maronna, R.A. and Zamar, R.H. (2002). Robust estimates of location and dispersion of high-dimensional datasets. Technometrics, 44(4), 307–317.
27. Montgomery, D. C. (2001). Introduction to Statistical Quality Control. 4th ed. New York: John Wiley & Sons
28. Nedumaran, G. and Pignatiello, J. J. (2001). On estimating ̅ control limits. J.
Quality Technology, 33(2), 206–212.
29. Ng, G. and Case, E. (1989). Development and evaluation of control charts using exponentially weighted moving averages. Journal of Quality Technology, 21, 242-250.
30. Riaz, M., Mehmood, R., Ahmad, S. and Abbasi, S. A. (2013). On the performance of auxiliary-based control charting under normality and nonnormality with estimation effects. Qual. Reliab. Engng. Int., 29 1165–1179.
31. Roberts, S. W. (1959). Control charts based on geometric moving averages.
Technometrics, 1,239-250.
32. Rocke, D.M. (1989). Robust control charts. Technometrics, 31(2), 173–184. 33. Rocke, D.M. (1992). ̅ and charts: robust control charts. The Statistician, 41,
34. Rousseeuw and Croux, (1993). Alternative to Median Absolute Deviation.
Journal of American Statistical Association, 88:424, 1273-1283.
35. Schilling, E.G. and Nelson, P.R. (1976). The effect of non-normality on the control limits of the ̅ charts. J. Quality Technology, 8(4), 183–188.
36. Schoonhoven, M., Nazir, H. Z., Riaz, M. and Does, R. J. (2011). Robust location estimators for the X-bar control chart. Journal of Quality Technology, Vol. 43, No. 4,363-379.
37. Schoonhoven, M., and Does, R.J.M.M. (2012). “A robust standard deviation control chart”, Technometrics, 54, 73-82.
38. Shahriari H., Maddahi A. and Shokouhi A. H. (2009). A robust dispersion control chart based on M-estimate. Journal of Industrial and Systems Engineering, Vol. 2, No. 4, pp 297-307
39. Smirnov P. O. and Shevlyakov, G. L. (2014). Fast highly efficient and robust one-step M-estimators of scale based on . Computational Statistics & Data
Analysis, Vol. 78, 153-158.
40. Wetherill, G. B. and D. Brown (1991). Statistical Process Control: Theory and
Practice (1st ed.). London: Chapman and Hall.
41. Zwetsloot, I.M., Schoonhoven, M., and Does, R.J.M.M. (2015). “A Robust Phase-I Exponentially Weighted Moving Average Chart for Dispersion”, Quality