Estimation of Catchment Characteristics
using Remote Sensing and GIS Techniques
VEMU SREENIVASULU* and PINNAMANENI UDAYA BHASKAR Department of Civil Engineering
Jawaharlal Nehru Technological University: Kakinada Kakinada, A.P, India-533003
Abstract
Catchment physical characteristics play an important role in the hydrological response of the catchment. Since most of the mountainous terrain is either ungauged or sufficient observed data is not available, for such basins the study of catchment physical characteristics i.e., geomorphological properties, slope, aspect and landuse / landcover of such areas become much more important and significant. Remote sensing and Geographic Information System (GIS) techniques are being effectively used in recent times as a tool in determining the quantitative description of the catchment geometry and change in land use / land cover.
In this paper an attempt is made to evaluate the physical characteristics of the Devak catchment up to Gura Slathian in Jammu region of Jammu & Kashmir (J&K), India. The results of the study are useful for further hydrological investigations and are the major inputs to various hydrological models.
Keywords: Digital Elevation Model, landuse/landcover, geomorphological properties, flow direction
1. Introduction
To understand the laws of runoff processes in a catchment, hydrologists are faced with many problems, especially in respect of ungauged catchment where hydrological data are rarely available. Many approximate formulae, usually crude empirical statements, have been developed to relate precipitation with flow. For ungauged basins it has been the endeavor of many hydrologists and earth scientists to quantify and relate geomorphological parameters of naturally shaped river basins to its hydrologic response characteristics.
Drainage basins are the fundamental units of the fluvial landscape, and, accordingly, a great amount of research has focused on their geometric characteristics, including the topology of the stream networks, and the quantitative description of drainage texture, pattern, shape, and relief [1]. Because drainage basins are the physical entities used to measure the volume of water and sediment produced by runoff and erosion, the analysis of basin morphometry has been extended to include the interrelationships between network characteristics and the resulting water and sediment yields.
In India, National Institute of Hydrology (NIH) has taken up geomorphological studies of selected river basins spread over the entire country. Faced with the vexed problem of non-availability or inadequacy of data for the river basins, particularly in mountainous areas. Hydromorphometric studies in quantitative terms are very few in Himalayan Region where the present study is conducted. Singh [2] studied the Geomorphology of the Tawi basin and concluded that “The Tawi basin, being part of Western Himalayas has been effected by intermittent tectonic events from Teritary up to Pleistocene and recent periods and their imprints are evidenced in the surface morphology. The region has also witnessed Pleistocene glaciation which has also played a significant role in shaping the geomorphic forms of the basin”.
DEMs are used to delineate watersheds [3], analyze channel networks [4] [5], predict soil water content [4] [6], predict erosion potential [7] [8] [9], model non-point pollution [10], and carry out flood and hydrograph analysis [11].
The network of hydro meteorological observation in Devak basin does not exist and data are not available for systematic hydrologic studies. Many of the major streams remain dry during non-monsoon period and experience flash flood during rainy days. There are no gauge discharge sites on these streams. Therefore, geomorphological parameters of the basin may provide an alternative to establish relationships describing flow process of the network.
2. Study Area
Devak is a small tributary of Ujh river which is part of Ravi basin in the Western Himalayas. Its catchment lies between latitude 32° 30΄ to 32° 45΄ N and longitude 75° 00΄ to 75° 10΄E . The catchment is on the southern slope of lower Himalayas range in the Western Himalayas. The area of the catchment up to Gura Slathian is 97.27 km2, with its elevation varying from 343 m at the outlet to 840 m at the peak above mean sea level. From the farthest point the river travels for a length of 27.80 km up to the outlet. The major tributaries of the Devak River are Sangar wali khad, Plalaiwali khad and Karanalwali khad. No meteorological station is available in the catchment for measurement of rainfall and temperature. According to Gupta and Verma [12], Devak catchment consists of Siwalik Group sequence of molassic sediments. The sequence is divisible into three subgroups, i.e., the Lower, Middle and Upper Siwalik, and further five mappable litho units, namely the Mansar, Dewal, Mohargarh, Uttarbaini and Dughor formations from the base to the top.
3. Data Used
The following toposheets and remote sensing data are used in this analysis.
Survey of Indian toposheet No. 43 P/2 on 1:50000 scales (surveyed on 1977-79).
Cloud free digital data of IRS-1C, LISS-III of path 93 and row 48 of 13th October 1998.
4. Methodology
Using the above data of the catchment, its spatial database, i.e. Drainage Network, Digital Elevation Model and Landuse / Landcover have been generated in digital form. From which various physical characteristics of the catchment are derived and used in this analysis is described below.
4.1. Drainage Network
Base map of Devak catchment is prepared from the Survey of Indian (SOI) toposheets maps and drainage network details are mapped within the watershed divide. The drainage network derived from SOI topographic maps is digitized and drainage lines are superimposed on IRS-1C digital data. Digitized drainage pattern is compared with satellite observed drainage pattern and a corrected drainage map is finally prepared.
4.2. Digital Elevation Model
The contour map (20 m interval) and spot height map of the area are merged together and a composite map having information about contours as well as spot height is formed. This combined map is further interpolated at 20-metre pixel resolution using map interpolation function available in Integrated Land and Water Information System (ILWIS) to generate a DEM of the area. This DEM is further checked for flats and pits present in it. These flats and pits are then removed using iterative map calculation functions of ILWIS and final DEM is generated. Removal of flats and pits in a DEM is necessary to maintain continuity of water to the catchment outlet from any point inside the catchment. The DEM of the watershed is further analyzed to generate classified slope map and aspect map of the watershed.
5. Results and discussion
The linking of the geomorphological properties with the hydrological characteristics of the catchment provides a simple way to understand the hydrological behavior of the different catchments particularly of the ungauged catchment. Before taking up the studies related with hydrologic simulations using the geomorphologic properties, the important geomorphological properties have to be quantified from the available topographical map of the catchment. The geomorphological properties, which are important from the hydrological studies point of view, include the linear, aerial and relief aspect of the catchment. Computation of the parameters required for morphometric analysis using manual methods like area measurement using dot grid method or using planimeter and length measurement using curvimeter are very tedious and time consuming. It is more difficult if the map is on higher scale like 1:50,000 and 1:25,000. Stream ordering, lengths, area, perimeter, slope and aspect etc. can be systematically derived using Geographic Information System (GIS) technique. Use of GIS can not only make this task relatively easy but accurate as well. For quantification of various geomorphological parameters of Devak catchment, the derived drainage map (Fig 1A), DEM (Fig 1B), slope map (Fig 1C) and aspects map (Fig 1D) are used.
4.87, which should normally lie between 3 to 5, and can be used as an index of hydrograph shape for catchments. The average stream length ratio of the catchment is 2.03, it is useful in synthesizing hydrograph characteristics. Fig.2B shows stream length versus stream order. Fig 2C shows mean stream length versus order of streams. The plot shows the increasing trend in average length of the streams and it follows Horton’s law of stream length.
The various parameters (Table 2) of areal aspect of the basin defined by various workers are studied using the ILWIS GIS. Drainage density of the catchment is found to be 3.55 km2 / km. It is largely a function of climate, lithology, and stage of catchment development. The circularity and elongation ratio are found to be 0.43 and 0.55, respectively. The values of these dimensionless parameters approaches one as the shape of the catchment approaches a circle and the computed value of elongation ratio indicates that the catchment is having strong relief
and steep ground slopes. Fig 2D shows that mean drainage area versus stream order. It can be seen from the plot that the drainage network follows the Horton’s law of stream areas.
DEM provides a digital representation of a portion of the earth’s terrain over a two dimensional surface. DEMs have potentially proved to be a valuable tool for the topographic parameterization of hydrological models especially for drainage analysis, hill slope hydrology, watersheds, groundwater flow and contaminant transport etc.
Table 1 Linear characteristics of the Devak catchment
S.No Parameters Symbol Value
1 Basin Perimeter Lp 53.58 km.
2 Length of main stream L 27.80 km.
3 Length of Stream between the outlet
and a point near to centre of gravity Lc 13.08 km.
4 Basin length or Valley length Lb 20.08 km.
5 Stream length of each order L1 208.76 km.
L2 71.13 km.
L3 45.65 km.
L4 10.43 km.
L5 9.58 km.
6 Total stream length of all orders Lw 345.55 km. 7 Mean stream length of each order _
L1 0.59 km.
_
L2 1.09 km.
_ L3
2.85 km. _
L4 5.22 km.
_
L5 9.58 km.
8 Number of streams of each order N1 353
N2 65
N3 16 N4 02 N5 01 9 Total number of streams of all order Nw 437
10 Wandering ratio Rw 1.37
11 Fineness ratio (Melton, 1957) Rf 0.51
12 Basin Eccentricity 1.42
13 Bifurcation ratio Rb 4.87
14 Stream-length ratio Rl 2.03
Table 2Areal characteristics of the Devak catchment
S. No
.
Parameters Symb
ol Value
1 Total Drainage Area A 97.27 km2
2. Drainage Denisty D 3.55 km. / km2
3 Constant of Stream Maintenance (Schumm, 1956)
C 0.28 km2/ km. 4 Stream-Segment Frequency F 4.49 / km2 5 Drainage area of each order A1 56.48 km2.
A2 75.98 km2
A3 90.38 km2
A4 94.02 km2
A5 97.27 km2
6 Average drainage area of each
order A1 _ 0.16 km
2
_
A2 1.17 km
2
_
A3 5.64 km
2
_ A4
47.01 km2 _
A5 97.27 km
2
7 Area Ratio Ar 5.64 km2
8 Circularity Ratio Rc 0.43
9 Elongation Ratio Re 0.55
10 Basin Shape Factor Rs 2.47
11 Unit Shape Factor Ru 2.04
12 Form Factor Rf 0.24
13 Compactness coefficient Cc 1.53
Table 3 Slope characters of the Devak catchment
Slope in
percentage Area (Percentage of the total area) 0-2 17.54 km2 (18.39 %) 2-8 22.96 km2(24.08 %) 8-16 18.89 km2(19.81 %) 16-30 22.35 km2(23.44 %) >30 13.62 km2 (14.29 %) Table 4. Aspect characters of the Devak catchment
Table 5 Relief characteristics of the Devak catchment
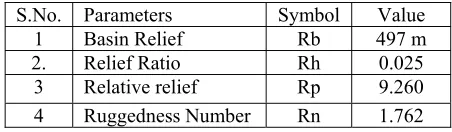
S.No. Parameters Symbol Value
1 Basin Relief Rb 497 m
2. Relief Ratio Rh 0.025
3 Relative relief Rp 9.260
4 Ruggedness Number Rn 1.762
6. Conclusions
An integrated approach where remote sensing and GIS techniques have been utilized for evaluation of catchment characteristics such as geomorphology, slope, aspect, landuse etc. Quantitative analysis of geomorphological parameters of the Devak catchment is carried out and various geomorphological parameters, which are important from the viewpoint of the hydrological studies, have been evaluated. The linking of the geomorphological parameters with the hydrological characteristics of the catchment provides a simple way to understand the hydrologic behavior of the different catchments.
Various thematic maps generated and geomorphological parameters, covering linear, areal and relief aspects, of Devak catchment have been evaluated. It is a fifth order catchment, covering an area of 97.27 km2. About 60% area of the total catchment falls within the 0-15% slope category while slope is very high greater than 33 % in its upper reaches.
In the Devak catchment there is no existing network of hydro meteorological observation. The estimated catchment characteristics and relationships may be useful to simulate hydrological response of the catchment.
Reference
[1] Abrahams, A.D.,1984, Channel networks: A geological perspective. Water Resour. Res. 20, pp.161-168.
[2] Singh, Nater., 1990, Geomorphology of Himalayan Rivers (A case study of Tawi basin), Jay Kay Book house, Jammu Tawi.
[3] Jensen, S. K., Domingue, J. O. (1988) Extracting topographic structure from digital elevation data for geographic information system
analysis. Photogrammetric Engineering and Remote Sensing, 54, 1593-1600.
[4] Quinn, P., Beven, K, J. (1993) Spatial and temporal predictions of soil moisture dynamics, runoff, variable source areas and
evapotranspiration for Plynlimon, Mid-Wales. Hydrological Processes, 7, 425-448.
[5] Tarboton, D. G., Bras, R. L., Rodriguez-Iturbe, I. (1991) On the extraction of channel networks from digital elevation data.
Hydrological Processes, 5, 81-100.
[6] Quinn, P., Beven, K., Chevallier, P., Planchon, O. (1995) The prediction of hillslope flow paths for distributed hydrological modeling
using digital terrain models. Hydrological Processes, 5, 59-79.
[7] De Roo, A. P. J., Jetten, V. G. (1999) Calibrating and validating the LISEM model for two data sets from the Netherlands and South
Africa. Catena, 37, 477-493.
[8] Takken, I., Jetten, V., Govers, G., Nachtergaele, J., Steegen, A. (2001b) The effect of tillage-induced roughness on runoff and erosion
patterns. Geomorphology, 37, 1-14.
[9] Ludwig, B., Daroussin, J., King, D., Souchere, V. (1996) Using GIS to predict concentrated flow erosion in cultivated catchments.
Proceedings of the HydroGIS 96: Applications of Geographic Information Systems in Hydrology and Water Resources Management held in Vienna, Austria, in April 1996, no. 235.
[10] Cluis, D., Martz, L., Quentin, E., Rechatin, C. (1996) Coupling GIS and DEM to classify the hortonian pathways of non-point sources
of the hydrographic network. Proceedings of the HydroGIS 96: Applications of Geographic Information Systems in Hydrology and Water Resources Management held in Vienna, Austria, in April 1996, no. 235.
[11] Olivera, F., Maidment, D. (1999) Geographic information systems (GIS)-based spatially distributed model for runoff routing. Water
Resources Research, 35, 1155-1164.
[12] Gupta, S.S. and Verma,B.C., 1988, Stratigraphy and vertebrate fauna of the Siwalik group mansar-utterbaini section, Jammu district,