F O R M U L A T IO N OF G E N E R A L R E L A T IV E P E R M E A B IL IT Y C O R R E L A T IO N OF F IE L D A
A B D U L H A K IM BIN B A S R I
Laporan ini dikemukakan sebagai memenuhi sebahagian daripada syarat penganugerahan
[jazah Sarjana Kejuruteraan Petroleum
Sekolah Kejuruteraan Kimia dan Kejuruteraan Tenaga Universiti Teknologi Malaysia
M EI 2019
“My dearest late father, mom, wife, family, Assoc. ProfZaidi andfriends”
This is for all of youACKNOWLEDGEMENT
First and foremost, I have to thank my supervisor, Assoc. Prof Zaidi. Without his assistance and dedicated involvement in every step throughout the process, this thesis would have never been accomplished. I would like to thank you very much for your support and understanding over this past one year.
Getting through my dissertation required more than academic support, and I have many, many people to thank for listening to and, at times, having to tolerate me over the process. Most importantly, none of this could have happened without my family. M y wife who always been very supportive. Every time I was ready to quit, you did not let me and I am forever grateful. This dissertation stands as a testament to your unconditional love and encouragement.
ABSTRAK
Data kebolehtelapan relatif amat penting untuk hampir semua pengiraan pengaliran bendalir dalam takungan dan digunakan secara meluas dalam banyak bidang kejuruteraan petroleum. Pengukuran kebolehtelapan relatif dilakukan pada sampel teras di makmal dan kedua-duanya memakan masa dan mahal untuk dihasilkan. Hasil daripada kesukaran dan kos yang terlibat dalam mengukur nilai kebolehtelapan relatif, kolerasi dan pengiraan empirik sering digunakan untuk menganggarkan nilai-nilai tersebut. Dalam bidang kajian yang merupakan Lapangan Minyak A, hanya terdapat satu data S C A L yang boleh didapati daripada satu takungan. Oleh itu, terdapat keperluan untuk merumuskan kolerasi am untuk digunakan dalam lapangan minyak yang dikaji atau lapangan minyak yang lain di lembangan melayu tanpa data SC A L. Penubuhan kolerasi tersebut telah menjadi matlamat utama penyelidikan ini. Tiga kolerasi yang diterbitkan telah dipilih untuk dianalisa dan dibandingkan untuk menentukan kolerasi yang paling sesuai untuk lapangan minyak yang dikaji. Penyelidikan bermula dengan pengumpulan data yang meliputi pemeriksaan kualiti data dan penapisan data. Analisi terperinci mengenai data dana rumusan kolerasi dijalankan. Tiga (3) kolerasi iaitu Corey, Chierici dan L E T telah dibandingkan dan dianalisa. Dari semua kolerasi, kolerasi Corey dan Chierici tidak cukup fleksibel untuk menyelaraskan keseluruhan set pemerhatian eksperimen. Kolerasi L E T mempamerkan fleksibiIiti untuk menyelaraskan seluruh set data eksperimen dengan memuaskan. Tingkah laku s dimodelkan dengan baik menggunakan kolerasi LET. Kolerasi ini telah dipilih dan diuji dalam model dinamik untuk menguji kesahihannya. Keputusan menunjukkan bahawa pemadanan kadar minyak dan air boleh diterima. Oleh itu, kolerasi ini telah diterima dan telah digunakan untuk menghasilkan lengkung kebolehtelapan relatif untuk takungan minyak lain di Lapangan Minyak A.
ABSTRACT
Relative permeability data are essential for almost all fluid flow calculations in reservoirs and are utilized extensively in many areas of petroleum engineering. Relative permeability measurements are conducted on core samples in laboratory and are both time-consuming and expensive to produce. As a result of the difficulties and cost involved in measuring relative permeability values, empirical correlations and calculations are often employed in order to estimate the values. In the field of study which is Field A, there is only one S C A L data available from a reservoir. Hence there is a need to formulate a general correlation to be used in the field of study or other fields in Malay basin with no or limited S C A L data. The establishment of such correlation will be the main objective of this research. The available S C A L data were manipulated and analyzed to create a suitable correlation to be used for other reservoirs. Three published correlations were chosen to be analyzed and compared to determine the most suitable correlations for the field under study. The research started with data collection which includes data quality checking and screening. Six (6) core samples for kro-krw and six (6) core samples for krg-kro was were used in this research. Then detailed analysis of the data and correlation formulation was conducted. Three (3) correlations which are Corey, Chierici and L E T were compared and analyzed. From all the correlations, Corey and Chierici correlations are not flexible enough to reconcile the entire set of experimental observations. L E T correlation exhibits flexibility to satisfactorily reconcile the entire set of experimental data. The s- behaviour is well modeled by L E T correlation. This correlation was chosen and tested in the dynamic model to test its validity. Results showed that acceptable matching of oil rate and water cut were obtained. Hence the correlations were accepted and will be used to generate pseudo-relative permeability curves for other hydrocarbon reservoirs in Field A.
CONTENT
DECLARATION ii DEDICATION iii ACKNOW LEDGEMENT xi ABSTRAK xii ABSTRACT xiii CONTENT xivLIST OF TABLES xvii
LIST OF FIGURES xix
ABBREVIATIONS xxii
LIST OF SYMBOLS xxiii
1 INTRODUCTION 1 1.1 Background 1 1.2 Problem Statement 4 1.3 Objectives 5 1.4 Scope of Study 6 1.5 Significance of Study 7 2 LITERATURE REVIEW 9
2.1 Concept of Relative Permeability 9
2.1.1 Relative Permeability 10
2.1.2 Factors affecting relative permeability 11 2.1.2.1 Wettability effect on relative
permeability 11
CHAPTER
TITLE
PAGE
2.1.2.2 Effect of fluid saturation and
saturation history 12
2.1.2.3 Effect of viscous and capillary
forces 12
2.2 Two-phase relative permeability 14
2.2.1 Relative Permeability parameters 15
2.2.1.1 EndPoints 15
2.2.1.2 Shape Factor 16
2.3 Estimating two-phase relative permeability 17
2.3.1 Lab Procedures 17
2.3.1.1 Centrifuge method 17
2.3.1.2 Two-phase steady state method 18 2.3.1.3 Two-phase unsteady state method
19 2.3.2 Correlations 20 2.3.2.1 Corey correlation 21 2.3.2.2 Chierici correlation 23 2.3.2.3 L E T correlation 24 2.4 Correlation Comparison 25
2.5 Software used for research 28
2.5.1 E C L IP S E 100 Reservoir Simulator 28 2.5.2 Petrel 2017 28 3 METHODOLOGY 31 3.1 Introduction 31 3.2 Data Collection 33 3.2.1 Data Source 33
3.2.2 Data Quality Checking 33
3.2.2.1 Data Screening 33
3.2.2.2 Relative Permeability Adjustment 33
3.2.2.3 End Points 34
3.3 Detailed Analysis and Correlation Formulation 34
3.3.1 End Points 34
3.3.2 Shape Factor 37 3.3.2.1 Corey 37 3.3.2.2 Chierici 38 3.3.2.3 L E T 39 3.4 Case Studies 40 3.5 Workflow Generation 41
4 RESULTS AND DISCUSSION 43
4.1 Data Collection 43
4.1.1 Data Source 43
4.1.1.1 Porosity and Permeability 45 4.1.1.2 Water-OiI Relative Permeability 51 4.1.1.3 Gas-OiI Relative Permeability 58 4.1.1.4 Capillary Pressure, Pc 64
4.1.2 Data Quality Checking 65
4.1.2.1 Data Screening 66
4.2 Detailed Analysis and Correlation Formulation 68
4.2.1 End Points 68 4.2.2 Shape Factor 81 4.2.2.1 Corey 81 4.2.2.2 Chierici 87 4.2.2.3 L E T 90 4.2.2.4 Correlations Comparison 93 4.3 Case Studies 95 4.4 Workflow Generation 101 4.4.1 Workflow Example 104 5 CONCLUSION 109 5.1 Conclusion 109 5.2 Recommendation 110 REFERENCES 111 xv i
LIST OF TABLES
TABLE NO.
TITLE
PAGE
Table 2-1: Oil Water Corey Exponent with Wettability (McPhee, Reed, &
Zubizarreta, 2015) 22
Table 2-2: Another Oil Water Corey Exponent versus Wettability (Stiles, 2013) 23 Table 4-1: Porosity and Permeability for Plug samples used in Special Core Analysis
46
Table 4-2: Sample No. 21A kro-krw 52
Table 4-3: Sample No. 25A kro-krw 53
Table 4-4: Sample No. 35A kro-krw 54
Table 4-5: Sample No. 43A kro-krw 55
Table 4-6: Sample No. 47A kro-krw 56
Table 4-7: Sample No. 51A kro-krw 57
Table 4-8: Sample No. 21D kro-krg 59
Table 4-9: Sample No. 25D kro-krg 60
Table 4-10: Sample No. 35D kro-krg 61
Table 4-11: Sample No. 47D kro-krg 62
Table 4-12: Sample No. 51D kro-krg 63
Table 4-15: Capillary Pressure, Pc Data 64
Table 4-13: Table of end points for the water-oil samples 66 Table 4-14: Table of end points for the gas-oil samples 67
Table 4-16: End-Points Correlations Summary 81
Table 4-17: Sample 25A Normalized Relative Permeability 82 Table 4-18: Sample 35A Normalized Relative Permeability 83 Table 4-19: Sample 43A Normalized Relative Permeability 83 Table 4-20: Sample 51A Normalized Relative Permeability 84
Table 4-21 Corey Relative Permeability Table 86
Table 4-22 Chierici Relative Permeability Table 89
Table 4-23 LET Relative Permeability Table 92
Table 4-24 RQI Range Selected 96
Table 4-25 End Point Values for each RQI Ranges 96
Table 4-26 Relative Permeability Table (1) 104
Table 4-27 Relative Permeability Table (2) 105
Table 4-28 Relative Permeability Table (3) 106
Table 4-29 Relative Permeability Table (4) 107
LIST OF FIGURES
Figure 1-1: Example of Oil-Water Relative Permeability Curve 2 Figure 1-2: Illustration of two-phase reservoir system 3 Figure 2-1: Two-phase relative permeability curves (Ahmed, 2006) 14 Figure 2-2: Schematic of steady state displacement experiment for water-oil system
19 Figure 2-3: Schematic of unsteady state displacement experiment for water-oil
system 20
Figure 2-4: History match of differential pressure (Lomeland et a I., 2005) 25 Figure 2-5: History match of production (Lomeland et al., 2005) 26 Figure 2-6: Relative permeability curve (Lomeland et al., 2005) 26 Figure 3-2: Relative Permeability curve endpoints for Oil-Water System 36 Figure 3-3: Relative Permeability curve endpoints for Oil-Gas System 36
Figure 4-1: Sampling point in the open hole logs 44
Figure 4-2: Sampling point in the core slab 44
Figure 4-3: Poro Perm Plot by Facies 50
Figure 4-4: Sample No. 21A kro-krw 52
Figure 4-5: Sample No. 25A kro-krw 53
Figure 4-6: Sample No. 35A kro-krw 54
Figure 4-7: Sample No. 43A kro-krw 55
Figure 4-8: Sample No. 47A kro-krw 56
Figure 4-9: Sample No. 51A kro-krw 57
Figure 4-10: Sample No. 21D kro-krg 59
Figure 4-11: Sample No. 25D kro-krg 60
Figure 4-12: Sample No. 35D kro-krg 61
FIGURE NO.
TITLE
PAGE
Figure 4-13: Sample No. 47D kro-krg 62
Figure 4-14: Sample No. 51D kro-krg 63
Figure 4-17: Pc vs Sw Plot 65
Figure 4-15: kro-krw Comparison Plot 66
Figure 4-16: kro-krg Comparison Plot 67
Figure 4-18: Swi vs Porosity 68
Figure 4-19: Swi vs Permeability 69
Figure 4-20: Swi vs RQI 69
Figure 4-21: Sorw vs Porosity 70
Figure 4-22: Sorw vs Permeability 70
Figure 4-23: Sorw vs Rock Quality Index 71
Figure 4-24: Sorg vs Porosity 72
Figure 4-25: Sorg vs Permeability 72
Figure 4-26: Sorg vs Rock Quality Index 73
Figure 4-27: krorwvs Porosity 74
Figure 4-28: krorwvs Permeability 74
Figure 4-29: krorw vs Rock Quality Index 75
Figure 4-30: krorw vs Porosity 75
Figure 4-31: krorw vs Permeability 76
Figure 4-32: krorw vs Rock Quality Index 76
Figure 4-33: krwr vs Porosity 77
Figure 4-34: krwr vs Permeability 78
Figure 4-35: krwr vs Rock Quality Index 78
Figure 4-36: krgr vs Porosity 79
Figure 4-37: krgr vs Permeability 79
Figure 4-38: krgr vs Rock Quality Index 80
Figure 4-39: O-W Relative Permeability Plot for all samples 85 Figure 4-40: Corey Normalized O-W Relative Permeability Plot 85 Figure 4-41: Corey Normalized (semilog) O-W Relative Permeability Plot 86 Figure 4-42: Chierici Normalized O-W Relative Permeability Plot 88 Figure 4-43: Chierici Normalized (semilog) O-W Relative Permeability 89 Figure 4-44: L E T Normalized O-W Relative Permeability Plot 91 Figure 4-45: L E T Normalized (semilog) O-W Relative Permeability 92
Figure 4-46: Correlation comparison - Normalized O-W Relative Permeability Plot 94 Figure 4-47: Correlation comparsion- Normalized (semilog) O-W Relative
Permeability 95
Figure 4-48: Relative Permeability Plot for each RQI Ranges 97
Figure 4-49: A01, A02 and A03 Swi Matching 97
Figure 4-50: A04 and A05 Swi Matching 98
Figure 4-51: W ell A-01 History Matching 99
Figure 4-52: W ell A-02 History Matching 99
Figure 4-53: W ell A-03 History Matching 100
Figure 4-54: W ell A-04 History Matching 100
Figure 4-55: W ell A-05 History Matching 101
Figure 4-56: Relative Permeability workflow 103
Figure 4-57: kro-krw Plot 108
ABBREVIATIONS
S C A L R C A RQI
Special Core Analysis Routine Core Analysis Rock quality index
LIST OF SYMBOLS
k - Permeability
kro - Relative permeability of oil krw - Relative permeability of water krg - Relative permeability of gas Swi - Irreducible water saturation Sgc - Critical gas saturation Sorw - Residual oil saturation Sorg - Residual oil saturation to gas
Q - Fluid flowrate A - Cross-sectional area dp/dl - Pressure gradient \i - Viscosity cp - Centipoise Nc - Capillary number g - Interfacial tension
9 - Rock porosity in fraction Swn - Normalized water saturation kair - Permeability to air
krin - Normalized relative permeability kro-krw - Oil-water relative permeability krg-kro - Gas-oiI relative permeability
CHAPTER 1
INTRODUCTION
1.1 Background
Permeability is a property of the porous medium that measures the capacity and ability of the formation to transmit fluids (Ahmed, 2001). The rock absolute permeability, often given the symbol k is a very important rock property because it controls the directional movement and the flow rate of the reservoir fluids in the formation. If it takes a lot of pressure to squeeze fluid through a rock, that rock has low permeability. If fluid passes through the rock easily, it has high permeability.
Relative permeability, a dimensionless quantity, is the ratio of effective permeability to absolute permeability. Relative permeability is a crucial empirical parameter in describing the flow of multiple immiscible fluids within a porous medium (Honarpour and Mahmood, 1988).
E f f e c t i v e Permeability, k o / k w / k g
Relative P e r m e a b i l i t y , k r o / k r w / k r g
= --- -— ---— ------Absolute Permeability, k
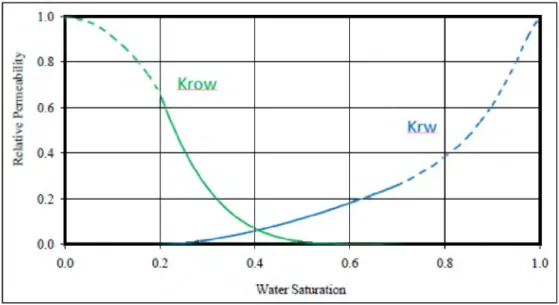
The relative permeability to one phase changes with the relative saturation of that phase. It is equal to one at 100% saturation of the phase and gradually decreases to reach zero at the critical or irreducible saturation of that phase. Figure 1.1 shows the general oil water relative permeability curve.
Figure 1-1: Example of Oil-Water Relative Permeability Curve
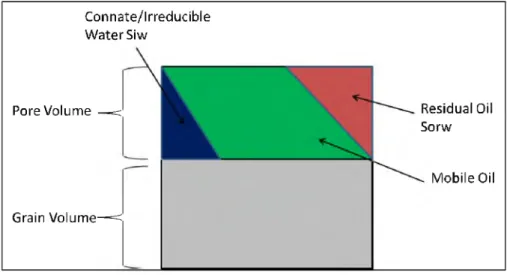
In hydrocarbon reservoirs, no one phase can reach the saturation of 100%. Consequently, in a multiphase system, the relative permeability of any phase cannot reach the value of one. However, most core analysis laboratories evaluate the relative permeability as referenced to the maximum effective permeability of the oil phase rather than referencing to the porous medium's absolute permeability. This leads to reporting the value of one for the maximum relative permeability to the oil phase. In any reservoir study, this should be noticed and all relative permeability values should be adjusted before further proceeding. In two-phase system, the fluids consists of oil and water, oil and gas or gas and water, while in three-phase system, the fluids consists of oil, water and gas. An example of an oil-water system is shown in Figure 1-2.
Connate/Irreducible W ater Siw
Pore Volume — < Residual Oil
Sorw
Mobile Oil Grain Volum e^=i
Figure 1-2: Illustration of two-phase reservoir system
Relative permeability data are essential for almost all fluid flow calculations in reservoirs and is utilized extensively in many areas of petroleum engineering such as determining the residual fluid saturations, calculating the fractional flow and frontal advance and making engineering estimates of productivity, injectivity and ultimate recovery. The data are more particularly used for matching, predicting and optimizing oil and gas reservoir performances through numerical simulations.
Relative permeability measurements are conducted on core samples in laboratory and are both time-consuming and expensive to produce. Consequently, relative permeability measurements are mainly requested for projects where secondary and/or tertiary recovery is being considered. As a result of the difficulties and cost involved in measuring relative permeability values, empirical correlations and calculations are often employed in order to estimate the values. In the past decades, several correlations have been developed to predict relative permeability of oil reservoirs. In 1954, Corey introduced a correlation to estimate relative permeability of water-oil and gas-oil systems, based on relative permeability measurements on a large number of cores from several formations. Honarpour, Koederitz and Harvey (2000) utilized the relative permeability data obtained from oil and gas fields in various parts of the world, to develop a new correlation for prediction of relative permeabilities. Chierici (1984) suggested a two-parameter exponential relationship to predict relative permeabilites of water-oil and gas-oil systems. In the current study, these three
correlations are used and compared. Fine tuning of the correlation might be done to fit the field of study.
Analysis done by Cocco (2002) concluded that each depositional environment has its distinct relative permeability correlations. There are differences in the average values and variances, as well as in the strength of the correlations between the variable. Hence it is necessary to sample core plugs in the reservoir under study. Relative permeability also depends on a combined effect of pore geometry, fluid distribution, wettability, and fluid saturation (Okasha, Funk and Balobaid, 2001). Hence relative permeability is unique to the field or regions. This study was conducted to formulate the most suitable correlations for the field of study.
1.2 Problem Statement
Relative permeability is one of the most essential parameters in reservoir engineering studies. In reservoir simulation, relative permeability is the parameter used by reservoir simulators to define the relative movements of different reservoir fluids. The concept of relative permeability is quite simple. However, proper evaluation is not an easy task. Relative permeability is evaluated in laboratory as part of the S C A L (Special Core Analysis) program. Both steady and unsteady state displacement are used to evaluate relative permeability at different saturation values. These measurements are being carried out on small core plugs obtained from the available whole cores. In addition to lab work uncertainties, core coverage is an important factor that affects the reliability of the evaluated relative permeability. Due to operation concerns, it is very difficult to have adequate core coverage for any reservoir. Strict precautions and high costs make it even more difficult to obtain adequate coverage of SC A L. These factors raise the importance of careful and effective handling of the available S C A L data to obtain reasonably representative relative permeability data for any reservoir study.
Since obtaining relative permeability data from laboratory experiments is rather delicate, time consuming, and costly, a series of empirical models has been
developed in literature to estimate them when experimental data from core samples is not available. The empirical correlations are also employed to reproduce experimentally determined relative permeability curves as verification. These methods were based on experimental data and mathematical derivations or heuristic concepts to predict relative permeability.
In the field of study, there is only one S C A L data available from a reservoir. Hence there is a need to formulate a general correlation for other reservoirs in the field. The available S C A L data can be manipulated and analysed to create a suitable correlations to be used for other reservoirs. Since relative permeability is such a strong controlling factor in determining reservoir performance, accurate determination of water-oil and gas-oil relative permeability character for a formation matrix is essential for accurate prediction and optimization purposes. Although a variety of correlations to predict relative permeability are available, considerable variance can be present in the predicted results, and experimental measurements still provide the most accurate method of determination. Three published correlations were chosen to be analysed and compared to determine the most suitable correlations for the field of study. Fine tuning of the correlations might be done if none of the correlations satisfy the criteria. There is also no general workflow of formulating the relative permeability correlation available. Hence a general workflow will be generated in the study for the use of other users.
1.3 Objectives
The main objectives of this study are:
i) To develop a general relative permeability correlation to be used in the field of study or other fields in Malay Basin with no or limited S C A L data.
ii) To establish a workflow in order to guide users on proper way of formulating relative permeability correlations.
iii) To perform a case study whereby the correlation formulated is applied in a specific field.
1.4 Scope of Study
i) Data collection and quality checking
a. Six (6) core samples for kro-krw (labelled as 21 A/2 5 A/3 5 A/4 3 A/4 7 A/51 A).
b. Six (6) core samples for krg-kro (labelled as 21 D/2 5 D/3 5 D/4 3 D/51 D).
ii) Detailed analysis and correlation formulation
a. Finding a trend using few properties to find endpoints general formula to be used in the correlation.
b. Three correlations were generated and analysed based on the published papers.
c. Fine tuning the generated correlations to fit the field of study.
iii) Correlation workflow generation
a. Detail workflow was generated for formulating general relative permeability correlation.
iv) Field application
a. Formulated correlation was applied and tested in a reservoir in the field of study to prove concept.
1.5
Significance of Study
i) Relative permeability is essential for dynamic simulation to forecast the reservoir performance more effectively.
ii) The formulated relative permeability correlation can be used in other reservoirs in the field having limited or no S C A L data.
iii) The generated workflow can be used as a guide for other users in formulating the correlations in other regions.
REFERENCES
Abaci, S. and Edwards, J.S. (1992). Relative Permeability Measurements for Two Phase Flow in Unconsolidated Sands. M ine Water and The Environment. 11 (June), 11-26. Agnia, A., Algdamsi, H.A., Idrees, M. and Mossawy, A. (2014). Oil -Water Relative
Permeability Data for Reservoir Simulation Input, Part-I: Systematic Quality Assessment and Consistency Evaluation. International Petroleum Technology Conference.
Ahmed, T. (2001). Reservoir Engineering H andbook Second., Gulf Professional Publishing. Akbarabadi, M. and Piri, M. (2015). Co-sequestration of S02with supercritical C02in
carbonates: An experimental study of capillary trapping, relative permeability, and capi I lary pressure. Advances in Water Resources. 77, 44-56.
Anderson, W .G. (1987). Wettability Literature Survey-Part 6: The Effects of Wettability on Waterflooding. Journal o f Petroleum Technology. 39(12), 1605-1622.
Bennion, B. and Bachu, S. (2006). The Impact of Interfacial Tension and Pore-Size
Distribution/Capillary Pressure Character on C02 Relative Permeability at Reservoir Conditions in C02-Brine Systems. Society o f Petroleum Engineers Journal. (SPE 99325).
Blom, S.M.., Hagoort, J. and Soetekouw, D.P.N. (1997). Relative Permeability at Near- Critical Conditions. Society o f Petroleum Engineers Journal. (SPE 38935).
Chierici, G.L. (1984). Novel Relations for Drainage and Imbibition Relative Permeabilities. Society o f Petroleum Engineers Journal. 24 (03), 275-276.
Christiansen, R.L. and Howarth, S.M. (1995). Literature Review and Recommendation of Methods for Measuring Relative Permeability of Anhydrite from the Salado Formation at the Waste Isolation Pilot Plant. (August).
Cocco, M.J. (2002). Effects of relative permeability on parameter estimation. Stanford University.
Corey, A.T. (1954). The Interrelation Between Gas and Oil Relative Permeabilities. Dake, L.P. (2001). Fundamentals o f Reservoir Engineering, Shell Learning and
Development.
Dandekar, A.Y. (2013). Petroleum Reservoir Rock & F luid Properties Second., CRC Press. Falode, O. and Manuel, E. (2014). Wettability Effects on Capillary Pressure, Relative
Permeability, and Irredcucible Saturation Using Porous Plat e. Journal o f Petroleum Engineering. 2014,1-12.
Green, D.W. and Willhite, P.G. (1998). Enhanced Oil Recovery Vol. 6., Richardson, Texas: S P E Textbook Series.
Gupta, R. and Maloney, D. (2015). Applications of the Intercept Method To Correct Steady- State Relative Permeability for Capillary End-Effects. Symposium o f The Society o f Core Analysts.
Hamouda, A.A., Karoussi, 0. and Chukwudeme, E.A. (2008). Relative permeability as a function of temperature, initial water saturation and flooding fluid compositions for modified oil-wet chalk. Journal o f Petroleum Science and Engineering. 63(1-4), 61- 72.
Honarpour, M., Koederitz, L. and Harvey, A.H. (2000). Relative perm eability ofpetroleum reservoirs,
Honarpour, M. and Mahmood, S.M. (1988). Relative-PermeabiIity Measurements: An Overview. Journal o f Petroleum Technology. 40(08), 963-966.
Ibrahim, M.N.M. and Koederitz, L.F. (2000). Two-Phase Relative Permeability Prediction Using a Linear Regression Model. SPE Eastern Regional Meeting. (SPE 65631). Kulkarni, K.N. and Datta-Gupta, A. (2000). Estimating Relative Permeability From
Production Data: A Streamline Approach. SPE Journal. 5(4), 402-411.
Kulkarni, R., Ted Watson, A. and Nordtvedt, J.-E. (2008). Estimation of Porous Media Flow Functions Using N M R Imaging Data. 16(98), 707-709.
Kumar, M. and Do, T.N. (1990). Effects of Endpoint Saturations and Relative Permeability Models on Predicted Steamflood Performance. Society o f Petroleum Engineers
Journal. (SPE/DOE 20202).
Li, H., Yang, D. and Arhuoma, M. (2010). Relative Permeability Estimation from Displacement Experiments Using EnKF Method. International Oil and Gas Conference and Exhibition in China, 8-10 June, Beijing, China. (1998).
Loeve, D., Wilschut, F., R.H., H., Maas, J.G., van Hooff, P.M.E., van den Hoek, P.J., Douma, S.G. and Van Doren, J.F.M . (2011). Simultaneous Determination of Relative Permeability and Capillary Pressure Curves By Assisted History Matching Several Seal Experiments. International Symposium o f the Society o f Core Analysts., 1 -12.
Lohne, A. and Virnovsky, G. (2006). Three-phase upscaling in capillary and viscous Limit. Proceedings o f SPE/DOE Symposium on Im proved Oil Recovery. (Cl), 1-14.
Lomeland, F., Ebeltoft, E., Thomas, H.W. and Stavanger, S.A. (2005). A new versatile relative permeability correlation. International Symposium o f the Society o f Core Analysis., 1-12.
Modaresghazani, J. (2015). Experimental and Simulation Study o f Relative Permeabilities in Heavy Oil/Water/Gas Systems.
Okasha, T.M., Funk, J.J. and Balobaid, Y.S. (2001). Wettability and Relative Permeability of Lower Cretaceous Carbonate Rock Reservoir, Saudi Arabia. Society o f Petroleum Engineers Journal. (June 2015), 1 -13.
Reynolds, C.A. and Krevor, S. (2015). Characterizing flow behaviour for gas injection: Relative permeability of C02-brine and N2-water in heterogeneous rocks. Water Resources Research. (51), 5974-5997.
Saeedi, M. and Pooladi-Darvish, M. (2011). Revisiting the Drainage Relative Permeability Measurement by Centrifuge Method Using a Forward-backward Modeling Scheme. Transport in Porous Media. 86 (1), 49-71.
Ted Watson, A., Kulkarni, R., Nordtvedt, J.E., Sylte, A. and Urkedal, H. (1998). Estimation of porous media flow functions. Measurement Science and Technology. 9(6), 898-905. Tiab, D. and Donaldson, E.C. (2014). Petrophysics: Theory and Practice o f M easuring
Reservoir Rock and F luid Transport Properties, Gulf Professional Publishing.
Toth, J., Bodi, T., Szucs, P. and Civan, F. (2005). Determining Relative Permeability From Unsteady-State Radial Fluid Displacements. Proceedings o f SPE Annual Technical Conference and Exhibition., 1-9.
Weifeng, L., Zubo, Z., Qingjie, L., Desheng, M. and Kangyun, W . (2012). Measurement fo Three-Phase Relative Permeabilities of Various Saturation Histories and Wettability Conditions. International Symposium o f the Society o f Core Analysis. (SCA2012-43), 1-6.
Yuqi, D., Bolaji, O.B. and Dacun, L. (2004). Literature Review on Methods to Obtain Relative Permeability Data. (1), 597-604.