Using Data Mining in Educational Administration - A
Case Study on Improving School Attendance
Raymond Moodley1 , Francisco Chiclana1,2 , Jenny Carter3 and Fabio Caraffini1∗
1 Institute of Artificial Intelligence, De Montfort University, Leicester, UK;
[email protected], [email protected], [email protected]
2 Andalusian Research Institute on Data Science and Computational Intelligence (DaSCI), University of Granada, 18071 Granada, Spain
3 Department of Computer Science, University of Huddersfield, Queensgate, Huddersfield, UK; [email protected]
* Correspondence: [email protected] Version April 27, 2020 submitted to Appl. Sci.
Abstract: Pupil absenteeism remains a significant problem for schools across the globe with its 1
negative impacts on overall pupil performance being well-documented. Whilst all schools continue 2
to emphasize good attendance, some schools still find it difficult to reach the required average 3
attendance, which in the UK is 96%. A novel approach is proposed to help schools improve attendance 4
that leverages the market target model, which is built on association rule mining and probability 5
theory, to target sessions that are most impactful to overall poor attendance. Tests conducted at Willen 6
Primary School, in Milton Keynes, UK, show that significant improvements can be made to overall 7
attendance, attendance in the target session, and persistent (chronic) absenteeism, through the use 8
of this approach. The paper concludes by discussing school leadership, research implications, and 9
highlights future work which includes the development of a software program that can be rolled-out 10
to other schools. 11
Keywords: Educational Data Mining; Association Rule Mining; Improving School Attendance;
12
Persistent Absenteeism. 13
1. Introduction
14
Pupil attendance remains a key focus for schools, local authorities and national governments 15
across the world as a result of its strong, positive correlation with pupil attainment, pupil well-being 16
and improved economic outcomes for pupils later in life [1–3]. In the UK, the Department for
17
Education (DfE) has strict policies on school attendance with legal obligations for both parents, 18
which also includes guardians in this study, and schools [4]. Parents are legally obliged to send their 19
children to school and ensure regular attendance, while schools have a legal duty to take the necessary 20
steps and have policies in place to effectively manage pupil attendance [4]. In this regard, there is 21
a significant requirement from schools to be proactive on attendance management as they must: 22
accurately record attendance, proactively follow-up with parents on all absences, and put initiatives in 23
place to manage and encourage good attendance [4]. 24
25
As further clarified in section2.2.1, the underlying reasons as to why pupils are absent from school 26
have been well-studied and generally fall into one, or more, of three categories being 1) unable to 27
attend school due to other obligations (e.g. illness, carer duties, family instability); 2) avoiding school 28
due to fear, embarrassment, boredom (e.g. being bullied) and 3) pupil/family do not place value in 29
schooling and/or have other activities that they would rather do, e.g. taking a vacation, or high levels 30
of illiteracy within the family [1,5]. To this end, strategies for managing absenteeism (predominantly 31
qualitative) have also been well-studied with models, frameworks and initiatives for improving school 32
attendance being proposed and evaluated [1–3,5]. The quantitative approaches involving school 33
attendance has primarily been seen as a task within the Educational Data Mining (EDM) branch of 34
research, where the key objective is to improve pupil performance through the use of data mining and 35
artificial intelligence (AI) techniques [6]. Indeed, there have been several models proposed to predict 36
pupil outcomes, however, attendance has typically been used as an input variable for these models as 37
opposed to being a key focus area [6–10]. 38
39
The case for increased use of data analytics and AI to improve attendance has been well-made, 40
however very little use-cases and readily available analytics models exist that can be easily adopted by 41
school practitioners to improve school attendance [1,2]. Further, most school practitioners are new 42
to data analytics and have no previous data science background. Despite the current availability of 43
training and certification courses, it is often challenging for practitioners to develop their models 44
and algorithms to conduct a deep analysis of data [11]. It is against this backdrop that this study 45
aims to provide school practitioners with a simple, yet effective model to improve school attendance 46
by identifying and acting on attendance patterns that are not obvious to extrapolate without data 47
analytic skills. The proposed model was applied to a live setting using Willen Primary School (WPS), a 48
local authority-maintained primary school in Milton Keynes, UK, as a case study. In principle, the 49
approach, findings and recommendations from this study can be leveraged by other schools wanting 50
to improve pupil attendance. In this regard, intervention programs may have to be adapted to cater 51
for the school’s specific circumstances. 52
53
The remainder of the paper is divided as follows: An overview of the relevant literature is provided 54
in Section2followed by a detailed description of the problem statement and development of the
55
underlying analytical model in Section3. The research methodology is outlined in Section4, with 56
a presentation of the results and discussion in Section5. Finally, conclusions and future work are 57
detailed in Section6. 58
2. Literature Review
59
2.1. Educational Data Mining 60
The definition of EDM in [11] accurately surmises the approach of using what was
61
once commercial data mining techniques to improving outcomes in education, including 62
government-sponsored education. EDM, according to [11], “seeks to analyse educational data
63
repositories to better understand learners and learning and to develop computational approaches that 64
combine theory and data to transform practice to benefit learners”. Similar definitions for EDM were 65
provided in [12] and [13] where EDM is defined as a knowledge extraction process where valuable 66
insights are obtained from data originating from an educational setting. In this regard, EDM may 67
be compared to commercial techniques like Market Basket Analysis (MBA), which is in essence, a 68
technique that leverages data analytics on customer transaction data to enhance customer engagement, 69
and transaction intensity within the retail sector [6,14–16]. 70
71
The popular MBA techniques of Clustering and Association Rule Mining (ARM) have been widely 72
used in EDM in a variety of contexts. Daniel, in [14], Merceron et al., in [15], and Weng, in [13], 73
noted that ARM has been very useful in educational applications such as: finding mistakes that are 74
commonly made together by students, making recommendations to students on e-learning course 75
choices, and finding associations in behavioural patterns of students. Similarly in [17], ARM was 76
used to find factors that influenced student performance in courses, with the study concluding that 77
student performance was directly correlated to attention in class (including attendance), completing 78
assignments and good note-taking. 79
80
Clustering has also been widely used in education with success. In their review of clustering within 81
EDM, Dutt et al., in [18], discussed the various educational contexts in which clustering was used 82
including: using K-Means clustering to improve learning by grouping students with similar learning 83
styles; and clustering brain scans of students who showed similar responses to learning into groups 84
and targeting each group differently to improve learning. Similarly, clustering was also used to 85
understand student behaviour in online learning environments by comparing sequential student data 86
and leveraging a clustering algorithm to group like-minded students [19]. It should be noted that while 87
clustering does have its place, it needs to be done carefully within the government schooling sector as 88
it may be perceived by some parents as unfairly “targeting” groups of pupils, which is generally not 89
the case [20]. 90
2.2. School Absence 91
There exists a myriad of terms used to describe school absence which helps focus diagnoses so 92
that targeted plans could be put in place to address their underlying causes [1,3,4,21]. While some 93
absences may be seen as acceptable, in the UK, schools have become tough on all absences irrespective 94
of their reason, as they are equally destructive to learning [1,4]. Authorised absence, defined as an 95
acceptable absence approved by the school (e.g. illness or bereavement) is typically granted, but 96
schools have become wary of its abuse, particularly close to ending of term, when parents want to 97
capitalise on cheaper holidays without incurring fines [4,22,23]. On the other hand, unauthorised 98
absence (absent without permission) has received widespread condemnation from lawmakers and 99
education non-profit organisations, with several cases being trailed in court, or parents being fined in 100
line with the local authority and national government policy [4,22,23]. 101
102
The concepts of school refusal (SR) and truancy form part of unauthorised absence and has been 103
well-outlined in [3] and [21], with SR defined as non-attendance due to the expectance of strong 104
negative emotions while at school (e.g. fear as a result of bullying, embarrassment as a result of being 105
teased or separation anxiety), while truancy is related to anti-schooling sentiments (without parental 106
consent) including finding school boring or finding activities outside of school more attractive (e.g. 107
going to the cinema during school time). School withdrawal (e.g. taking time off to go on holiday) 108
is similar to truancy but with parental consent, and is generally very difficult to address once it 109
becomes excessive as it usually requires multi-agency involvement that focuses on the family as well 110
as the pupil [5]. The notion of persistent absence or chronic absence has also been well-studied, with 111
the definition in the UK being: where a pupil is absent from school for 10% or more, irrespective 112
of the reason [1,22]. Persistent absenteeism is being well-tracked by schools and local authorities 113
in the UK, with initiatives and policies put in place to deal with the problem as it arises [4,22]. 114
However, the situation is not the same in some other developed countries, and is often overlooked 115
and wreaks havoc long before the problem is diagnosed [1]. In the U.S. for example, Balfanz and 116
Byrnes, in [1], noted that chronic absenteeism is largely unmeasured and hence not noticed. The 117
authors further point out that only a few states and cities in the U.S. measure chronic absenteeism, 118
and even when it is measured, the metric of average daily attendance for the entire school “masks 119
more than it reveals”. Left unchecked, chronic absenteeism eventually leads to a disengagement 120
with education and results in poor career prospects for the pupil, and most likely a future of poverty [1]. 121
122
Separation anxiety or in its more severe form, Separation Anxiety Disorder (SAD), is a type of school 123
refusal and has been well-documented in [24]. SAD is common among young children (up to 1 in 20 124
children suffer from SAD) and is defined as the fear of leaving the safety of parents or caregivers [24]. 125
Children experiencing SAD often present with tantrums, panic attacks or bad behaviour and can have 126
a significant negative impact on the child’s academic, social and physiological development [24,25]. 127
Indeed, separation anxiety is most common after children have spent long spells with their parents or 128
caregivers and is common after weekends or holidays, and may also present every morning in some 129
children after they have spent the previous afternoon and night with parents or caregivers [24,25]. 130
2.2.1. Why are pupils absent? 131
There is broad consensus by researchers as to why pupils do not attend school, and the underlying 132
causes for absence fall into three categories [1,5] which are indeed very large by themselves: 133
1. unable to attend school due to other obligations; 134
2. avoiding school (school refusal); 135
3. pupil/ family do not place value in schooling (and/ or have other activities that they rather do). 136
This notion of not placing value in schooling has been further separated intotruancy, i.e. pupils 137
staying away from school without parental knowledge, and school withdrawal, also known as parental 138
condoned absence, i.e. parents condone the absence as it proves beneficial to them or the family at 139
large [21]. Given the vast array of underlying causes, researchers have tended to become more specific 140
in examining the problem of absence. In [3] the focus was on school refusal and truancy with peer 141
relationships and classroom management by teachers as underlying causes. In this regard, Havik 142
et al. [3] found that both good peer relationships and effective classroom management had strong 143
positive correlations with good attendance. Similarly, tackling truancy and parental beliefs (as part of 144
school withdrawal) were the key focus areas of in [2] and [5] respectively, with both studies showing 145
that there is a strong positive correlation with good attendance and effective, regular communication 146
between school and home. 147
2.2.2. Impacts of absence 148
Balfanz and Byrnes, in [1], were firm in their conclusions that “missing school matters”, noting 149
that in the US, missing school impacted academic achievement irrespective of age and that those that 150
were from low-income backgrounds were more impacted by absence as they were less likely to have 151
provisions at home to make up for the lost time. In the UK, similar sentiments were echoed in [4] and 152
[22] with respect to absence, including more long term impacts on the pupil, such as social anxiety 153
and lack of self-confidence, both of which are known pre-cursors to interrupted employment and 154
consequently lower economic attainment in adulthood [1,21,25]. Whilst these are all significant impacts 155
in their own right, the key impact of absence, which was noted across several studies including in 156
[1,2,4,22] and [5], was the long term disengagement with education which not only impacted the pupil 157
in adulthood but also created the foundation for a vicious cycle when these pupils become parents and 158
project their negative attitudes towards education onto their children. 159
2.2.3. Improving attendance 160
The conceptual framework proposed in [26] for designing interventions to improve attendance 161
is both relevant and very useful. The proposed three-tier framework targeted all pupils along the 162
absenteeism spectrum with tier 1 strategies focussed on pupils with emerging attendance problems, 163
whilst tier 2 focussed on pupils that are at risk of being persistently absent, and tier 3 on those that are 164
already persistently absent. The overall approach of this framework emphasizes early identification 165
and treatment, rather than a sole focus on those that are already persistently absent. 166
167
This approach is well-recognised and several studies have operationalised this framework in varying 168
depths [1,2,4,22]. In [4] and [22], which are relevant to the UK context, guidelines suggest that all 169
absenteeism should be tackled with context-specific approaches that include using data analytics, 170
working with parents, using incentives, and enforcing fines. Similarly, the Early Truancy Prevention 171
Program (ETPP) introduced in [2] proposed a five-step approach, all of which required the teacher to 172
be proactive, and work actively with parents to drive-up attendance. Pilot tests using the ETTP did 173
show a significant improvement in attendance [2], however, most initiatives were time-intensive and 174
required teachers and school administrators to spend a large amount of time working with parents on 175
an ongoing basis. This is not practical in the UK, because teachers are already stretched, and school 176
budgets are being squeezed [27]. Efforts to improve attendance in [1] were underpinned by offering 177
both short-term and long term rewards through local and national/ state campaigns. At a local level, 178
schools offered rewards for pupils who attended regularly that were more meaningful to pupils and 179
included fun activities like dance and diplomas for completing short courses. While at a national level, 180
school attendance was stressed by senior political figures and “success mentors” who were largely 181
celebrities that attributed their success to regular school attendance [2]. 182
3. Problem Statement and Analytical Model
183
3.1. Problem Statement 184
It is well-documented that providing pupils with the right incentives to attend school results in 185
improved attendance, and consequently improved pupil attainment and progress [1,4]. Given this, the 186
problem being addressed by this study may be stated as follows: LetSbe a school with all its pupils, 187
U. Let the school week, J, be divided intomdistinct sessions,Ji, such that Ji ∈ J = {J1,J2, . . . ,Jm}.
188
Further, letTbe a database inS, that contains the attendance records of all pupils across all sessions for 189
a period,W. Hence, there may exist a database,Tt, whereTt⊆T, that contains the attendance records
190
of pupilsUt, whereUt ⊆U, who have below the required attendance in at least one school session
191
and/or the overall average attendance, but where attendance in all other sessions are above or equal 192
to the requirement. In the UK, the required attendance target is 96% [4]. Given that the leadership 193
and staff of the schoolSare intent on maximising pupil attendance (with the focus on driving up the 194
overall average pupil attendance through incentives and interventions) while minimising effort and 195
associated costs (largely incentives and staff costs), it becomes necessary to optimise the targeting ofJi.
196
Thus, this study aims to provide a framework, and useful tool for schools, based on ARM and Frequent 197
Itemset Mining (FIM), for targeting the right school session(s) with incentives and interventions that 198
maximises the impact on improved overall school attendance. 199
3.2. Analytical Model 200
We commence by noting the definitions of the well-known ARM concepts of support, confidence, 201
minimum support, minimum confidence, and the Apriori principle first introduced in [28], and as 202
detailed in [29] and [30]. 203
• The support of an itemA, in a transaction databaseT, is given by:
supp(A) =P(A) = number of transactions inTthat containA
number of transactions inT
• The probability of the presence of itemAleading to the presence of itemC(commonly referred to as confidence) is given by:
conf(A→C) = number of transactions inTthat contain bothAandC
number of transactions inTthat containA
When supp(A)exceeds some user-defined value for support (commonly referred to as minimum
204
support or minsup) we note thatAis considered to be frequent. Similarly when conf(A→C)exceeds 205
some user-defined value for confidence (commonly referred to as minimum confidence or “minconf”) 206
we note thatAandCare considered to be associated. Note that FIM is defined as the process of
207
finding all itemsets that exceed minsup in a given database [13,16,29]. 208
The Apriori principle, first detailed in [28], and more recently in [16], states that for a given set 210
of transactions, supp(A) ≥ supp(A,C). This is consistent with probability theory where P(A) ≥ 211
P(A∩C), as well as in practical terms, e.g. where the number of transactions that contain pupils who 212
are absent on Monday AM is always greater than or equal to the number of transactions that contain 213
absences on both Monday AM and PM. 214
3.2.1. Identifying the Best Sessions to Target with Attendance Improving Initiatives 215
Pupils that have above or equal to the required attendance in every session are generally 216
considered to have very good attendance, and in essence help the school boost its overall average 217
attendance. LetTpbe a database containing the attendance records of all pupils that are persistently
218
absent, henceTp ⊆ Tt. Persistent absenteeism in the UK is defined as having an overall average
219
attendance of less than 90% [22]. Given that schools take severe action once attendance drops below 220
85%, including removing a pupil from the school roll,Ttthus represents a significant portion ofT
221
for a school that has overall below-the-required-average attendance [4]. Hence, improving pupil 222
attendance inTtwill enhance overall attendance, and as most schools have limited resources, the
223
question of whichJiinTtshould be targeted often arises. Intuitively, the best session to target should
224
be that session which has both the highest absence and the highest association with poor overall 225
average attendance,O. This scenario may be represented in terms of ARM as targeting the session 226
where supp(Ji)and conf(Ji →O)is the largest. However, we also note that scenarios do exist where
227
supp(Jc)>supp(Jk)but conf(Jc→O)<conf(Jk→O). In these cases, the choice betweenJkandJcis
228
not obvious. 229
230
This choice-making problem is not unique to school attendance and often arises in several other sectors 231
including in retail, medicine, and security [16]. We note that a similar problem involving the selection 232
of the best item to target for grocery retail promotions has recently been addressed in [16], and thus the 233
methods employed in that study could be applied here. To facilitate easy processing,Ttis converted
234
into a database with binary attributes, with sessions and/or the overall average attendance being 235
assigned a “1” when attendance drops below the required levels. Clearly,Ttmay now be considered to
236
be an absenteeism database. 237
3.2.2. Applying the Market Target (mtmodel) on school attendance data 238
Themtmodel proposed in [16] was shown to be effective in making choices between items in the 239
form(A→C)and(B→D). Indeed, the problem laid out in Section3.2.1is of the form(A→C)and 240
(B→C), and may be considered a subset of the more generalised choice making problem that themt
241
model addresses. 242
243
Let P(Ji)be the support of sessionJiin databaseTt, and P(Ji,O)be the support of sessionJi andO
244
co-occurring in databaseTt. In practical terms, P(Ji,O)may be viewed as the number of children,
245
or instances, that have both below the required attendance forJiandOin the databaseTt. Thus by
246
definition, conf(Ji →O) = P(Ji,O)/P(Ji). As was the case in grocery retail, detailed in [16], there
247
are two intuitive schools of thought on solving this problem to reduce attendance. One may suggest 248
targeting the session,Ji, that has the highest conf(Ji →O), as a reduction in every absenteeism inJi
249
will most likely lead to a reduction in(Ji,O). However, if P(Ji,O)is low, then(Ji,O)may be considered
250
to be rare, and solving this scenario may not have the desired overall impact onO. Rare rules, as 251
defined in [13], are rules that are highly associated but occur less frequently in a dataset, i.e. they 252
have lower support. Conversely, targeting a high P(Ji,O)may seem attractive, but if conf(Ji →O)
253
is low, then lowering P(Ji), through some initiatives, may not have the required impact on P(Ji,O),
254
and consequently P(O). Thus, it is evident that a model that takes into consideration the concepts of 255
support and confidence is required to find the optimum solution. In this regard, themtmodel, detailed 256
in [16], is a model that addresses this exact challenge. 257
3.2.3. Adapting themtmodel for school attendance 258
Themtmodel, adapted for school attendance, is developed below, and in essence evaluates
259
options, for example: option(Ji,O)and(Jk,O), based on both the support and confidence of that
260
option in the database. It is clear that P(Ji)≥P(Ji,O)for alli∈m, hence the underlying principle of
261
themtmodel is that it evaluates the “effort” required to make P(Ji,O)= minsup, which is considered
262
to be the “desired” state of P(Ji,O). Note that in this instance, the “desired” state is equivalent to the
263
maximum session and overall absenteeism. Also note that minsup is user-defined, and is governed by 264
the Apriori principle, i.e. P(Ji,O)≤minsup≤P(Ji)for alli∈m. The number of absences required for
265
a P(Ji,O)combination to reach the “desired” state is given by Equation (1), where|Tt|is the number
266
of transactions in databaseTt.
267
Number of absences required for “desired” state= (minsup−P(Ji,O))· |Tt| (1)
Given that not all children absent inJiwill also be absent inO, the “market target” referred to [16], or
268
in this instance, the pupil target, may thus be defined as the number of required absences inJisuch
269
that the number of absences required for the “desired” state of(Ji,O)inTtto be reached. This is stated
270
mathematically in Equation (2), where P(Ji,O)/P(Ji)= conf(Ji →O).
271
pupil target· P(Ji,O) P(Ji)
=Number of absences required for “desired” state (2)
Thus the mtequation, given in Equation (3) is obtained by combining Equations (1) and (2), and 272
dividing both sides the minimum support, i.e. the physical number of absences equivalent to minsup 273
in databaseTt. Note thatmtis a normalised parameter, and is given by pupil target / minimum
274 support. 275 mt= P(Ji) P(Ji,O) − P(Ji) minsup (3)
From Equation (3), it is evident that options that have the lowestmtvalue require the lowest “effort” to 276
reach the “desired” state, and are thus considered the best choices for a given minsup. From a practical 277
perspective, this implies that the school targets the school session that has the greatest propensity to 278
lead to overall below-average school attendance. There are also practical constraints of managing a 279
school that must be considered. In this regard, initiatives must target all, or the majority of school 280
pupils to ensure fairness, and given that most initiatives are largely fixed costs (e.g. the effort in 281
planning activities is similar whether the audience is 100 or 250), it makes sense to target the session 282
which impacts overall absenteeism the most [20]. The most impactful session is the session which has 283
the lowestmtvalue as it requires the least “effort” to reach the “desired” state. 284
3.2.4. Algorithm for identifying target sessions using themtmodel 285
Applying themtmodel to identify the best sessions to target is relatively straightforward. The 286
mtvalue is computed for each(Ji→O)combination and the one with the lowestmtvalue is the best
287
session to target. The steps of the proposed algorithm are detailed in Algorithm (1). 288
4. Experiments
289
4.1. Experimental Process 290
Experiments were conducted based on the well-known Action Research process as detailed in 291
[31] and outlined in Figure1. As per [31], the process begins by defining the context and purpose by 292
asking the question: why is this project required or desirable? However, it is the diagnosing phase that 293
usually proves to be the most challenging as it involves identifying the possible issues or the most 294
impactful issue, which is sometimes not obvious [32]. Consequently, data analytics is often leveraged 295
Algorithm 1:Identifying target sessions using themtmodel
1 Create the dataset,Tt, fromTthat contains the attendance records of all pupils that are on the
roll for the entire period, and where their attendance has been below the required level in at least one session
2 Using a ARM/FIM algorithm (e.g. Apriori or ECLAT) with a low support and confidence,
find supp(Ji)and conf(Ji→O)for all sessions
3 Calculate themtvalue for each(Ji,O)combination using an appropriate value for minsup
4 Order sessions based onmtvalues, with the session that has the lowestmtvalue being the best session to target
to simplify this task through the use of models and algorithms to process data into information [32]. In 296
this regard, themtmodel forms part of the diagnosing phase. Note that the Action Research process is 297
cyclical and actions taken have to be regularly evaluated against the context and purpose, which could 298
also change over time [31]. 299
Figure 1.Action Research Process as outlined in [31]
Research was conducted at Willen Primary School with the context and purpose of improving overall 300
school attendance to be above or in line with the national requirement, which is currently set at 96% 301
in the UK [4,22]. Themtmodel (part of the diagnosing phase) was then used to identify the session 302
which was most impactful to overall school absence. Options for possible action were brainstormed 303
with school leadership and evaluated in the planning action stage. Following this, selected actions 304
were carried out at the school over several months (taking action stage) with the impact on overall 305
school attendance then assessed in the evaluating action stage. 306
4.2. Experimental conditions 307
4.2.1. Willen Primary School 308
WPS is a mixed, 2-form entry primary school on the north-eastern side of Milton Keynes, catering 309
for 4 to 11 years old children. The school has a capacity of 420 pupils and had 366 pupils on its roll at 310
the end of July 2019, with approximately 35% of its pupils coming from outside the school’s catchment 311
area [20,33]. The school was rated “Good” by the UK’s Office for Standards in Education, Children’s 312
Services and Skill (Ofsted) in its last inspection, which was conducted in November 2017 [34]. Whilst 313
the inspector cited very good attendance management practices by the school leadership, he did note 314
that further improvement should be made [34]. Given this, the school has continued to fervently 315
promote the importance of good attendance and explored the use of novel approaches to address the 316
issue of absenteeism giving rise to this study [20]. 317
4.2.2. Diagnosing 318
School attendance data for the previous three academic years, i.e. 2015/16, 2016/17 and 2017/18, 319
were used as the basis for improving school attendance in 2018/2019. For the sake of completeness, 320
detailed attendance and school roll data are provided in AppendixA. These data were first scrubbed, 321
to remove pupils that either joined the school after the start of the academic year or left the school 322
during the academic year, thus producing a datasetTfor each academic yearW, as further discussed 323
in Sections3.2.1and3.2.4. Subsequently, data were further filtered to produceTtby selecting those
324
pupilsUtwho either had an overall attendance of less than 96% (the required national average) and/or
325
who were absent at least three times per session during the academic year. Given that the cardinality 326
of sessions was generally between 34 and 39 per year, it was not practical to filter these sessions at the 327
96% level as it was too restrictive (equivalent to two absences per session). It is not uncommon for 328
some children to have up to two absences for some sessions and still have an overall attendance of 329
at least 96% [20]. The restriction on analysing pupils that were present for the entire academic year 330
was placed to ensure that the data analysis process was not unfairly skewed. For example, consider a 331
scenario that occurs fairly regularly: some pupils may enrol at WPS after the start of the academic year, 332
have 100% attendance for two weeks and then transfer to another school (possibly one that is closer 333
to their home) [20]. In this case, these pupils will have 100% attendance and be treated analytically 334
as the same as pupils who had 100% attendance for the entire academic year. Consequently, these 335
pupils were excluded from the analysis. The size ofTtfor each academic year is detailed in AppendixA.
336
337
Ttfor each academic year was then analysed using an FIM algorithm in R, with a minsup of 0.3 and a
338
minconf of 0.3 to prune rare rules, similar to the process outlined in [16]. The value of minsup and 339
minconf was chosen to be low enough to capture all essential rules but high enough to eliminate 340
superfluous rules. Given that minsup and minconf are user-defined parameters, the choice of an 341
appropriate value is typically based on the context. Whilst the values of minsup, and minconf have 342
practical significance in some sectors and settings, e.g. in grocery retail where it is used to identify 343
popular products [16], in this context, it is used to simplify the data processing by reducing the number 344
of rules produced. The choice of 0.3 was based on trial and error, which is typically the case in data 345
processing applications. An initial test pass on the dataset for the 2017/18 academic year using minsup 346
= 0.4 resulted in some essential rules being pruned, e.g. Wed-PM and Thur-PM, hence minsup was 347
adjusted to be lower than 0.4. It should be noted that choosing a value inferior to 0.3 will still achieve 348
the objective, but will increase processing effort. For completeness, the number of rules extracted per 349
academic year is detailed in AppendixA. Following this step, the output from the FIM stage was
350
further analysed, using Microsoft Excel, to compute themtvalue for each frequent itemset from which 351
the best target session was identified. 352
4.2.3. Planning Action 353
Given that the school has strict obligations, guidelines and its strategic agenda that it must 354
adhere to, it was realized that a multi-prong approach had to be undertaken with regards to planned 355
actions that would improve attendance and validate the targeting approach proposed in this study. 356
These planned actions were over and above what the school was currently doing to monitor and 357
promote attendance. Hence a two-pronged approach was adopted with 1) session-targeting focused on 358
demonstrating that session (and overall) attendance can be improved by targeting identified session(s); 359
2) overall attendance improvement initiatives focused on improving attendance in line with the 360
strategic and statutory obligations of the school. 361
Several alternatives were considered by school leadership and based on their experience, the best 362
two selected were: 1) focus on shorter periods with prize-based rewards for full attendance; 2) create 363
more exciting initiatives for targeted sessions. The selected initiatives were consistent with the tiered 364 approach described in [26]. 365 4.2.4. Taking Action 366
Apart from continuing to fulfil its statutory and strategic objectives with regards to attendance 367
(including dealing with persistent absenteeism, promoting and fostering a good environment for 368
improved attendance, and dealing with truancy) the school implemented the two initiatives outlined 369
in Section4.2.3. 370
Initiative One (I1) focused on increasing the frequency and perceived meaningfulness of the rewards 371
for full attendance so that pupils could both feel tangibly rewarded for full attendance and know that 372
they can always be eligible for rewards in the next reward period should they not win in the current 373
or previous period. I1 commenced at the start of the Spring term in January 2019, with all pupils 374
that had full attendance for the month placed in a draw to win one of eight tickets to a popular, local 375
trampoline park. The reward was meaningful to the pupils as it was something that they enjoyed 376
and it was something that was not always available to them due to cost constraints [20]. Given this, 377
there was considerable excitement from pupils when the initiative was introduced. Initiative Two (I2) 378
was geared towards targeting the sessions that had the largest impact on poor attendance. Exciting 379
activities were conducted during the most impactful session throughout the Summer term starting at 380
the end of April 2019. These activities, which were centred on a common theme and designed to be 381
in line with the learning objectives, involved the entire school and included elements that the pupils 382
would consider exciting [20]. Further details on I2 are provided in Section5. 383
4.2.5. Evaluating Action 384
Following the implementation of the initiatives, the pupil attendance records for the 2018/19 385
academic year were analysed using Microsoft Excel and compared with previous years to quantify the 386
impact of I1 and I2. This then fed into school planning operations for the 2019/20 academic year. 387
We adopt a simple, inference-based approach by establishing two null hypotheses, and by inference 388
draw conclusions on the 2018/19 year. The null hypotheses are stated as follows: 389
• H0(1): There is no statistically significant change in the attendance data across the three academic 390
years (2015/16, 2016/17 and 2017/18). 391
• H0(2): There is no statistically significant change in the attendance data across all four academic 392
years. 393
From the above, if H0(1) is accepted and H0(2) is rejected then we can conclude that the 2018/19 394
is statistically different from the previous years, and hence the initiatives have made an impact. 395
Conversely, if bothH0(1)andH0(2)are accepted, then we can conclude that the initiatives have made no 396
impact on attendance. 397
5. Results and Discussion
398
5.1. Identifying Target Sessions 399
The average attendance for all pupils who were on the school roll for the entire academic year 400
was calculated using Microsoft Excel, with the results presented in Table1. 401
Table 1.Average Attendance for 2015/16, 2016/17 and 2017/18 Session(Ji) 2015/16 2016/17 2017/18 Mon-AM 93.7% 93.7% 93.8% Tues-AM 94.1% 94.9% 94.6% Wed-AM 95.1% 95.0% 95.3% Thur-AM 94.9% 95.3% 94.8% Fri-AM 94.6% 94.7% 94.1% Mon-PM 94.1% 94.5% 94.1% Tues-PM 94.7% 95.6% 95.1% Wed-PM 95.5% 95.6% 95.8% Thur-PM 95.5% 95.7% 95.4% Fri-PM 94.9% 94.9% 94.5% Average AM 94.5% 94.8% 94.5% Average PM 95.0% 95.3% 95.1% Overall(O) 94.7% 95.0% 94.8%
From Table1it can be seen that the school generally did not achieve the required overall average 402
attendance of 96% in any of the previous three academic years. Further, attendance in the morning 403
(AM) sessions were lower than the afternoon (PM) sessions, with Monday AM being consistently the 404
most poorly attended session across the years. This is consistent with theories on separation anxiety 405
where young children often dislike going back to school after spending long periods away from school 406
with their parents and family, and school withdrawal [22,25]. Separation anxiety may be exacerbated 407
when parental collision occurs (school withdrawal) and parents keep pupils at home for fear that they 408
may become distressed further [1,21,22]. 409
410
Whilst Monday AM is the most absent session based on average percentages, as shown in Table1, 411
the basis of attendance management is not only about increasing the overall average attendance, but 412
centred on addressing the most impactful session to overall attendance, which in turn impacts pupil 413
performance [1]. It is possible that the most frequently absent session is not the most impactful, as 414
children absent in this session could return to school in the next session and have perfect attendance for 415
the rest of the week, and generally have good academic performance as well. Thus, any interventions 416
aimed at improving attendance in these sessions may likely be less effective as it will be targeting 417
children that already have good overall attendance. This may take focus (and valuable resources) away 418
from other sessions that may have marginally better attendance, but fraught with problem absenteeism 419
that is impacting pupil performance and overall school morale. Indeed, executing “misguided” 420
intervention programs can also have detrimental impacts on staff and parents. Staff may lose faith 421
in their ability to improve school attendance and performance, and loss morale as their hard work 422
may go unrewarded. At the same time parents, whose children are generally good attendees, may 423
feel unduly victimised for occasional absences, particularly where such absences are obligatory e.g. 424
medical appointments or bereavement [20]. Further, given that these interventions are focused on a 425
session that generally comprises of occasional absenteeism, it is unlikely to make a significant impact 426
on the children that are chronically absent. Tracking and improving absenteeism, especially chronic 427
absenteeism, is a key performance metric of a school’s performance management framework within 428
the UK [20,22,34]. As a result, it thus becomes important to target the most impactful session to overall 429
attendance, and the use of the mt model, as detailed in Section3, is one effective way of achieving this 430
objective. 431
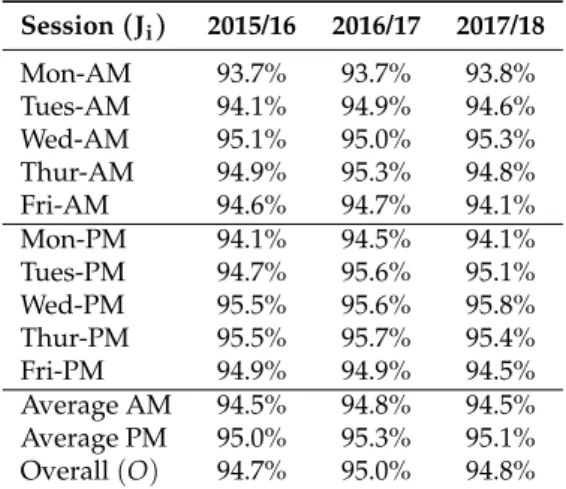
5.1.1. Targeting the Most Impactful Session 432
Themtvalue for each session was calculated on eachTtfor the previous three academic years,
433
as per the process outlined in Section3, with the results detailed in Tables2,3and4. Some sessions 434
were automatically eliminated, consistent with Lemma 1 in [16], as both their corresponding support 435
and confidence were less than other sessions in the same year. As noted in Lemma 1 in [16] and 436
adapted for this study, if both supp(Ji,O)and conf(Ji→O)is less than supp(Jk,O)and conf(Jk→O)
437
respectively, then(Jk,O)is the better choice, and(Ji,O)can thus be eliminated. In Table2for the
438
2017/18 academic year, Fri-AM had both higher support and confidence than every other session 439
except Mon-AM, hence there was no need to compute themtvalue for all other sessions except Fri-AM 440
and Mon-AM. Themtmodel in Equation (3) was used to decide the better target session between
441
Fri-AM and Mon-AM, with a minsup value of 0.550 (the lower support between Fri-AM and Mon-AM) 442
being used. Mon-AM had the lowermtvalue and hence was selected to be the best session to target. 443
Table 2.Identifying Target Sessions - 2017/2018,Tt=179
Session(Ji) P(Ji) P(Ji,O) conf(Ji →O) mt Mon-AM 0.594 0.561 0.944 -0.021 Mon-PM 0.539 0.517 0.959 -Tues-AM 0.494 0.472 0.955 -Tues-PM 0.483 0.472 0.977 -Wed-AM 0.456 0.433 0.951 -Wed-PM 0.378 0.356 0.941 -Thur-AM 0.494 0.467 0.944 -Thur-PM 0.394 0.383 0.972 -Fri-AM 0.550 0.539 0.980 0.020 Fri-PM 0.506 0.472 0.934 -Overall(O) 0.856 - -
-The negative value formtwas also interesting to note. In practical terms, it implied that there were more 444
records inTtthat contained both Mon-AM andOthat were below the required levels than records that
445
contained Fri-AM being below the required level. Thus any initiative to resolve absenteeism on Fri-AM 446
will always be less impactful than absenteeism on Mon-AM. Hence all other sessions except Mon-AM 447
were considered to be rare rules as there exists a(Ji,O)combination that is under consideration with
448
P(Ji,O)>minsup. This is not always the case and the scenarios were quite different for the 2015/16
449
and 2016/17 academic years. 450
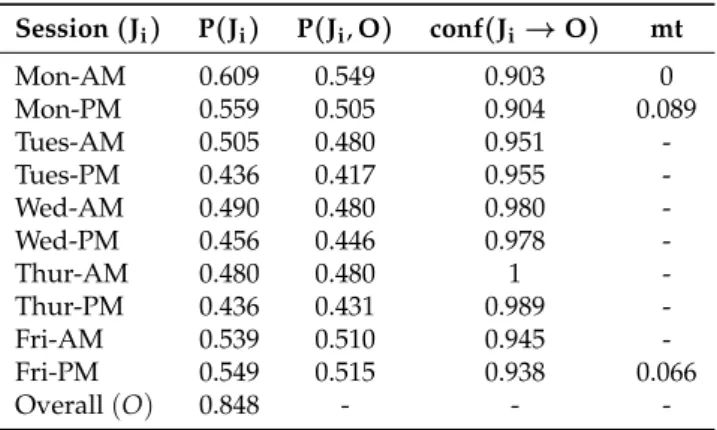
Table 3.Identifying Target Sessions - 2016/2017.Tt=180
Session(Ji) P(Ji) P(Ji,O) conf(Ji→O) mt Mon-AM 0.609 0.549 0.903 0 Mon-PM 0.559 0.505 0.904 0.089 Tues-AM 0.505 0.480 0.951 -Tues-PM 0.436 0.417 0.955 -Wed-AM 0.490 0.480 0.980 -Wed-PM 0.456 0.446 0.978 -Thur-AM 0.480 0.480 1 -Thur-PM 0.436 0.431 0.989 -Fri-AM 0.539 0.510 0.945 -Fri-PM 0.549 0.515 0.938 0.066 Overall(O) 0.848 - -
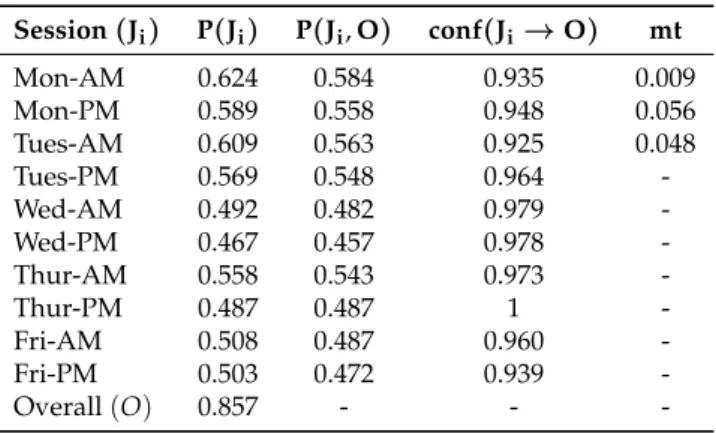
-Table 4.Identifying Target Sessions - 2015/2016,Tt=170 Session(Ji) P(Ji) P(Ji,O) conf(Ji→O) mt Mon-AM 0.624 0.584 0.935 0.009 Mon-PM 0.589 0.558 0.948 0.056 Tues-AM 0.609 0.563 0.925 0.048 Tues-PM 0.569 0.548 0.964 -Wed-AM 0.492 0.482 0.979 -Wed-PM 0.467 0.457 0.978 -Thur-AM 0.558 0.543 0.973 -Thur-PM 0.487 0.487 1 -Fri-AM 0.508 0.487 0.960 -Fri-PM 0.503 0.472 0.939 -Overall(O) 0.857 - -
-From Table3for the 2016/17 academic year, all rules except Mon-AM, Mon-PM and Fri-PM were
451
shortlisted as the others were determined to be rare. Themtvalues were computed for each of the 452
shortlisted sessions, with minsup set at 0.549 (the lowest support between Fri-PM, Mon-AM and 453
Mon-PM). Mon-AM was found to be the most impactful session to overall below-average attendance. 454
Similarly from Table4for the 2015/16 academic year, Mon-AM was found to be the most impactful
455
session with minsup set at 0.589. Given that Monday AM was found to be the most frequent and 456
the most impactful session in the three academic years analysed, it can be concluded that the poor 457
attendance on Monday AM may be attributed to a combination of school refusal (e.g. due to separation 458
anxiety), and school withdrawal/truancy where the return to school may not be seen as being as 459
exciting as the weekend that just passed [1]. Therefore, an easier, more exciting start to the school week 460
(initiated by the school) may prove successful in addressing this issue. 461
5.1.2. Early Warning System 462
The very high confidence values (>0.9 and in some cases = 1) was also of significant note as it 463
suggested that any pupil that was absent for at least three times in any one session was very likely to 464
have below overall required attendance. This could be a good tool for the school to use in tackling 465
absenteeism as it may be used to identify pupils that are at risk of falling below the requirement, 466
consistent with the recommendation in [26]. Further, it could be used as part of conversations with 467
parents and pupils in addressing their beliefs and misconceptions about attendance which is consistent 468
with the recommendations in [1], [2], and [4] for improving attendance through leveraging analytics. 469
This fact-based approach is more likely to resonate well with parents and may negate any possible 470
insinuations by parents that their families are being victimised or treated unfairly by teachers and 471
school leadership [1,2]. 472
5.2. Evaluating the Impacts of Initiatives I1 and I2 473
I1 and I2 were conducted as detailed in Section 4.2.3. Following the results of the analysis 474
conducted as part of Section5.1, the school decided to target Mondays with the emphasis on the
475
Monday AM session as part of I2. The Monday Matters initiative was launched in the Summer term 476
of 2019 and consisted of a “m-themed” program for five of the ten Mondays during the term. The 477
initiatives were selected by the school staff as it represented themes that would resonate well with 478
the pupils. The five themed Mondays were: Move-It Monday, Muffin Monday, Mindfulness Monday, 479
Mask Monday and Movie Monday. For each themed Monday, pupils were allowed to come to school 480
appropriately dressed, e.g. example sports kits on Move-It Monday, and participate in a range of 481
planned activities related to that theme which were also linked to the work that was being done in the 482
classroom. 483
5.2.1. I1: Frequent Rewards for Full Attendance 484
Draws were held every month during the Spring and Summer terms of 2018/19, except for April, 485
for all pupils that had full attendance during the month. The April draw was omitted given that April 486
had fewer than 10 school days in that month. 487
Table 5.Average Attendance for Spring and Summer Terms: 2015/16, 2016/17, 2017/18 and 2018/19 Session(Ji) 2015/16 2016/17 2017/18 2018/19 Mon-AM 94.1% 93.9% 94.3% 95.8% Tues-AM 94.2% 95.2% 95.0% 96.2% Wed-AM 95.1% 95.5% 95.4% 96.2% Thur-AM 94.9% 95.5% 95.1% 96.3% Fri-AM 94.4% 95.0% 94.2% 95.6% Mon-PM 94.7% 94.6% 94.8% 96.5% Tues-PM 94.9% 95.8% 95.5% 96.8% Wed-PM 95.6% 95.8% 95.8% 96.6% Thur-PM 95.6% 95.8% 95.6% 96.8% Fri-PM 94.9% 95.1% 94.1% 96.0% Average AM 94.6% 95.1% 94.8% 96.0% Average PM 95.2% 95.4% 95.2% 96.5% Overall(O) 94.9% 95.2% 95.0% 96.2%
From Table 5, it is evident that the shorter, more meaningful rewards for full attendance have
488
contributed to a significant improvement in overall attendance for the Spring and Summer terms in 489
2018/19 with the attendance for every session being considerably higher than the attendance in the 490
previous three years. This result was consistent with the findings in [1] 491
5.2.2. I2: Monday Matters Initiative 492
Table6presents attendance data for Summer term Monday attendance for the 2015/16, 2016/17,
493
2017/18 and 2018/19 academic years. There is fluctuation in the number of Mondays from year to 494
year due to the timing of Easter which influences the half-term break as well, which is typically held 495
towards the end of May. From Table6it can be seen that the average attendance for Mondays in the 496
Summer term of 2018/19 was significantly higher than the previous years. Further, not only was the 497
2018/19 attendance data higher, but it was also above the required 96% target and the first time that 498
this was the case in four years. The range and median for the data also showed the strength of 2018/19 499
attendance data when compared to previous years. The range in 2018/19 was over half that of 2015/16 500
indicative of a consistently high Monday attendance throughout the term. 501
Table 6.Comparison of Monday Summer term attendance data for I2 2015/16 2016/17 2017/18 2018/19 Average Attendance (%) 94.4% 94.5% 94.2% 96.5%
Range 6.2% 5.3% 4.5% 2.8%
Median 94.5% 95.0% 94.1% 96.4%
No. of Mondays 12 11 12 10
There were some concerns from school leadership on the “stickiness” of Monday Matters events (where 502
having an event every other Monday fosters good attendance on other Mondays and indeed other 503
days of the week), and whilst there were spikes in attendance on Monday Matters days, attendance 504
during the other Mondays was quite good, as evidenced by the data in Table6. These findings are 505
consistent with other studies that noted that in general, pupils are “creatures of habit” who thrive on 506
routine, and are thus likely to sustain good attendance once a routine is established [1,2,4]. 507
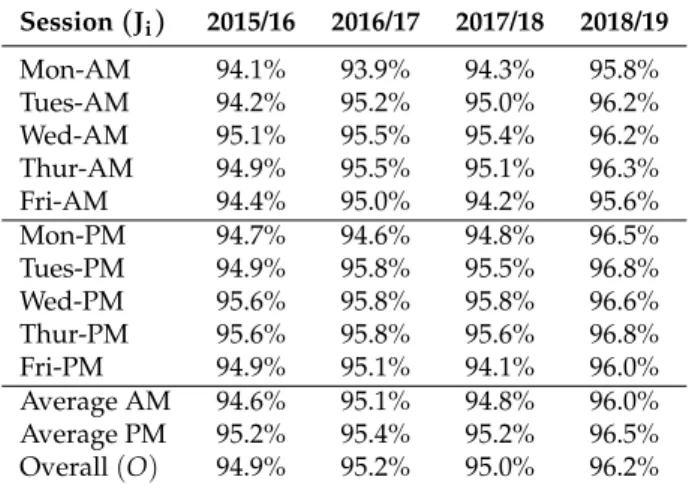
5.3. Evaluating the Overall Improvement in School Attendance 508
The full-year attendance comparison is presented in Table7. It can be seen that initiatives in the 509
Spring and Summer terms of the 2018/19 have contributed to an improvement in the whole school 510
attendance for the full academic year. Indeed, WPS achieved the required attendance target of 96% for 511
the first time in four years in 2018/19. 512
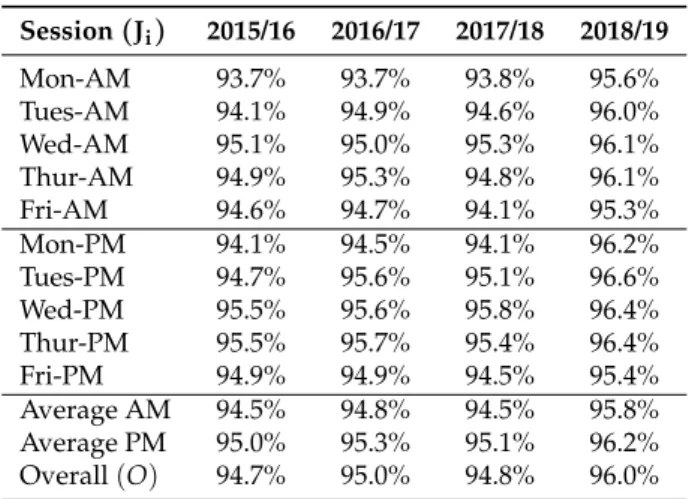
Table 7.Average Attendance for 2015/16, 2016/17, 2017/18 and 2018/19 Session(Ji) 2015/16 2016/17 2017/18 2018/19 Mon-AM 93.7% 93.7% 93.8% 95.6% Tues-AM 94.1% 94.9% 94.6% 96.0% Wed-AM 95.1% 95.0% 95.3% 96.1% Thur-AM 94.9% 95.3% 94.8% 96.1% Fri-AM 94.6% 94.7% 94.1% 95.3% Mon-PM 94.1% 94.5% 94.1% 96.2% Tues-PM 94.7% 95.6% 95.1% 96.6% Wed-PM 95.5% 95.6% 95.8% 96.4% Thur-PM 95.5% 95.7% 95.4% 96.4% Fri-PM 94.9% 94.9% 94.5% 95.4% Average AM 94.5% 94.8% 94.5% 95.8% Average PM 95.0% 95.3% 95.1% 96.2% Overall(O) 94.7% 95.0% 94.8% 96.0%
The data in Table7also reveals the success of the Monday Matters initiative on the full-year attendance 513
data. Monday AM and PM sessions have seen the largest increase in attendance, with increases of 1.8 514
and 2.1 percentage points respectively. As a result, Mondays no longer have the worst-performing AM 515
and PM sessions, and the shift in focus now moves towards Fridays, where the underlying reasons for 516
poor attendance may be quite different. Unlike Monday absenteeism, which is influenced to some 517
extent by separation anxiety, Friday absenteeism may be more influenced by school withdrawal where 518
parents may: 1) want to extend the weekend or start holidays earlier to beat the rush and/or save on 519
costs, and 2) sometimes assume that Fridays are typically low-value school days in which limited 520
learning takes place and hence pursue other activities outside school [21,23]. Hence, the action plan to 521
tackle Friday absenteeism must be geared more towards school withdrawal as opposed to the Monday 522
Matters initiative which was focused on tackling both school refusal and school withdrawal. 523
524
One argument that parents do make on Friday absence is that their child(ren) have excellent attendance 525
on all other sessions and these occasional absences should not impact the child and the school. While it 526
is well-documented that all and every absence impacts pupil learning, the question of whether Friday 527
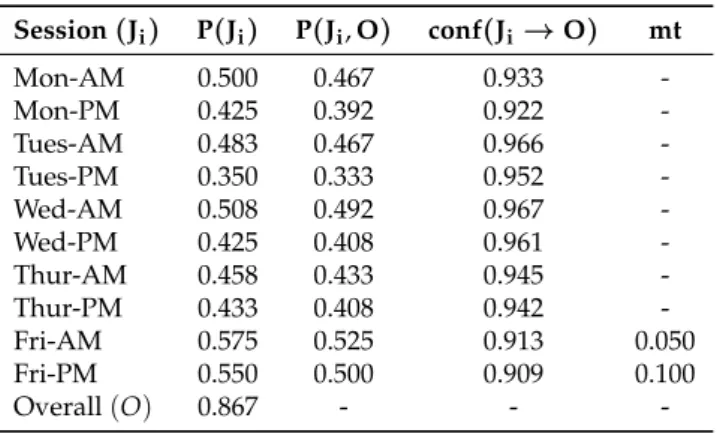
sessions have now become the most impactful session to overall absence arose [1,4,21]. In line with 528
this, the analysis detailed in Sections4.2.2and5.1.1was conducted on the 2018/19 dataset. It was clear 529
from the results in Table8that Friday is now the most impactful day to overall below the required 530
attendance, with Fri-AM being the most impactful session. Mon-AM is no longer the most impactful 531
session to overall below-average attendance for the first time in the four academic years. 532
Table 8.Identifying Target Sessions - 2018/19,Tt =119 Session(Ji) P(Ji) P(Ji,O) conf(Ji→O) mt Mon-AM 0.500 0.467 0.933 -Mon-PM 0.425 0.392 0.922 -Tues-AM 0.483 0.467 0.966 -Tues-PM 0.350 0.333 0.952 -Wed-AM 0.508 0.492 0.967 -Wed-PM 0.425 0.408 0.961 -Thur-AM 0.458 0.433 0.945 -Thur-PM 0.433 0.408 0.942 -Fri-AM 0.575 0.525 0.913 0.050 Fri-PM 0.550 0.500 0.909 0.100 Overall(O) 0.867 - - -5.3.1. Persistent Absenteeism 533
The impacts of initiatives I1 and I2 on persistent absenteeism (attendance <90%) were also 534
analysed with the results presented in Table9. Persistent absenteeism at WPS has been significantly 535
higher than the national average for at least the last three years, this despite regular and close 536
monitoring by the school’s leadership team (including governors) and the school’s attendance officer. 537
However, the level of persistent absenteeism has significantly decreased in 2018/19 and was lower 538
than the national average for persistent absenteeism of 8.2%. 539
Table 9.Comparison of Persistent Absenteeism 2015/16 2016/17 2017/18 2018/19 WPS (% of total) 13.1% 11.3% 12.8% 5.8% National (% of total) 8.2% 8.3% 8.7% 8.2%
This is a significant improvement and consistent with previous studies that sought to tackle the 540
problem of chronic (persistent) absenteeism, in particular [1]. Indeed some of the approaches for 541
tackling persistent absenteeism discussed in [1] have been leveraged in the development of I1 and I2 542
including the concept of making rewards more frequent and meaningful. 543
5.4. Statistical Testing of the Improvements in School Attendance 544
Statistical testing was conducted using the approach outlined in Section 4.2.5 and the data
545
presented in Table7. ForH(01), the Kruskal-Wallis test showed that there was no statistical difference in 546
attendance,H=2.61,p<0.01, hence we accept the null hypothesis, while forH0(2), the Kruskal-Wallis 547
test showed that there was a statistical difference in attendance, H = 21.46, p < 0.01, hence we 548
reject the null hypothesis. Based on this, we thus acceptH0(1)and rejectH0(2)and concluded that the 549
initiatives in 2018/19 had an impact (positive) on overall attendance. 550
6. Conclusions
551
Themtmodel, described in Equation (3) and detailed in [16], was adapted to improve school 552
attendance at WPS. The algorithm detailed in Section3.2.4, which included themtmodel, was used 553
to identify the school session which was most impactful to overall below the required average 554
attendance. In line with this, the previous three years’ attendance data from WPS was analysed 555
and it was found that the Monday AM session was consistently the most impactful session to the 556
overall below the required average attendance. Two initiatives were carried out at WPS based on 557
approaches in previous studies and the collective wisdom of WPS leadership and staff [1,2,20]. 558
Initiative I1 provided more frequent and meaningful rewards for full attendance while I2 focussed on 559
improving Monday attendance through the use of themes that were known to be exciting for the pupils. 560
561
Both I1 and I2 resulted in a significant improvement of attendance at WPS, with attendance in 562
2018/19 being at its highest over the past four academic years. Overall average attendance for the 563
2018/19 academic year was at the required target of 96%, whilst the combined Spring and Summer 564
term attendance was higher at 96.2%. Monday attendance during the Summer term also improved 565
significantly from an average and range perspective. The average Summer term Monday attendance 566
in 2018/19 was significantly higher than the three previous years at 96.5%, while its range was 567
significantly lower 2.8%, implying that attendance on Mondays was consistently better throughout the 568
term. 569
570
Analysis of the 2018/19 data using themtmodel has revealed that Monday AM is no longer the
571
most impactful session to overall below the required attendance, instead, it is now Friday AM. The 572
underlying dynamics as to why this is the case may also include a shift away from school refusal and 573
more towards school withdrawal (parental condoned absence) which is underpinned by a variety of 574
reasons including cheaper holidays [20,23]. Addressing this is considered to be part of the future work 575
and is detailed in Section6.2. 576
6.1. Summary of Theoretical and Practical Implications 577
6.1.1. Theoretical Implications 578
The proposed approach, which includes themtmodel underpinned by well-grounded theory and
579
concepts in tackling absenteeism as detailed in [1] and [26], provides a novel, simple, yet effective way 580
to tackle the well-known problem of addressing absenteeism in schools. The implementation of two, 581
easy-to-action, initiatives have demonstrated a significant improvement in attendance. This study 582
also contributes to the body of knowledge on MBA, in particular, its use in a wide range of sectors 583
including retail, medical and now education [16,32]. 584
6.1.2. Practical Implications 585
The proposed algorithm detailed in Section3.2.4enables schools to easily identify and tackle 586
issues around pupil attendance. This study considered the impact of sessions on attendance, but this 587
approach could be extended to identify other factors impacting attendance including the impact of 588
subjects or topics being taught and the impact of pupil demographics. 589
590
The algorithm can also be used to identify other issues at schools as e.g. the factors impacting pupil 591
progress. These factors (which may include attendance, demographics, attentiveness in class and 592
completion of homework) could be quantified using a simple 1 to 5 ranking scale and analysed using 593
themtmodel to identify and rank the impact of these factors on pupil progress. Whilst this may be 594
seen as similar to the work in [17], this approach will add further value by quantifying the impact of 595
each factor to overall progress, as opposed to only ranking their association. 596
6.2. Future Work 597
Future work has been divided into two parts namely: future work for the school; and future work 598
for the authors. 599
6.2.1. Future work for the school 600
The school will continue to use the model to keep attendance above the required target. Both 601
the I1 and I2 initiatives are planned for the 2019/20 academic year. At the same time, the school 602
should consider tackling Friday absenteeism, given that Friday is now their new problematic school 603
day. Given that the dynamics may be slightly different as outlined in Section5.3, the school should 604
explore a new series of initiatives, perhaps entitled “Fun-d-mental” Fridays, where the focus is still 605
on fun and excitement but also includes the “mental” aspect which emphasizes the need for pupils 606
and parents to treat Friday as an essential learning day. Further, the play on the word “fundamental” 607
also emphasizes that Fridays are a key part of overall learning (fundamental to learning) as it usually 608
involves a consolidation of the week’s work where the various concepts and pieces of work that pupils 609
have learned during the work are brought together to both evaluate pupils’ learning and demonstrate 610
(to them) how all the learning fits together. It should be noted that schools already use Fridays in this 611
way, for example: “Big Write” or “Cold Write” to consolidate the week’s writing activities as well as 612
arithmetic testing to assess pupils’ learning and ability to apply the mathematical concepts learned 613
during the week [20]. 614
6.2.2. Future work for the authors 615
The authors have realised, through this study, that school leaders and staff have predominantly 616
been trained in the pedagogical aspects of education and thus do not possess advanced skills in 617
analytics. In light of this, the authors will investigate automating the proposed approach and include 618
a graphical user interface with customisable analytical fields into a software program so that school 619
practitioners can benefit from the use of the model across a variety of school fields (e.g. attendance, 620
progress, behaviour, etcetera) without the need to conduct detailed programming and data mining by 621
themselves. The authors will also consider rolling out the approach and software program to other 622
schools so that the benefits and lessons learned at WPS can be shared and maximised. 623
Author Contributions:All authors made significant contributions throughout this piece of research and agreed 624
to submit the manuscript in the current form. The first author made major contribution in terms of writing 625
and implementing software. All the authors contributed in terms of conceptualisation, writing and revising the 626
manuscript. 627
Funding:This research received no external funding 628
Acknowledgments: The authors would like to thank the leadership and staff of Willen Primary School for 629
permitting us to use their data and for their efforts in supporting this study, in particular, Ms Emma Warner 630
(attendance officer), Ms Carrie Matthews (headteacher), and Ms Sarah Orr (deputy headteacher). 631
Conflicts of Interest:The authors declare no conflict of interest. 632
Appendix A. Data Tables
633
Detailed data tables are provided that includes the school roll, population size for this study, 634
attendance data, and the number of extracted rules. 635
Appendix A.1. School Roll and Study Population Size 636
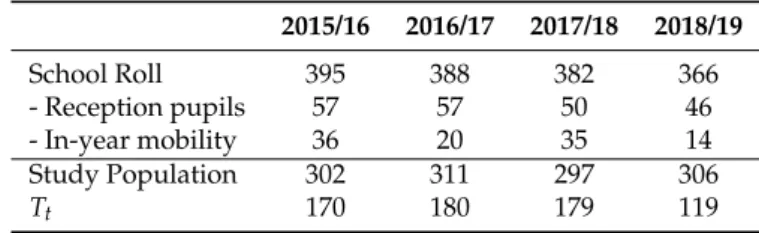
The school roll and study population size is presented in TableA1. Note that children who join 637
the roll during the school year were removed from the study population to prevent skewed data, as 638
discussed in Section4.2.2. Children in the Reception year join the school’s attendance roll once they 639
turn 5 years old, which almost always occurs after the start of the school year. 640
Table A1.School Roll, and Study Population Size for 2015/16, 2016/17, 2017/18 and 2018/19 2015/16 2016/17 2017/18 2018/19 School Roll 395 388 382 366 - Reception pupils 57 57 50 46 - In-year mobility 36 20 35 14 Study Population 302 311 297 306 Tt 170 180 179 119
Appendix A.2. Attendance Tables 641
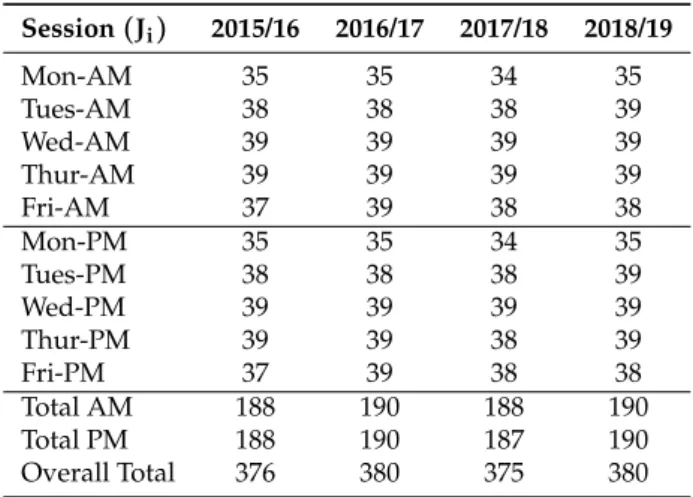
TableA2details the number of possible sessions for each year, whilst TableA3details the actual 642
attendance record for each session. 643
Table A2.Possible Sessions for 2015/16, 2016/17, 2017/18 and 2018/19 Session(Ji) 2015/16 2016/17 2017/18 2018/19 Mon-AM 35 35 34 35 Tues-AM 38 38 38 39 Wed-AM 39 39 39 39 Thur-AM 39 39 39 39 Fri-AM 37 39 38 38 Mon-PM 35 35 34 35 Tues-PM 38 38 38 39 Wed-PM 39 39 39 39 Thur-PM 39 39 38 39 Fri-PM 37 39 38 38 Total AM 188 190 188 190 Total PM 188 190 187 190 Overall Total 376 380 375 380
Table A3.Actual Average Attendance for each session for 2015/16, 2016/17, 2017/18 and 2018/19 Session(Ji) 2015/16 2016/17 2017/18 2018/19 Mon-AM 32.8 32.9 31.9 33.5 Tues-AM 35.8 36.3 35.9 37.4 Wed-AM 37.1 37.2 37.2 37.5 Thur-AM 37.0 37.3 37.0 37.5 Fri-AM 35.0 36.4 35.8 36.2 Mon-PM 32.9 33.1 32.0 33.7 Tues-PM 36.0 36.3 36.1 37.7 Wed-PM 37.2 37.3 37.4 37.6 Thur-PM 37.2 37.3 36.3 37.6 Fri-PM 35.1 37.0 35.9 36.3 Total AM 177.7 180.1 177.8 182.1 Total PM 178.4 181.0 177.7 182.9 Overall Total 356.1 361.1 355.5 365.0 Appendix A.3. Number of Rules Extracted
644
TableA4details the number of rules extracted per year using minsup = 0.3, and minconf = 0.3. 645
Table A4.Rule Extracted for 2015/16, 2016/17, 2017/18 and 2018/19, minsup = 0.3, minconf = 0.3 2015/16 2016/17 2017/18 2018/19 Number of Rules 311 535 309 144 Study Population 302 311 297 306 Tt 170 180 179 119 References 646
1. Balfanz, R.; Byrnes, V. Chronic absenteeism: Summarizing what we know from nationally available data. 647
Baltimore: Johns Hopkins University Center for Social Organization of Schools2012,1, 1–46. 648
2. Cook, P.J.; Dodge, K.A.; Gifford, E.J.; Schulting, A.B. A new program to prevent primary school absenteeism: 649
Results of a pilot study in five schools. Children and Youth Services Review2017,82, 262–270. 650
3. Havik, T.; Bru, E.; Ertesvåg, S.K. School factors associated with school refusal-and truancy-related reasons 651
for school non-attendance.Social Psychology of Education2015,18, 221–240. 652
![Figure 1. Action Research Process as outlined in [31]](https://thumb-us.123doks.com/thumbv2/123dok_us/10860516.2974660/8.892.204.698.455.717/figure-action-research-process-outlined.webp)