A v a i l a b l e o n l i n e a t w w w . s c i e n c e d i r e c t . c o m
j o u r n a l h o m e p a g e : w w w . e l s e v i e r . c o m / l o c a t e / j v a l
ISPOR TASK FORCE REPORT
Budget Impact Analysis
—
Principles of Good Practice: Report of the ISPOR
2012 Budget Impact Analysis Good Practice II Task Force
Sean D. Sullivan, PhD1, Josephine A. Mauskopf, PhD2,, Federico Augustovski, MD, MSc, PhD3, J. Jaime Caro, MDCM, FRCPC, FACP4, Karen M. Lee, MA5, Mark Minchin, MBA6, Ewa Orlewska, MD, PhD7,8, Pete Penna, PharmD9,
Jose-Manuel Rodriguez Barrios, RPh, MPH, MSc10, Wen-Yi Shau, PhD, MD11
1Pharmaceutical Outcomes Research and Policy Program, University of Washington, Seattle, WA, USA;2RTI Health Solutions, Research Triangle Park, NC, USA; 3Health Economic Evaluation and Technology Assessment, Institute for Clinical Effectiveness and Health Policy, Buenos Aires, Argentina;4Evidera, Lexington,
MA, USA;5Health Economics, Canadian Agency for Drugs and Technologies in Health, Ottawa, ON, Canada;6PASLU, National Institute for Health and Care
Excellence, Manchester, UK;7Centre for Pharmacoeconomics, Warsaw, Poland;8The Jan Kochanowski University, Kielce, Poland;9Formulary Resources, LLC,
Mercer Island, WA, USA;10Stryker, Madrid, Spain;11Center for Drug Evaluation, Taipei, Taiwan
A B S T R A C T
Background: Budget impact analyses (BIAs) are an essential part of a comprehensive economic assessment of a health care intervention and are increasingly required by reimbursement authorities as part of a listing or reimbursement submission.Objectives:The objective of this report was to present updated guidance on methods for those under-taking such analyses or for those reviewing the results of such analyses. This update was needed, in part, because of developments in BIA methods as well as a growing interest, particularly in emerging markets, in matters related to affordability and population health impacts of health care interventions.Methods: The Task Force was approved by the International Society for Pharmacoeconomics and Outcomes Research Health Sciences Policy Council and appointed by its Board of Directors. Members were experienced developers or users of BIAs; worked in academia and industry and as advisors to govern-ments; and came from several countries in North America and South America, Oceania, Asia, and Europe. The Task Force solicited com-ments on the drafts from a core group of external reviewers and, more broadly, from the membership of the International Society for Phar-macoeconomics and Outcomes Research. Results: The Task Force recommends that the design of a BIA for a new health care intervention should take into account relevant features of the health care system, possible access restrictions, the anticipated uptake of the new inter-vention, and the use and effects of the current and new interventions. The key elements of a BIA include estimating the size of the eligible population, the current mix of treatments and the expected mix after the introduction of the new intervention, the cost of the treatment mixes, and any changes expected in condition-related costs. Where possible, the BIA calculations should be performed by using a simple cost calculator approach because of its ease of use for budget holders. In instances, however, in which the changes in eligible population size, disease severity mix, or treatment patterns cannot be credibly captured by using the cost calculator approach, a cohort or patient-level
condition-specific model may be used to estimate the budget impact of the new intervention, accounting appropriately for those entering and leaving the eligible population over time. In either case, the BIA should use data that reflect values specific to a particular decision maker’s population. Sensitivity analysis should be of alternative scenarios chosen from the perspective of the decision maker. The validation of the model should include at least face validity with decision makers and verification of the calculations. Data sources for the BIA should include published clinical trial estimates and compara-tor studies for the efficacy and safety of the current and new interventions as well as the decision maker’s own population for the other parameter estimates, where possible. Other data sources include the use of published data, well-recognized local or national statistical information, and, in special circumstances, expert opinion. Reporting of the BIA should provide detailed information about the input parameter values and calculations at a level of detail that would allow another modeler to replicate the analysis. The outcomes of the BIA should be presented in the format of interest to health care decision makers. In a computer program, options should be provided for differ-ent categories of costs to be included or excluded from the analysis.
Conclusions:We recommend a framework for the BIA, provide guid-ance on the acquisition and use of data, and offer a common reporting format that will promote standardization and transparency. Adherence to these good research practice principles would not necessarily super-sede jurisdiction-specific BIA guidelines but may support and enhance local recommendations or serve as a starting point for payers wishing to promulgate methodology guidelines.
Keywords: budget impact analysis, cost calculator, economic
evaluation, methodology, modeling.
Copyright&2014, International Society for Pharmacoeconomics and Outcomes Research (ISPOR). Published by Elsevier Inc.
1098-3015/$36.00 –see front matter Copyright&2014, International Society for Pharmacoeconomics and Outcomes Research (ISPOR). Published by Elsevier Inc.
http://dx.doi.org/10.1016/j.jval.2013.08.2291
E-mail:[email protected].
*Address correspondence to: Josephine A. Mauskopf, RTI Health Solutions, 3040 Cornwallis Road, Research Triangle Park, NC 27709, USA.
Introduction
Definition and Intended Use
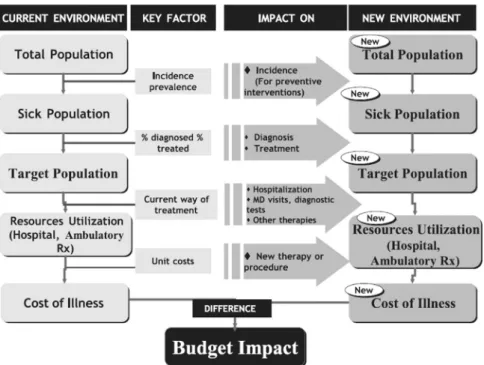
BIAs are increasingly required by reimbursement authorities, along with a CEA, as part of a listing or reimbursement sub-mission. A BIA addresses the expected changes in the expendi-ture of a health care system after the adoption of a new intervention (Fig. 1). A BIA can also be used for budget or resource planning. A BIA can be freestanding or part of a comprehensive economic assessment along with a CEA.
Users of BIAs include those who manage and plan health care budgets, such as administrators of national or regional health care programs, of private health insurance plans, and of health care delivery organizations, or employers who pay directly for health care. Each has a need for clearly presented information on thefiscal impact of the adoption and diffusion of new health care interventions. They may differ, however, in their requirements for particular time horizons and for the categories of costs in which they are interested.
Context
Mauskopf[3]published an analytic framework for a BIA in 1998. Others[4–8]have published articles describing methods for the BIA. Starting in the 1990s, most regions in the world including Australia, North America (Canada and the United States), Europe (England and Wales, Spain, Belgium, France, Hungary, Italy, and Poland), South America (Brazil and Columbia), Asia (South Korea, Taiwan, and Thailand), and the Middle East (Israel) have included a request for the BIA as part of the evidence base to support national or local formulary listing or reimbursement. Country-specific guidelines for constructing and presenting BIAs have also been developed. We include a sample of country-specific guidelines with URL links in
Appendix AinSupplemental Materialsfound athttp://dx.doi.org/10. 1016/j.jval.2013.08.2291. The main purpose of this report was to supplement the country-specific guidelines by presenting thefind ings of an ISPOR Task Force convened to update the methods and reporting guidance for BIAs.
Organization of the Document
The panel recognizes that the methods for performing and reporting BIAs continue to develop. This report highlights areas of consensus as well as areas in which continued methodological development is needed. The guidance is divided into three main sections: 1) analytic framework, 2) inputs and data sources, and 3) reporting format.
Recommendations for Analytic Framework
A BIA is a means of synthesizing available knowledge at the time of a coverage or formulary listing decision to estimate the likely financial consequences of that decision for a health care system. Given the systems’ highly local nature and decision makers’
varying perspectives, a BIA cannot give a single estimate appli-cable to all decision makers. Instead, the purpose of a BIA is to provide a valid computing framework—a “model”—that allows users to apply input values and viewfinancial estimates perti-nent to their setting. Thus, the outcomes of the BIA should reflect scenarios consisting of specific assumptions and data inputs of interest to the decision maker rather than a normative“base”
case intended to be generally applicable.
This section presents Task Force recommendations for the key analytic framework elements for a freestanding BIA. Com-ments are provided for the situation in which a companion CEA exists. Proper design of the analytic framework is a crucial step in a BIA. The design must take into account relevant features of the
Background to the Task Force
This International Society for Pharmacoeconomics and Outcomes Research (ISPOR) Task Force report presents an update of the Task Force Report on Budget Impact Analysis (BIA) that was published in 2007[1]. The update was needed, in part, because of the growing recognition of BIAs as freestanding economic evaluations, together with developments in methods and a growing interest, particularly in emerging markets, in matters related to afford-ability and population health impacts of health care interventions. Specific issues that are addressed more fully in this updated report include: 1) selection of the analytic framework, 2) representation of uncertainty, 3) estimation of input parameter values, 4) whether and how to coordinate the structure and inputs with a companion cost-effectiveness analysis (CEA), 5) whether to estimate and present health benefits as well as costs, and 6) how best to present the results in a format useful for the decision maker. The document presents examples from the growing literature as well as Web-based BIAs that are in the public domain.
The cochairs of the Task Force—Josephine A. Mauskopf and Sean D. Sullivan—were appointed in 2012 by the ISPOR Board of Directors. The members of the Task Force were invited by the cochairs to participate with advice and consent from the ISPOR Board of Directors. Individual members of the Task Force are experienced developers or users of BIAs. Because the purpose of this report was to produce guidance on the preparation and presentation of BIAs that meet the information needs of health care decision makers globally, the Task Force included individuals who represent or advise payers and health technology assessment agencies in North America, Europe, Latin America, and Asia.
The Task Force held an organizational meeting at the ISPOR 17th Annual International Meeting in Washington, DC, and an open forum at the ISPOR 18th Annual International Meeting in New Orleans, LA. Before preparing the first draft of the updated report, a targeted search of recent publications on BIAs was performed to evaluate methods appearing in peer-reviewed journals. The costing templates and the methods and reporting guidance produced by the UK National Institute of Health and Care Excellence (NICE), the Academy for Managed Care Phar-macy Format for Formulary Submission, and the Taiwan Health Technology Assessment body were reviewed. Published na-tional and local guidelines were also collected and used as reference documents. The Task Force held telephone confer-ence calls and used e-mail to exchange outlines and ideas during subsequent months. Sections of the revised report were then prepared by subgroups of the Task Force members, and a draft of the complete report was then prepared by the cochairs and circulated to the Task Force for review. A telephone conference call followed by a face-to-face meeting of the Task Force was held to discuss the draft and make revisions before sending it out for review.
A primary review group of reviewers experienced in devel-oping and communicating BIAs had previously been identified. Comments were sought from this primary review group before wider circulation of the draft report for review. After this initial review, a new draft, responding to comments, was prepared by the Task Force members and made accessible for broader review by all ISPOR members. This final report reflects the input from both primary and “all-member” reviewers.
health care system, possible access restrictions, the anticipated uptake of the new intervention, and the use and effects of the current and new interventions. These guidelines do not address how to construct the model but rather highlight key aspects to consider during its design, including the choice of modeling technique. It is important that whatever choices are made, they should be clear and justified and should lead to the simplest design that will meet the needs of the budget holder. Aspects important for the design of the analytic framework are listed in
Table 1and described in the following sections.
Features of the Health Care System
The features of the health care system that should be considered are those that influence the budget and may be affected by the
coverage decision (e.g., readmission within 30 days of discharge may not be paid for and, thus, a change in that rate will not affect the payer’s budget but would have a significant impact on the hospital or provider budget). Access restrictions for health tech-nologies are important features that vary widely across systems. In a few systems, the only possibilities are to cover fully or not at all; but in most systems, there are many options, including administrative and clinical hurdles to meet, restrictions on for whom and under what conditions the technology is reimbursed, and the extent to which patients pay a portion of the expense. These features should be incorporated so that they can be customized locally. This is important not only for the new intervention but also for current interventions, particularly if restrictions are likely to change for the current interventions.
Perspective
Given the purpose of a BIA, the recommended perspective is that of the budget holder. The budget holder is highly localized and may range from a single payer covering an entire health care system through specific providers or areas within a health system (e.g., pharmacy) to a single patient or family. A BIA needs to be flexible to generate estimates that include various combinations of health care, social services, and other costs, depending on the perspective. For example, in one location, the pharmacy budget holder will be concerned only with the expenses for drugs, but in another, this may be subsumed within a hospital or regional budget. With a flexible design, the BIA will be able to show decision makers not only what they want to see but also 1) the larger economic implications of the intervention and 2) the impact on other budget holders.
Use and Cost of Current and New Interventions Eligible population
The population to be included in a BIA should be all patients eligible for the new intervention during the time horizon of
Fig. 1–Budget impact schematic. MD, doctor of medicine; Rx, prescription drug treatment. Adapted from Pharmacoecon
Spanish Res Artic, 2, Brosa M, Gisbert R, Rodríguez Barrios JM, et al., métodos y aplicaciones del análisis del impacto
presupuestario en sanidad, 65–79, 2005. et al.[2].
Table 1–Aspects to be considered in the design of a budget impact analysis.
Features of the health care system
Perspective
Use and cost of current and new interventions ○Eligible population
○Current interventions
○Uptake of new intervention and market effects ○Off-label uses of the new intervention ○Cost of the current or new intervention mix
Impact on other costs ○Condition-related costs ○Indirect costs
Time horizon
Time dependencies and discounting
Choice of computing framework
Uncertainty and scenario analysis
interest, given any access restrictions. Definition of this eligible population begins by estimating the number covered by the locally approved indications for the new technology. It then needs to reflect any planned restrictions on use or reimburse-ment as well as uptake (see the next section), including possible beyond-restriction use (leakage), use in previously untreated patients who now seek treatment because of improved out-comes, greater convenience, or fewer side effects (induced demand), and changes in patterns of use (e.g., a new intervention with fewer side effects, making it attractive to treat earlier disease[9]).
The eligible population is open in the sense that individuals enter or leave depending on whether they meet the criteria for inclusion (e.g., by developing the indication, meeting the restric-tions, no longer having symptoms, and dying). If the entering and leaving rates are in steady state, the size of the eligible popula-tion will not change over time. But it will change if the new intervention increases time on treatment, slows disease progression, or reduces mortality without curing the condition (e.g., given an eligibility criterion of moderate disease severity and a new treatment that delays progression to severe disease, the eligible population will grow). The analytic framework should account for the impact of these changes on the size of the eligible population.
It is also important to consider the proportion of the eligible population in different subgroups defined by disease severity or stage, comorbidities, age, sex, ethnicity, and other characteristics. The choice of subgroups should be founded on available evidence regarding costs associated with different subgroups that may affect the new intervention’s budget impact. The analytic frame-work should incorporate these if relevant, particularly if the proportion in each subgroup is likely to change with the new intervention.
Current interventions
A BIA compares scenarios defined by sets of, rather than specific individual, interventions. The starting scenario should be the current intervention mix for the eligible population. The current mix may include no intervention as well as interventions that might be replaced by the new one. Interventions used off-label in the eligible population may also be included. This should not be viewed as the promotion of off-label use but rather as the description of the current intervention mix. The analytic frame-work should allow for variations in usage likely to be encountered and cost-relevant details of how they are used (e.g., monitoring, titration, and use only on site). If a diagnostic test is required to identify eligible individuals, this should be included and the frequency of use should reflect local practice.
Uptake of a new intervention and market effects
The introduction of a new intervention sets in motion various marketplace dynamics, including product substitution and pos-sibly market expansion. The uptake of the new intervention is, by definition, not known at the time of analysis and neither is the impact on the current intervention mix. Three types of changes should be included: the new intervention replaces one or more current interventions (substitution); the new intervention is added to current interventions (combination); and the new intervention is used in situations in which there has been no active intervention (only supportive care) or in patients who have stopped or would not use available interventions owing to intolerance, inconvenience, loss of effect, or any other reasons (expansion). These changes could apply to different population subgroups and the distribution of changes can vary over time; that is, the changes do not happen instantaneously when the
new product hits the market. Forecasts of these changes over time are a challenging but important component of the BIA.
The changes have different implications for the budget holder. With substitution, the expenses of the new intervention may be partially offset by reduced use of current interventions. The offset should consider not only the interventions displaced but also associated aspects such as laboratory testing and management of side effects. For example, direct thrombin inhibitors do not require monitoring tests needed with warfarin [10], reducing the need for services developed to deliver that monitoring. Combination will incur new expenses, including possible addi-tional costs owing to changes in the side-effect profile of the combinations or new monitoring requirements. Market expan-sion introduces new intervention costs, but there may be off-setting savings in the management of previously untreated patients.
The uptake of the new intervention and its impact on the current intervention mix are core components of the BIA. Unfortunately, in most cases, there may be little data on this whereas the results of the BIA may be very sensitive to alter-native assumptions. The analysis should be transparent regard-ing the assumptions about the intervention mix and changes expected with the uptake of the new intervention. Whether the framework should be limited to simple rates over time or should consider more complex nonlinear functions where uptake depends on other factors (e.g., access restrictions) depends on the context and should be influenced by any data on similar interventions. It is important that the framework allows users to test alternative assumptions about uptake and its impact on current interventions. This is a type of structural uncertainty analysis that is of particular importance when estimating budget impact.
Off-label uses of the new intervention
The new intervention may be used in patients without the treatment indication (off-label use). Because there will be little or no effectiveness or safety data on such off-label use and promotion of off-label use should be avoided, inclusion in the BIA is not recommended unless the budget holder specifically requests its inclusion.
Cost of the current and new intervention mix
The cost of the current or new intervention mix is determined by multiplying the budget holder’s price for each intervention by proportion of the eligible population using that intervention and by the number of people in the eligible population.
Impact on Other Costs Condition-related costs
The introduction of new interventions may result in changes in the symptoms, disease duration, disease outcomes, or disease-progression rates associated with the health condition and, thus, in changes in the use of condition-related health care services. For example, in HIV infection, a new intervention that prolongs time in a higher CD4 cell count range will likely reduce the HIV-related costs such as those for treating opportunistic infections. Although inclusion of changes in condition-related costs may require substantial assumptions and may extend beyond the relevant time horizon, this effect might be relevant for some decision makers. In a BIA with a companion CEA, these estimates may be available from the CEA. Therefore, if credible data are available and these changes have an impact on health care budgets, condition-related costs should be presented in the BIA. If the decision is made to include these condition-related costs in
the BIA, the model should be designed so that a user can view the results both with and without them.
In some cases, the intervention alters health care service use (e.g., hospital days or physician visits) and, thus, the capacity of the system, but this may have no direct monetary consequence for the budget holder because the system will not adjustfi nan-cially within the model time horizon (e.g., personnel may not be redeployed or let go). It may still be desirable to describe this impact on health service use because it may have implications for health system planning regardless of the budget impact. Indirect costs
The impact of the new intervention on productivity, social services, and other costs outside the health care system should not be included routinely in a BIA, because these aspects are not generally relevant to the budget holder. One exception may be when the BIA is intended to inform private health insurers or employers. Such organizations have a vested interest in main-taining a healthy and productive workforce and, thus, they may be able to offset productivity gains against increased health care costs. Another exception may be health care systems relying on tax subsidies where lost production due to morbidity could have important implications for the funding for the national health care system.
Time Horizon
BIAs should be presented for the time horizons of relevance to the budget holder, in accordance with their budgeting process and periods (e.g., monthly, quarterly, and annual). A time horizon of 1 to 5 years is common, with the results presented for each budget period after the new intervention is covered. The frame-work should also allow for other time horizons. Although time horizons that go beyond a few years require considerable assumptions, they may be needed to illustrate the offsetting disease cost savings from the intervention that may occur in future years (e.g., interventions that cure chronic hepatitis and, thus, prevent liver cirrhosis or liver cancer that occur far in the future).
Time Dependencies and Discounting
Several aspects of a BIA may vary over time. These include the value of the currency used (i.e., due to inflation/deflation); uptake; new interventions entering the mix; changes in prices (e.g., due to patent expiration); and changes in understanding of disease, indications, and management practices. Forecasting these changes is quite challenging, but an attempt should be made for the time horizon of the BIA, provided that the assumptions are clear, justified, and supported by evidence as feasible.
In a CEA, in which comparisons of the expected effects for the full duration of those effects are made at the decision time, it is commonplace to reflect time preferences by discounting all financialflows to a net present value. This is not recommended for a BIA because the budget holder’s interest is in what impact is expected at each point in time. Thus, the BIA should present the financial streams at each budget period as undiscounted costs. If a decision maker still wishes to calculate a net present value, it can easily be done and the model can facilitate this, but this is generally not required.
Choice of Computing Framework
The computing framework for a BIA can be a simple cost calculator programmed in a spreadsheet (e.g., see references
[11–14]as well as costing templates produced by NICE, which are available at http://www.nice.org.uk). The cost calculator approach is the preferred option because it is more easily under
stood by budget holders. In instances in which the changes in eligible population size, disease severity mix, or intervention patterns cannot be credibly captured directly by using the cost calculator approach, a condition-specific cohort or individual simulation model may be programmed to compare the costs for the current and future treatment mix for the eligible population, accounting appropriately for those entering and leaving the eligible population over time (e.g., see references [15–22]). In either case, these models should follow the methods guidance of the ISPOR-SMDM Good Modeling Practices Task Force and the full documentation should be made available to the decision makers[23].
Uncertainty and Scenario Analyses
Uncertainty of two types is relevant to a BIA: parameter uncer-tainty in the input values used and structural unceruncer-tainty introduced by the assumptions made in framing the BIA[24]. Examples of parameter uncertainty include efficacy estimates for current and new interventions, and of structural uncertainty include changes in expected intervention patterns with the availability of the new intervention and restrictions for use. Because there are limited data for many of the parameters, much of the parameter uncertainty of BIAs cannot be meaningfully quantified and thus standard approaches such as one-way and probabilistic sensitivity analyses cannot be carried out fully. Moreover, much of the uncertainty is structural and not easily parameterized. Thus, scenario analyses should be undertaken by changing selected input parameter values and structural assumptions to produce plausible alternative scenarios.
Validation
The computing framework and input data used for a BIA must be sufficiently valid to credibly inform the budget holder’s decisions. Two of the standard steps in validation should be applied in the BIA: 1) determine face validity through agreement with relevant decision makers on the computing framework, aspects included, and how they are addressed (e.g., access restrictions and time horizon); and 2) verification of the cost calculator or model implementation, including all formulas[25]. In addition, where possible, the observed costs in a health plan with the current interventions should be compared with the initial-year estimates from a BIA. For research purposes, after the new intervention is introduced, data could be collected and compared with the estimates from a BIA. Although this would not be relevant for the decision already taken, if the results are close then it would provide confidence in the approach for future interventions.
Recommendations for Inputs and Data Sources
Once the analytic framework is developed, it is populated with data relevant to the budget holder. The usefulness of a BIA depends, in part, on the quality, accuracy, and applicability of the data. To provide credible budget impact estimates, data should be from the best available sources and thoroughly referenced to support transparency and replication. In this section, the Task Force recommends possible data sources for each of thefive elements of a BIA:
Size and characteristics of the eligible population; Intervention mix without and with the new intervention; Costs of the current and new intervention mix; Use and cost of other condition-related health care services; and Ranges and alternative values for uncertainty and scenario analyses.General Recommendations
The developer of the BIA should be familiar with specific data requirements of the budget holder. Most importantly, the input data should be relevant to the budget holder. For example, data from one country may not be credible in another country. The data sources should be appropriate to the study question, and their reliability should be assessed.Table 2summarizes exam-ples of data sources that can be used to populate a BIA.
Size and Characteristics of the Eligible Population
The BIA requires estimates of the size of the eligible population and of the distributions of any characteristics that may influence the budget impact. The preferred approach is to obtain estimates of the size and characteristics of their eligible population directly from budget holders. Because these data are usually not publicly available, various alternative methods can be used to provide estimates for a BIA. If budget holders’ data are not available, national or regional data on the incidence or prevalence of the condition of interest can be applied to the budget holder’s population by adjusting for known characteristics that may differ from the national or regional population, such as sex, age, race, or risk group. For example, to estimate the number of people with HIV infection in a regional health plan, national prevalence estimates may need to be adjusted if the proportion of high-risk individuals covered by the regional health plan differs markedly from that in the national data.
Once the size of the population with the condition of interest has been estimated, the proportion that are diagnosed and treated and the mix of disease severity must be estimated. This generally involves the application of successively more restrictive inclusion criteria to estimate the number of people eligible for the new intervention. These estimates should come from the budget holder, but other sources such as data from natural history studies of chronic conditions may be needed to estimate the proportion of the eligible population at different disease stages or with different levels of disease severity.
It is important for the analyst to estimate not only the current size of the eligible population and disease severity mix but also the way that these estimates may change over the model time horizon without and with the new intervention. Examples of such changes in the population size and/or disease severity mix because of improved efficacy include increased life expectancy for those with end-stage cancer or decreased disease severity due to increased CD4 cell counts for those with HIV infection. These changes could affect the budget impact of the new intervention. Data should be obtained from clinical trials or registries, where available, to estimate these changes. In addition, any increased ability to identify eligible patients (such as diagnostic tests) that would increase the population size or change the disease severity mix should be captured by using published data or expert opinion.
One important consideration for a chronic condition that can influence the budget impact of a new intervention over thefirst few years after it is introduced is whether there will be a catch-up effect. For example, if a new drug is indicated for those who have previously failed a specified therapy for a chronic condition, there are two possible population subgroups who are eligible for the new intervention for each year of the analysis: those who just failed the specified therapy and are choosing a switch therapy and those who failed the specified therapy one or more years ago and have already switched either to best supportive care or to another therapy that may be less effective than the new drug (the“ catch-up”subgroup). To effectively include the newly eligible and catch-up subpopulations in the BIA, information on the size of each eligible subpopulation should be obtained from the budget holder or relevant epidemiologic studies, and estimates of the uptake of the new intervention by the catch-up subgroup should be obtained from the sources described in the next section.
Current and New Intervention Mix
The recommended source for the current intervention mix is the budget holder’s own data. If these data are not available, then published information on current intervention patterns from registries, claims databases, local surveys, market research, or other secondary sources can be used. Although labeled“current,”
the intervention mix may evolve over time even in the absence of the new intervention and the program should be designed so that this can be taken into account in the BIA. Estimates of changes in the mix of interventions over time should be based on past changes, market research, or clinical expert opinion. An example would be if one of the current treatments is scheduled to go off patent within the time horizon of the BIA, with an expectation that its share of the treatment mix will increase when patent protection is lost. These changes should be estimated by using observed changes in the past for similar drugs, market research, or clinical expert opinion. If there are many current interventions but only a few of them are commonly used, the current inter-vention mix can be restricted to those in common use but with placeholders included in the model for the budget holder to enter other interventions that may be affected by the new intervention. The new intervention mix depends on the rate of uptake of the new intervention as well as the extent to which it replaces or augments the current interventions. The rate of uptake is likely to change over time as physicians and patients become familiar with a new intervention. There are several recommended ways to estimate the rate of uptake of the new intervention mix: 1) use data from another jurisdiction where the intervention has been introduced; 2) use estimates of expected market share from the producer; and 3) extrapolate from experience on product diffusion with similar interventions in the budget holder’s setting. With all three approaches a determination must be made as to whether the new intervention will be added to the current interventions or whether it will substitute for some or all of the current interventions. The indication for the new intervention should determine whether it would be used as add-on therapy. Market research, producer estimates, or clinical expert opinions are recommended sources for estimating the extent to which the use of each current inter-vention will be reduced when the new interinter-vention is available.
Cost of the Current and New Intervention Mix
Cost estimates should be based on the actual acquisition cost of the intervention for the budget holder (including any discounts, rebates, or other adjustments that may apply) as well as addi-tional costs for required diagnostics. When actual acquisition costs are unavailable, the analyst should use public prices such as wholesale acquisition costs, list prices, or formulary costs. The Table 2–Examples of data sources to populate
budget impact analyses.
Real-life use and cost data from registries or databases reflective of the budget holder perspective.
Data from clinical trials specific to or extrapolated to the budget holder population.
Uptake, usage, and adherence data from international sources, from similar populations, and with similar practice patterns.
Market research data to identify comparator product distribution and early use of intervention alternatives and trends in treatment patterns.
analysis should be designed so that discounts, deductibles, and co-payments can be subtracted from these costs to capture the actual payment by the budget holder. For devices or supplies, wholesale or health system–negotiated prices should be used; for procedures and diagnostics, standard labor costs should be included in addition to the costs of any devices or supplies used. The cost of the intervention should also reflect any costs associated with administration and monitoring. Administration and monitoring costs are estimated by applying local unit costs to health care services used. If the latter are unknown locally, the products labels or publications describing the administration and monitoring requirements should be used to estimate the health care services used.
Costs of managing any side effects or complications should also be included in the cost of the current and new intervention mix as a separate item. The rates of adverse events should be derived from product labels or publications for all interventions in the treatment mix. These are combined with the estimates of the costs of treating each adverse event. The costs might be incurred because of withdrawals from treatment or the need for health care services to manage the adverse events. If published studies of the adverse event costs are not available, treatment algorithms should be developed in consultation with physicians who treat each condition and local unit costs for the health care services should be applied.
Costing of the new intervention mix follows the same process as for the current mix except that for interventions not yet on the market, the acquisition cost has to be assumed if it is not yet set or is not publicly available and doses that will be used in actual practice will have to be estimated. The estimated dosing should be transparent and justified, if possible, on the basis of observed dosing patterns for similar interventions. In addition, the cost for administration and monitoring and treating side effects for the new intervention should be estimated in the same way as for interventions in the current mix with supportable data. If expert clinical opinion is used, care should be taken to frame the questions and choose the experts in ways that generate reliable and locally applicable information.
Use and Cost of Other Condition-Related Health Care Services
If condition-related costs are to be included, the following steps should be taken: estimate changes in health outcomes, identify relevant resource use that may change, estimate the size of the changes, and value these changes. In a BIA, identification of changes must be according to the perspective and interest of the budget holder. To estimate changes in health outcomes, data from the clinical studies should be used. Companion CEAs may provide an additional source for this information. The associated use of health care services over the time horizon of the BIA should be estimated by using local data. If local data are unavailable, consultation with physicians who regularly treat patients with the condition of interest may be considered. Unit costs appropriate for the budget holder should be applied to the changes expected in health care service use to calculate the budget impact of the changes in health outcomes. It is the actual opportunity costs that are relevant. These may be very difficult to estimate for a particular jurisdiction because of the way these services are paid for. If actual opportunity costs are not available, cost accounting approaches can be used.
Ranges and Alternative Values for Uncertainty and Scenario Analyses
The range of values to be used in uncertainty analyses should be obtained from the budget holders. Default ranges should be
obtained from a review of published studies or from consultation with physicians who treat patients with the condition of interest. The use of arbitrary ranges such as ⫾20% or ⫾50% is not recommended, because this does not reflect the actual uncer-tainty in the parameters especially from the perspective of the budget holder[24].
BIAs also include many parameters that vary among budget holders, such as population age and sex distribution in the health plan or health system, the health plan or system treatment patterns and restrictions, the disease incidence and prevalence in the health plan or health system, and drug and other health care service costs. Budget holder–specific information should be used to inform alternative “plausible scenarios,”varying these input parameter values.
If the impact of adherence and persistence with therapy is considered in a scenario analysis, the related assumptions should be based on database studies or prospective studies applicable to the budget holder. The BIA should also estimate the impact of adherence or persistence on intervention effective-ness and safety if condition-related costs are included in the BIA. If there are no published data on the relationship between adherence or persistence and health outcomes, then possible alternative data sources are either pharmacokinetic or pharma-codynamic data or expert opinion.
Recommendations for Reporting Format
This final section of the guidance presents a recommended reporting format for BIAs. The intent is to promote consistency and transparency in reporting.
Report Introduction
The introduction of a BIA report should include the objectives and perspective of the analysis as well as brief summaries of the relevant epidemiological, clinical, and economic information related to the eligible population and disease of interest. Objectives
The objective of the BIA should be clearly stated and tied to the study perspectives.
Epidemiology and management of health problem
The introduction should present information about the preva-lence and incidence of the particular disease, disease severity, disease progression, undiagnosed or undertreated cases, and risk factors pertinent to estimating the budget impact.
Clinical impact
The clinical information should consist of a brief description of the eligible population and existing management options and their efficacy and safety that are relevant to the design of the study of the BIA.
Economic impact
The economic impact information should include a brief descrip-tion of previous BIAs in the condidescrip-tion of interest for another intervention and condition-specific treatment patterns and cost-of-care studies.
Study Design and Methods
The report should specify the design of the BIA, which will usually involve either a cost calculator or a condition-specific cohort or individual simulation model. The following
characteristics of the analytical framework should be described and the sources identified.
Patient population
This section should clearly specify the eligible population for the new intervention.
Intervention mix
This section should contain a detailed description of the use and characteristics of each intervention in the current intervention mix and in the expected intervention mix after the introduction of the new intervention. The mix of interventions has specific rates that vary within and across health systems, and so the rates assumed should be stated in the tables describing the interven-tion mix [26]. Some patients may receive combination treat-ments. This should be recorded separately in the intervention mix table.
The relevant characteristics of each intervention in the treatment mix should also be provided. These include the approved indication, dose, efficacy, adverse events, and adher-ence issues.
Time horizon
The time horizon(s) of the BIA should be presented and the choice(s) justified.
Perspective
This section should clearly identify the BIAs’perspective(s), the cost categories included, and the intended audience (i.e., for which decision-making body or budget holder the study is intended).
Analytic framework description
This section should contain a complete description of the structure of the BIA cost calculator or condition-specific cohort or individual simulation model. A graphical representation of the model, such as aflow diagram, should be included.
Input data
The input values used for the reported analyses, including alternative scenarios, should be presented. The level of detail should be such that the reader could replicate all the calculations in the model.
Data sources
The sources of data inputs should be described in detail. Any transformations or computations that are applied to the data should be described in sufficient detail to support replication. The strengths, weaknesses, limitations, and possible direction and magnitude of bias in these should be noted. Selection criteria for studies and databases used to derive the input values should be discussed.
Data collection
The methods and processes for any primary data collection and data abstraction tasks not reported elsewhere should be described and explained. The data collection forms or question-naires should be included in the appendix of the report. Analyses
A description of the calculations used to complete the BIA should be provided. The choice of all the scenarios presented in the results should be documented and justified.
Uncertainty
Uncertainty analysis methods should be described and justified.
Results
Results should be presented in a disaggregated manner to support flexibility required by the budget holder and other stakeholders with whom the budget holder must interact. The budget impact should be presented for each budget period over the time horizon. Both budget period resource use and costs should be presented. The estimates of resource use should be listed in a table that shows the change in use for each time period reported in the BIA, categorized by intervention use, intervention side effects, and condition-related. Another table should show the total and disaggregated (e.g., pharmacy, physician visit, out-patient care, inout-patient care, and home care) costs for each time period reported in the BIA. Changes in annual health outcomes may also be reported. This promotes transparency to the decision makers when a large budget impact is accompanied by large health benefits. The results of the uncertainty analyses and scenarios analyzed should be described and presented infigures or tables.
Conclusions and Limitations
State the main conclusions on the basis of the results of the BIA. Report the main limitations regarding key issues such as design aspects including off-label use and adherence assumptions and the completeness and quality of data inputs and sources.
Inclusion of Graphics and Tables
Graphical snapshots of the structure and data of the BIA can be useful for the users who may wish to copy them for inclusion in their own internal reporting. Use of the following tools is recommended.
Figure of the analytical framework
A graphical representation of the analytical framework makes it easier for the budget holder to understand the calculation of changes in resources and costs. Flow diagrams or other visual depictions of the cost calculator or condition-specific cohort or individual simulation model are recommended to be included with the analytical framework description.
Table of assumptions
All the major assumptions should be listed in a tabular form. Tables of inputs
All the input parameter values and their data sources and derivations should be presented in a tabular form.
Tables of outputs
All outputs should be presented in a tabular and/or graphical form.
Schematic representation of uncertainty analyses
Diagrams such as Tornado diagrams that graphically show the effect of appropriate ranges of each input parameter on the budget impact are a simple way of capturing the key drivers of the BIA and should be included along with the text on the results of the scenario analyses.
Appendices and References
The addition of relevant appendices to the main report is encouraged. The appendices may cover literature search
strategies, evidence summaries, intermediate results (e.g., of individual Delphi panel rounds), and the names and addresses of participating experts and investigators, for example.
Reporting BIAs Alongside CEAs
Recently, several published articles have included the design, methods, andfindings from the BIA and a companion CEA in a single article[16,27]. Although interrelated, however, these study designs require different structural considerations and some different and/or additional parameter estimates. They frequently take different perspectives and use different time horizons. When reporting a jointly conducted CEA and BIA in a single article or report, analysts should fully report all elements of both analyses. We further suggest that the BIA be reported by using the format described above and that the Consolidated Health Economic Evaluation Reporting Standards (CHEERS) format [28]
be used for reporting the CEA. If the journal or report has space restrictions, an appendix should be included with the article so that the needed detail can be presented.
Budget Impact Computer Program
Because BIAs need to beflexible enough to provide estimates for different health care decision makers, it is critical that the cost calculator or condition-specific cohort or individual simulation model program be designed with the capability for the users to enter their own values. The program should also allow the user to restore the original default parameters easily. The program should use easy-to-use spreadsheets in a common, easily acces-sible software platform. All input parameters should be pre-sented on one or a series of input worksheets. Identifying input cells with different colors depending on whether the user can enter data or not is useful. Output should be displayed in one or more worksheets in a logical manner that summarizes the findings for the user. Graphical output is often useful. In some cases, the budget holder may be interested in analyses from more than one perspective. In such cases, the user interface should be designed such that the user can easily toggle between the differ-ent perspectives. Sample uncertainty and scenario analyses should be provided. The program should allow the user to perform uncertainty and scenario analyses of relevance to them. Introductory worksheets should be included to describe the structure, assumptions, and use of the model. All sources, computations, and assumptions associated with input parame-ters should be displayed and full references should be included on a reference worksheet. The calculations should be accessible to the user and clearly and comprehensively presented. A well-documented user guide should be included.
Conclusions
BIAs are important for the economic evaluation of a new health intervention. This updated ISPOR Task Force report provides guidance for developing the analytic framework for a BIA, recommendations of data sources to use for making budgetary projections, a common reporting format that will promote con-sistency and transparency and guidance for the design of a BIA computer program. Adherence to these proposed good research practice principles would not necessarily supersede jurisdiction-specific BIA guidelines but may support and enhance local recommendations or serve as a starting point for payers wishing to promulgate methodology guidelines.
Acknowledgments
The following members of the primary review team provided helpful suggestions and comments on thefirst draft of the Task Force report: Lieven Annemans, PhD, C. Daniel Mullins, PhD, and Bong-Min Yang, PhD. The authors also thank the 84 ISPOR members from 24 countries for providing detailed comments on an earlier version of the report as well as Maria Swift from the ISPOR office for her excellent technical and administrative sup-port in all aspects of the Task Force process.
Source of financial support: None of the authors received financial support for their participation in this task force. All authors volunteered their time for discussion, research, and writing of this report.
Supplemental Materials
Supplemental material accompanying this article can be found in the online version as a hyperlink at http://dx.doi.org/10.1016/j. jval.2013.08.2291 or, if a hard copy of article, at www.valuein healthjournal.com/issues (select volume, issue, and article).
R E F E R E N C E S
[1]Mauskopf JA, Sullivan SD, Annemans L, et al. Principles of good practice for budget impact analysis: report of the ISPOR Task Force on Good Research Practices—Budget Impact Analysis. Value Health 2007;10:336–47.
[2]Brosa M, Gisbert R, Rodríguez Barrios JM, Principios Soto J. métodos y aplicaciones del análisis del impacto presupuestario en sanidad. Pharmacoecon Spanish Res Artic 2005;2:65–79.
[3]Mauskopf J. Prevalence-based economic evaluation. Value Health 1998;1:251–9.
[4]Trueman P, Drummond M, Hutton J. Developing guidance for budget impact analysis. Pharmacoeconomics 2001;19:609–21.
[5]Orlewska E, Mierzejewski P. Proposal of Polish guidelines for conducting
financial analysis and their comparison to existing guidance on budget impact in other countries. Value Health 2004;7:1–10.
[6]Nuijten M, Mittendorf T, Persson U. Practical issues in handling data input and uncertainty in a budget impact analysis. Eur J Health Econ 2011;12:231–41.
[7]Garattini L, van de Vooren K. Budget impact analysis in economic evaluation: a proposal for a clearer definition. Eur J Health Econ 2011;12:499–502.
[8]Garay OU, Caporale JE, Pichón-Riviere A, et al. Budgetary impact analysis in health: update with a model using generic approach. Rev Peru Med Exp Salud Publica 2011;28:540–7.
[9]Department of Health and Human Services Panel on Antiretroviral Guidelines for Adults and Adolescents. Guidelines for the use of antiretroviral agents in HIV-1-infected adults and adolescents. Available from: http://aidsinfo.nih.gov/ContentFiles/
AdultandAdolescentGL.pdf. [Accessed March 27, 2012].
[10]Goel R, Svivathsan K. Newer oral anticoagulant agents: a new era in medicine. Curr Cardiol Rev 2012;8:158–65.
[11]Chang J, Sung J. Health plan budget impact analysis for pimecrolimus. J Manag Care Pharm 2005;11:66–73.
[12]Danese MD, Reyes C, Northridge K, et al. Budget impact model of adding erlotinib to a regimen of gemcitabine for the treatment of locally advanced, nonresectable or metastatic pancreatic cancer. Clin Ther 2008;30:775–84.
[13]Dee A, Hutchinson M, De La Harpe D. A budget impact analysis of natalizumab use in Ireland. Ir J Med Sci 2012;181:199–204. [14]Smith DG, Cerulli A, Frech FH. Use of valsartan for the treatment of
heart-failure patients not receiving ACE inhibitors: a budget impact analysis. Clin Ther 2005;27:951–9.
[15]Mauskopf J. Meeting the NICE requirements: a Markov model approach. Value Health 2000;3:287–93.
[16]Marchetti M, Caruggi M, Colombo G. Cost utility and budget impact of third-generation aromatase inhibitors for advanced breast cancer: a literature-based model analysis of costs in the Italian National Health Service. Clin Ther 2004;26:1546–61.
[17]Caro JJ, Huybrechts KF, Xenakis JG, et al. Budgetary impact of treating acute bipolar mania in hospitalized patients with quetiapine: an economic analysis of clinical trials. Curr Med Res Opin 2006;22:2233–42. [18]Mar J, Sainz-Ezkerra M, Miranda-Serrano E. Calculation of prevalence
with Markov models: budget impact analysis of thrombolysis for stroke. Med Decis Making 2008;28:481–90.
[19]Purmonen TT, Auvinen PK, Martikainen JA. Budget impact analysis of trastuzumab in early breast cancer: a hospital district perspective. Int J Technol Assess Health Care 2010;26:163–9.
[20]Martin EG, Paltiel AD, Walensky RP, Schackman BR. Expanded HIV screening in the U.S.: what will it cost government discretionary and entitlement programs? A budget impact analysis. Value Health 2010;13:893–902.
[21]Mar J, Arrospide A, Comas M. Budget impact analysis of thrombolysis for stroke in Spain: a discrete event simulation model. Value Health 2010;13:69–76.
[22]Colin X, Lafuma A, Costagliola D, et al. Modelling the budget impact of darunavir in the treatment of highly treatment-experienced, HIV-infected adults in France. Pharmacoeconomics 2010;28(Suppl. 1):183–97. [23]Caro JJ, Briggs AH, Siebert U, et al. Modeling good research
practices—overview: a report of the ISPOR-SMDM Modeling
Good Research Practices Task Force—1. Value Health 2012;15: 796–803.
[24]Briggs AH, Weinstein MC, Fenwick E, et al. Model parameter estimation and uncertainty analysis: a report of the ISPOR-SMDM Modeling Good Research Practices Task Force—6. Value Health 2012;15:835–42. [25]Eddy DM, Hollingworth W, Caro JJ, et al. ISPOR-SMDM Modeling Good
Research Practice Task Force. Model transparency and validation: a report of the ISPOR-SMDM Modeling Good Research Practices Task Force—7. Value Health 2012;15:843–50.
[26]Arlandis S, Castro D, Errando C, et al. Cost-effectiveness of sacral neuromodulation compared to botulinum neurotoxin or continued medical management in refractory overactive bladder. Value Health 2011;14:219–28.
[27]Chiao E, Meyer K. Cost effectiveness and budget impact of natalizumab in patients with relapsing multiple sclerosis. Curr Med Res Opin 2009;25:1445–54.
[28]Husereau D, Drummond M, Petrou S, et al. Consolidated Health Economic Evaluation Reporting Standards (CHEERS)—explanation and elaboration: a report of the ISPOR Health Economic Evaluation Publication Guidelines Good Reporting Practices Task Force. Value Health 2013;16:231–50.