Available online at
www.sciencedirect.com
ScienceDirect
journal homepage:www.elsevier.com/locate/jides
An enhanced Graph Analytics Platform (GAP)
providing insight in Big Network Data
Anastasios Drosou
a,
∗
, Ilias Kalamaras
b
, Stavros Papadopoulos
b
,
Dimitrios Tzovaras
a
aCentre for Research & Technology Hellas - Information Technologies Institute, Greece
bImperial College London - Department of Electrical and Electronic Engineering, United Kingdom
H I G H L I G H T S
• The paper presents the enhanced Graph Analytics Platform (GAP).
• GAP allows for data mining promoting a top-down approach for Big Data investigation. • GAP supports a wide range of key-features, incl. clutter minimization, HR clustering. • GAP is demonstrated on both a mobile and a social network real-world use case.
A R T I C L E I N F O
Article history:
Published online 15 November 2016 Keywords: Graph analytics Network graph Big data Behavioural clustering Information visualization Hypothesis formulation A B S T R A C T
Being a widely adapted and acknowledged practice for the representation of inter- and intra-dependent information streams, network graphs are nowadays growing vast in both size and complexity, due to the rapid expansion of sources, types, and amounts of produced data. In this context, the efficient processing of the big amounts of information, also known as Big Data forms a major challenge for both the research community and a wide variety of industrial sectors, involving security, health and financial applications. Serving these emerging needs, the current paper presents a Graph Analytics based Platform (GAP) that implements a top-down approach for the facilitation of Data Mining processes through the incorporation of state-of-the-art techniques, like behavioural clustering, interactive visualizations, multi-objective optimization, etc. The applicability of this platform is validated on 2 istinct real-world use cases, which can be considered as characteristic examples of modern Big Data problems, due to the vast amount of information they deal with. In particular, (i) the root cause analysis of a Denial of Service attack in the network of a mobile operator and (ii) the early detection of an emerging event or a hot topic in social media communities. In order to address the large volume of the data, the proposed application starts with an aggregated overview of the whole network and allows the operator to gradually focus on smaller sets of data, using different levels of abstraction. The proposed platform offers differentiation between different user behaviors that enable the analyst to obtain insight on the network’s operation and to extract the meaningful information in an effortless manner. Dynamic hypothesis formulation techniques exploited
Peer review under responsibility of Qassim University. ∗Corresponding author.
E-mail address:[email protected](A. Drosou). http://dx.doi.org/10.1016/j.jides.2016.10.005
2352-6645/ c⃝2016 Qassim University. Production and Hosting by Elsevier B.V. This is an open access article under the CC BY-NC-ND license (http://creativecommons.org/licenses/by-nc-nd/4.0/).
by graph traversing and pattern mining, enable the analyst to set concrete network-related hypotheses, and validate or reject them accordingly.
c
⃝2016 Qassim University. Production and Hosting by Elsevier B.V. This is an open access article under the CC BY-NC-ND license
(http://creativecommons.org/licenses/by-nc-nd/4.0/).
1.
Introduction
Graphs are widely used structures that serve to represent networks consisting nodes and their inter-connections called edges. They could be exploited to describe paths in a city, circuit networks like telephone and computer ones or even social networks, whereby each node is a structure and contains information like person id, name, gender, locale, etc. It becomes apparent thus, that data used in a wide range of applications can be intuitively formulated into a graph, providing a holistic view of the correlations that an entity participates and extending to both visualization and analytics fields [1]. In this respect, the termGraph Analytics was introduced and refers exactly to the study and analysis of data that can be transformed into such graph representation. Graph analytics is a fast growing field in both the big data mining and the visualization community [2] that is utilized on numerous multi-disciplinary and high-impact applications, such as network security, finance, health care, etc. [3] providing users with adequate knowledge across various patterns within a given system. Despite the fact that the analysis of unstructured collections of multi-dimensional points has already been addressed in the past by several methods, graph analytic technologies form a rather recent trend and they pose many challenges concerning not only the performance of the data mining algorithms that promotes knowledge discovery through algorithmic computation, but also producing effective graph visualizations in order to enhance human perception.
The twofold nature of graph analytics can be described by the following uses-cases:
• The task of graph analytics is known beforehand. Graph mining utilizes the vast computational resources that exist today, in order to analyze large graphs fast and efficiently. Specific tasks for which graph mining has been used, include the detection of anomalous nodes or subgraphs, community detection, and object recognition.
• The task analysis is not known beforehand. Graph visualization includes the human cognition in the analysis loop, and enables the interactive exploration of graph related datasets. It is used in many cases where the human may simply examine the data to learn more about it, gain insight about it, or make new discoveries.
In the modern digital ecosystem, the need for different advanced graph analytics to make something of that data becomes more than essential as the sources, types, and amounts of data continue to expand [4]. In this respect, the contextual impact of data and the impact of graph analytics technology on organizations seeking to discover the cause, effect, interrelate and influence of events on business
outcomes needs to be defined. This way, graph analytics are not only able of identifying the key individuals in the graph and visualize them, but they also classify (via clustering) them into behavioural groups [5]. Moreover, they can detect correlations and determine their nature and their significance within the given environment.
Thus, graph analytics can be used to model all sorts of relationships and processes in a wide range of systems [6]. For instance, they can reveal patterns across varied data sets that signal the onset of cyber attacks. With a steadily increas-ing amount of user devices, the problem of mobile network security, i.e. monitoring a mobile phone network and iden-tifying abnormal and malicious behavior, is nowadays be-coming even more challenging. The number of connected mobile devices is expected to increase even more in the next years, including diverse types of data, such as those origi-nating from Internet of Things (IoT) devices. The vast num-ber of mobile phone subscrinum-bers, communicating every day, results in a huge amount of signaling and billing records, taining multiple and diverse types of information. This con-stant flow of information from multiple sources renders the problem of mobile network security as aBig Dataproblem [7], posing the challenge of how to reduce the amount of infor-mation and focus on the useful aspects. For instance, mali-cious individuals may be tempted to launch Denial of Service (DoS) attacks and affect network security and performance. Since the efficient detection and attribution of these anoma-lies are of major importance to the mobile network operators, graph analytics techniques can significantly assist in this di-rection. They can assist the mobile network operator to have an overview of various aspects of the whole network, while allowing her/him to explore and focus on gradually smaller subsets of the data, until the desired information is reached and a decision is made.
In the same context, graph techniques could also identify the root (cause) of surrounding or bigger events, i.e. this could help in finding the most influencing people in social media. Alternatively, graph analytics could help in the identification of communities that revolve around a certain theme, i.e. detect patterns in communication that might indicate a threat to national defense by identifying groups of people who have been communicating about terroristic events, something security agencies and/or authorities might be interested in.
Building upon all aforementioned issues, this paper presents a Graph Analytics Platform (GAP) that offers a rich toolkit for and is built upon the concept of an interactive data mining framework [8] that follows a top-down approach, aim-ing at the detection and attribution of abnormal/suspicious events or patterns in a wide range of network structures. Last but not least, its value and applicability is demonstrated in two different real world reference use-cases.
The rest of the paper is organized as follows: the literature review related to the applications targeted within this work is presented in Section 2 while the a brief description of the conceptual architectures used in Big Data infrastructures is provided in Section 3. In this respect, the conceptual architecture and the basic structural components of the GAP platform are briefly presented and cited in Section3.2, while a more detailed description of them follows in Section 4, respectively. Finally, the exploitation of the proposed platform on two real-world applications and the corresponding scenarios are provided in Sections5.2and5.1. Last but not least, the corresponding outcomes and results are discussed in Section5.3, while the paper concludes with Section6.
2.
Related work
As imposed above, the proposed GAP will be demonstrated on two scenarios involving (i) mobile network security against a Denial of Service attack (DOS) and (ii)social media based early detection of emerging events. Thus, the current Section will elaborate on the a brief presentation of the latest and most significant works in these two fields without being limited to but with special focus on the graph based and graph analytics technologies.
2.1. Mobile communication networks
The mobile network is comprised of millions of components and mobile devices, which exchange information at a large rate. The data collected from mobile networks are comprised of two types of information: (i) the signaling activity, and (ii) the billing related activity, mainly captured within the Call Detail Records (CDRs). The signaling activity occurs on the control plane, and represents all the packets/signals exchanged in order to (de-)activate network services and establish connections. The CDR data occur in the data plane, and contain information such as source, destination, time, duration, call type (e.g. voice, SMS, MMS etc.) [9]. These two types of information can be collected for each mobile subscriber over extended periods of time and are essential for the detection of anomalies in the network traffic, without exploiting the privacy sensitive communication content. The approaches used for anomaly detection via exploitation of the aforementioned types of information are discussed hereafter. With respect to the signaling data, most of the promoted anomaly detection approaches utilize it in an aggregated format. In particular, similarly to the current paper, each signalling message is daggered over specific time periods, where the value in each time period represents the number of signals sent to the network. Using this type of information, Lee et al. [10,11] utilized variations of the Cumulative Sum (CUSUM) method for the identification of attacks undetectable by the traditional systems. This method is designed in such a way that it is difficult for the attackers to evade detection and its evaluation was performed on a modern DoS attack that affects both the RNC and the Node-Bs of 3G and WiMax networks. Alternatively, Alconzo et al. proposed a set of statistical techniques for time-series of unidirectional feature distributions [12], while Coluccia
et al. extended the work of [12] with two distribution-based anomaly detection and provided enhancements [13].
With respect to the CDR data, Yan et al. [14] introduced the SMS-Watchdog, a scheme that utilizes SMS for anomaly detection. Multiple information theoretic anomaly metrics have been used, in order to identify large deviations from the normal past behaviors. Kim et al. [15] utilized multiple statistical metrics for the identification of the mobile devices participating in an SMS-flooding attack, and overperformed the SMS-Watchdog. Murynets et al. [16] proposed a couple of algorithms for the identification of anomalous SMS activities on mobile networks at different levels of abstraction, based on the aggregation and the clustering on the level of individual device.
Complementarily to the aforementioned analytical meth-ods for anomaly detection, visualization-based methmeth-ods have also been proposed in the literature. Eagle et al. [17] utilized entropy measures to characterize the CDR activity of each user and utilized 2-dimensional plots to represent the change of entropy over time. Ye et al. [18] proposed a graph-based ap-proach, for the visualization of CDR data, wherby vertices of the graph represent users and the edges call communication events. In the same context, Shen et al. [19] proposed Mo-bivis, an alternative graph-based visualization approach for the analysis of CDR data, where the vertices of the graph rep-resent ontologies (e.g. users, locations, etc.), while the edges time dependent connections between ontologies. They also utilized circular histograms and 2-dimensional histograms for visualizing the activity of each user/group over time.
Finally, there is also a wide variety of commercial toolkits that offer visual analytics solutions and can be exploited by mobile network providers. For instance, SAS Visual Analytics (VA) [20] and Tableau [21] are widely-used visual analytics applications that visualize any kind of multi-dimensional data, using a variety of visualization techniques. However, due to their generic nature, they do not exclusively target mobile network data, losing, thus, much of their effectiveness in related scenarios. On the contrary, the VA application of Certifuge Systems, [22], is adjusted IP network data.
Yet, there exist a few solutions that mainly target mobile network security and include anomaly detection capabilities, without supporting visualizations, though. Motive security guardian [23] was proposed by Alcatel for monitoring and analysis of signaling-related data. This method can help network providers to pinpoint malware infections to the operator in real time and thus, to minimize the impact on the network and their subscribers. Similarly, Nokia released the NSN Mobile Guard [24] which is a complete solution of network security. It provides anomaly detection methods that utilize signaling data, as well as an antivirus suite installed on mobile devices and protects subscribers against fraud. NSN mobile guard allows the network operators to see the security status of the devices on the network, while also enables them to provide proactive support for infected subscribers. 2.2. Social networks
Social media networks are essentially graphs consisting of nodes, usually representing the users, and edges connecting the nodes to each other. Studies have demonstrated [25] that
the structure of social networks differs from that of other types of graph networks, such as the Web. A common pattern appearing in social networks is dense areas of many nodes surrounding a few core nodes. As a particular example of a popular social network, Twitter, with its graph of followers, has been identified as a hybrid between an information network, where information is rapidly transmitted among the users, and a social network, where social relationships of the users are embedded in the relationship among followers [26]. Such differences in structure compared to other types of networks can be exploited in order to design more efficient algorithms to be used for social network analysis. However, it can be also exploited by malicious actors, to more easily spread spam and viruses [25].
The graph structure of social networks has been exploited in order to identify groups of nodes, most commonly users, sharing common characteristics. For this purpose, based analysis methods have been used, as with any graph-structured set of data. In [27], a survey of graph pattern matching techniques employed for the analysis of social net-works is provided. Graph matching is used in social netnet-works in order to identify common patterns and compare nodes, with respect to the structure of their close neighborhood. The similarities discovered between nodes can be used to split the nodes into groups of common social behaviour. However, as stressed out in [27], graph matching in social networks differs from other application areas, both in that quality improve-ments are needed and due to the large size of social networks, which needs to be considered. Although most graph match-ing techniques utilize mostly the existence of links between the nodes, other information can also be used for more in-formative analysis. In [28], the actual content transferred be-tween users is associated with the edges and used in order to provide accurate detection of user communities. Regarding the detection of malicious activities, more recent methods, such as [29], go a step further and consider higher-level in-formation, exploiting the fact that messages containing mali-cious URLs tend to be repetitive with respect to their redirects. URL redirect chains are extracted from the twitter messages and are used to compute correlations among them in order to classify the URLs appearing in the messages as suspicious or non-suspicious.
The wide distribution of users using social media around the world and the constant production of new messages and communications, allows for the exploitation of social net-works in order to build powerful real-time event detection methods. Clustering methods have been used in order to clus-ter streams of messages into event-related topics, as in [30]. In [31], techniques based on the frequency of the topics in the incoming messages are used to decompose the streams into seasonal and trend components, in order to discover unusual events as abnormalities. An interesting approach is presented in [32], used in an earthquake announcement ap-plication. Each user is considered as a sensor which senses events, with several kinds of information being extracted from twitter messages, such as textual content and geoloca-tion. The multiple “sensors” are fed into a particle filter, in order to locate the center of the earthquake accurately and relatively fast. A recent method for event detection is
pro-posed in [33], where twitter messages are clustered into top-ics using common textual similarity measures, such as cosine similarity. The hotspot events are distinguished from com-mon communication topics acom-mong the users by utilizing lo-cation information extracted from the textual content of the message clusters.
In the attempt to extract meaningful information and patterns from the vast size of social networks, visualization and visual analytics methods can be of great assistance. Visual analytics methods have been used both to visualize characteristics of single messages or users, and to visualize characteristics of the whole network or large parts of it. In [34], the time series of the frequencies of word appearances in twitter messages have been visualized, in order to visually explore relations between messages and topics. On the other hand, in [35], snapshots of whole large networks are visualized as points, in order to visually separate clusters of network states sharing common characteristics. The position of the points on the new space is used to identify stable states, detect outliers and have an overview of the network evolution. Although the majority of visual analytics methods consider a single type of connection between the nodes of the network graph, utilizing combinations of multiple types of connections, so-called modes or modalities, has also been successful. The visualization tool presented in [36] visualizes social networks considering multiple types of relationships between the nodes, making use of both graph-based compound visualizations and multimodal connections in a parallel-coordinate visualization fashion.
2.3. Motivation & contribution
As already stated, a large number of diverse tasks in Graph Mining can be identified[3], including detection of abnormal subgraphs/edges/nodes, community detection (graph clustering/partitioning) [37], network analysis, image segmentation [38], etc. However, irrespectively of the exact application Graph Mining technologies may be exploited on, in most of the cases they are confronted with similar challenges, that deal with the efficient capturing of the behavioral patterns of each node or subgraph. In particular some indicative major challenges towards this direction are listed below:
• Generic (size- & type-invariant) applicability • Formulation of a meaningful Graph Equivalent • Definition of the descriptive Graph Features • Informative rich levels of Abstraction • Dynamic Response
• Accurate & high resolutional Clustering
• Incorporation of Human Intelligence through highly interactive Interfaces
• Minimization (visual) Clutter • Data insight provision.
Although quite a plenty of state-of-the art works have been presented in the literature review (see Sections 2.1 and2.2), they all approached the multi-dimensional problem of the graph mining from a rather limited perspective, in the sense that they succeed in addressing only one or just a few of the aforementioned challenges. On the
contrary, the proposed Graph Analytics Platform (GAP), which forms an extended version of the Mobile network Visual Analytics (MoVA1) platform [40], offers a holistic approach to a wide range of data mining problems and real world application by efficiently combining state-of-the-art technologies addressing modern big data challenges.
The importance for graph mining algorithms to be fast and capable of the efficient processing large graphs must also be stressed out. In order to meet this last requirement, the enhanced GAP proposed herein, promotes a hierarchial approach that follows a gradual top-down decoding decoding of the initially vast information of vast network graphs, whereby pattern recognition and analytical methods meet graph and visual analytics techniques. This way the network operator is equipped with a valuable toolkit to have an overview of the network, to view similarities in the behavior of the network nodes (e.g. users, etc.) and to formulate and validate various hypotheses regarding the ongoing edge’s interactions (e.g. communication patterns). To accomplish these tasks, the tools utilize graph-based visualization techniques as well as anomaly detection algorithms, based on the retrieved data of the network.
3.
Big data architectures
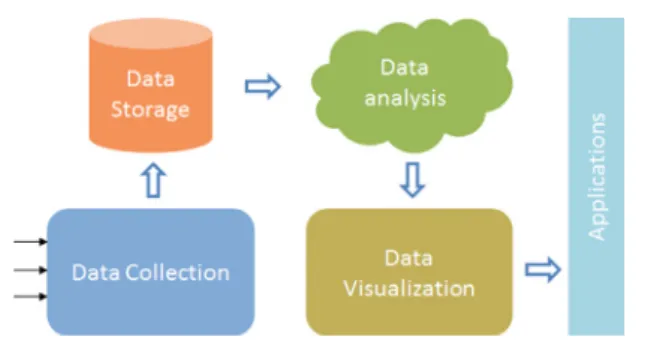
3.1. Big Data InfrastructureBig Data Infrastructures require proper preparation, due to their nature. In this respect, it has been identified that the following key infrastructure elements are essential for modern Big Data infrastructures, as is also illustrated inFig. 1:
• Data Collectionmodule which may refer to a wide variety of data, ranging from a customer database and social media channels to email archives and data from monitoring operations. The corresponding infrastructure may require sensors, applications which generate user data, CCTV video, beacons, social media profiles, etc.
• Data Storagemodule refers to where data gathered from
the sources are kept. This is usually facilitate through traditional data warehouses, data lakes, distributed or cloud-based storage system and servers or even simple hard disks.
• Data Analysismodule, which is nowadays facilitated more
efficient through a Cloud infrastructures [41] rather than data warehouses, software, analytics staff, etc. Usually a three steps process is followed hereby: (i) data preparation (data identification, cleaning and formatting); (ii) the analytic model and (iii) conclusion drawing from the insights.
• Output & Data Visualizationmodule refers to the way the aforementioned insights are communicated on to the peo-ple who need them (e.g. the decision makers, opera-tors, etc.). Key data output options include management dashboards, commercial data visualization platforms that 1The application has been developed for the purposes of the NEMESYS project [39], and is designed with a focus to detecting anomalies in the mobile traffic, e.g. DoS attacks.
Fig. 1 – A high level illustration of a basic Big Data Infrastructure.
make the data attractive and easy to understand, and sim-ple graphics (like charts and graphs) that communicate in-sights.
In this respect, the proposed GA Platform aims to focus on the Data Analysis and the Data Visualization of a wide range of collected and appropriately stored data, as it is explained in the following sections.
3.2. Conceptual overview of the enhanced GAP
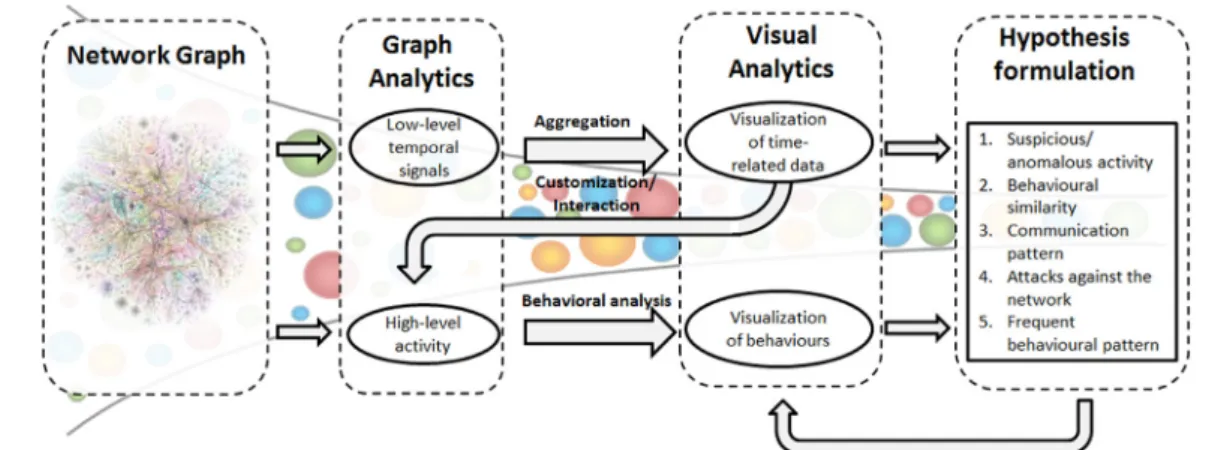
As mentioned above, the enhanced version of Graph Analytics Platform proposed herein, is built upon a top-down data mining concept that highly promotes the active involvement of the network analyst or operator. In a more generalized manner than the initial MoVA platform [40], the analysis concept followed herein the begins with an overview of the whole mobile network and provides different levels of abstraction, allowing the operator to gradually focus on smaller sets of data, which can be further explored and allow the highly targetted investigation and/or the detection and attribution of anomalies. A schematic representations of the proposed data pipeline is presented inFig. 2.
All streamed/recorded data are collected from the network under investigation. The ‘control-plane’2 related traffic data can initially be visualized in an aggregated manner, which significantly helps the analyst to spot the time-instances or time-periods where uncommon amounts of traffic have occurred and trigger them to investigate it deeper. More detailed communication information, like data describing inter-node specific communications,3 duration, type of communication, etc. can then be used to extract multiple behavioral characteristics, extract and visualize their similarities. Last but not least, a network analyst can dynamically formulate several hypotheses, and validate or reject them using the results of the analysis and the 2‘Control Plane’ data is a term mostly met in mobile networks. However, for the rest of this paper it will be used also to describe aggregated data showing the amount of of messages exchanged per type of traffic data, e.g. the amount of SMS exchanged within a specific region of the network, or the amount of Tweets posted from specific set of user, etc.
3For the rest of this paper the term ‘communications-specific’ will be used to describe the data that contain information about any node that participates in the graph. Call Detail Records (CDRs) in mobile networks are an very indicative example of such data.
Fig. 2 – The proposed data pipeline followed for the analysis of the Big Data that can be collected from network structures. The cone in the background serves to provide a notion of the gradual reduction of the data being explored, following the promoted top-down approach.
visualization methods. An illustration of the operational concept with the human in the loop can be found inFig. 3.
As already mentioned, most of the previous approaches and solutions about the analysis of data collected in mobile or social network are addressing the problem rather partially and hardly manage to address the Big Data mining problem in such an adequate depth, so as to help the analyst to come to valuable conclusions and perform if applicable root cause analysis of the ongoing events. In the same respect, the majority of the aforementioned approaches focus either on ’control-plane’ or communication-specific data, while none of these approaches combines visualization, abnormality detection and deep mining technologies into a common framework. The in here proposed GAP platform aims at overcoming these limitations and to facilitate the work of modern data analysts by delivering a generic-purpose data mining tool.
4.
GAP’s toolkit
In the current section, each of the basic structural elements (i.e. self-contained modules) of the enhanced GAP are briefly presented, so as to provide the reader with a more detailed view of the platform’s capabilities.
4.1. Visualization of the low level activity in graph The visual analytics methods presented in this section deal with thevisualization of the ‘control-plane’ activity. These methods provide an overview of the current and past network status to the analyst, and enable the selection of appropriate subsets of data which will be analyzed in depth with the rest of the methods integrated in the system.
Although being aggregated and thus smaller in size, ‘control-plane’ related data can still be Big Data, collected from millions of sources (e.g. mobile devices) over extended periods of time. Additionally, the aggregation often produces multiple time series, one for each type of signal in the network, while each entry of the time series represents the total amount of signals sent for the specific time period. This
is represented as a matrixS = {sij|i ∈ 1. . .K, j ∈ 1. . .N}, whereN is the total number of time periods,Kis the total number of signals’ categories in the network, andsijis the
total number of signals belonging to theithcategory, and sent
to the network at thejthtime period.
Thereafter, anomaly detection methods are applied on matrix S, in order to provide an overview of the anomaly status over the different time periods. Specifically, the Local Outlier Factor (LOF) [42] is utilized on the multidimensional space defined byS, in which the position of each point are defined assj= [s1j,s2j, . . . ,sKj]. The result of the LOF analysis is an anomaly score for each time periodj ∈ {1,2, . . . ,N}. Alternatively to the LOF algorithm the Bayesian Robust PCA approach [43] can also be used.
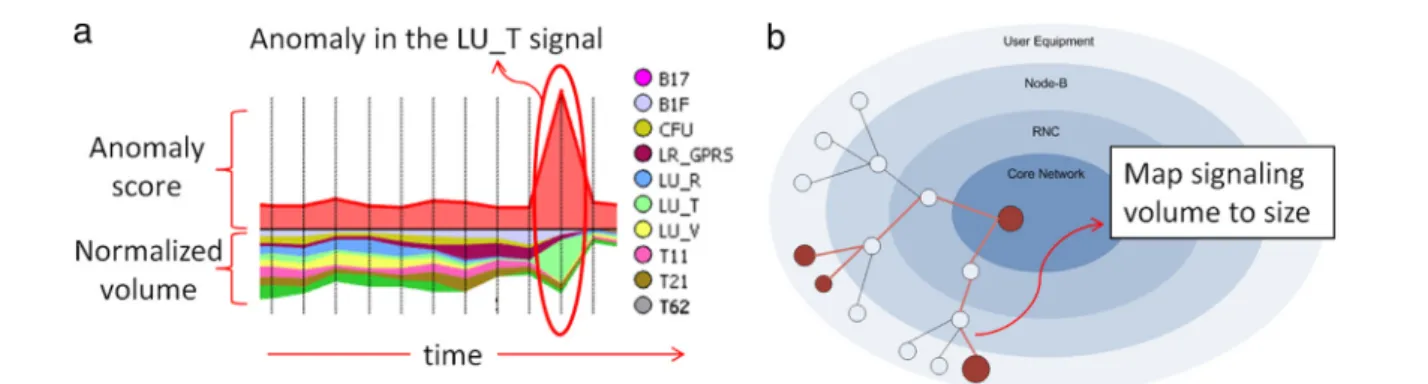
For instance,Fig. 4(a) illustrates the visualization method that is utilized for presenting the aggregated signaling activity of a subset of users in a mobile network. This subset represents the topkmobile devices with the highest activity. The specific time period is selected using the stacked graphs representation shown in Fig. 4(a). The signaling activity represented by matrixS, and the LOF scores are subsequently visualized using stacked graph representations, as shown
in Fig. 4(a). The lower part of this figure visualizes the
normalized volume of the signaling activity for each signal, over the different time periods. The upper part shows the LOF scores for each time period. In this certain example a detected anomaly is illustrated inFig. 4(a) and regards a sudden increase of the Location Update Total (LU_T) signal.
In the same context, Fig. 4(b), the components of the network and the mobile devices connected to them are positioned in different layers, namely, (1) UE (User Equipment): the actual mobile devices, (2) NodeB: the NodeBs that provides the mobile devices with wireless connectivity, (3) RNC: the Radio Network Controllers (RNCs) which are responsible for controlling the NodeBs that are connected to them, and (4) Core Network: the components of the core network. The visualization of Fig. 4(b) shows the distribution of the signaling messages to the different network components. This allows the mobile network operator to identify the most active users, as well as their activity distribution to the network. More details on the
Fig. 3 – Overview of the proposed visual analytics tools integrated in GAP. An overview of the network is provided to the analyst by visualizing aggregated ‘control-plane’ related signals. Reducing the abstraction level, CDR data of specific users are used to visualize their behavioral similarities. Finally, the analyst can formulate and test specific security-related hypotheses.
Fig. 4 – Visualization of the signaling activity in the network. (a) Stacked graphs visualization of the anomaly scores and signaling volume. (b) A scheme of the proposed layered layout of the Mobile Network Graph.
method presented in this section for the visualization of the signaling activity in the network can be found in [44].
More details including the performance evaluation of the current method can be found in [43].
4.2. k-partite based framework for behavioural analysis Once the specific suspicious/anomalous period of the networks timeline has been identified, a further stage of analysis, concerns the behavior analysis engines. Within GAP two alternative but complementary algorithms have been integrated and serve this scope, i.e. the visual clustering in groups of users with common behavior, utilizing multiple channels of ‘communication specific’ information.4 4During an inter-node communication activity in mobile networks (e.g. phone usage, SMS exchange, etc.), multiple and diverse types of information are stored, such as the time of a call, the identity of the user starting the call and the recipient etc. Similarly, within a social network each user emits a wide variety of information per post, including IP, time, username, as well as textual information that can be extracted from the message itself (e.g. main entity referred in the text). Each of these attributes can be used to extract behavioral descriptors for the users, encoding certain characteristics of their behavior.
Clustering, which is a significant step towards analyzing the data in an exploratory way and also facilitates the root cause analysis5 in network phenomena, allows for the grouping of individual events or entities according to their behavioral patterns, and provides a method to find similarities, and detect anomalies as distinct clusters.
Especially in the case of network analysis, where there is little or no information on ground truth, the analyst must make no assumptions about the data before hand. It is under these restrictions that a clustering methodology is particularly appropriate for the exploration of inter-relationships among the communication records to make an assessment of their underlying structure. Herein ak-partite based approach, that is briefly presented within this section and one based on multi-objective optimization of multiple channels of ‘communication specific’ information.
Ak-partite graph is a graph where the set of nodesVcan be divided inkdisjoint groupsV=(V0, . . . ,Vk−1), such that no
5An important role of the root cause analysis for network security is to enable the analysts to systematically discover, extract and combine patterns from a multi-dimensional security dataset, according to a set of relevant features and with limited knowledge on the phenomena being studied.
edge connects the vertices in the same group. More formally, a k-partite graph G is defined as: G = ⟨V0∪ · · · ∪Vk−1,E⟩,
whereVl = {ni|1 ≤ i ≤ Nl},∀l ∈ [0,k−1], and E ⊂ k−1
l=1
V0×Vl
.
As mentioned earlier, the k-partite graph approach can be utilized for the visualization on any nominal multi-dimensional dataset.This information is mapped onto the graph in the following way: Nodes inV0correspond to inter-node communications, while inter-nodes in Vl̸=0 correspond to
feature values for each communication. Therefore, ak-partite graph shows the connections of call events to feature values of k−1 different inter-node communications. Afterwards, the constructed graph, which now reflects the structure of the dataset, is positioned on the 2-dimensional space and visualized utilizing a force-directed algorithm [45] in an aesthetically pleasing way. This way the high-dimensional data set can be visualized, in a way that the grouping properties of the input space are preserved which allows the analyst to conclude that two nearby vertices have highly similar feature vectors, whereas two distant points should have nothing in common. This results in an enhanced perceptual anticipation of groups in both the call events and their different attributes. It should be underlined that changing the features of thek-partite graph, will also affect the resulted layout, and as a result the perceptual anticipation of groups.
By omitting the interfering nodes V0 and by directly
combining theVl̸=0features, we can gradually form different
levels of abstraction of the initial graph. Specifically, by setting Ga(Va,Ea)for the abstract graph of the initialk-partite graph G({V0V1· · ·Vk−1},E), the set of nodes of the abstract
graph is defined as Va = V1V2· · ·Vk−1, and the set of
edges is defined asEa= {{ni,nj}|∀{ni,nk} ∈E and{nj,nk} ∈E}. Abstract graphs may contain less information but perform significant dimensionality and visual clutter reduction and are often more useful to the analyst in order for them to have a better perception of the network’s activities.
More details including the performance evaluation of the current method can be found in [46].
4.3. Multi-objective framework for behavioural analysis As also stated in the previous section, the multi-objective ap-proach [47] forms another proven technique for behavioural analysis. In particular, herein the descriptors are extracted by considering each attribute separately and constructing his-tograms of their values for each node (e.g. user, tweet, etc.), for the time period in consideration. These histograms are indicators of the behaviors of users so that a user with nor-mal behavior has a histogram with a much different form than a user with abnormal behavior. The multiple descrip-tors extracted from a user can be used to visualize the simi-larities between users, with respect to the multiple recorded attributes. Although each descriptor could be used separately to visualize a specific behavioral aspect, considering all de-scriptors simultaneously allows the operator to view multiple aspects at once, and to have a more complete insight into the data, such that could not be gained by using each de-scriptor separately. For the purposes of the mobile network
behavior visualization, the multi-objective visualization of [48] has been used. Each descriptor is used to calculate unimodal distances between users. Subsequently, a distance graph is formed, where each user is considered as a vertex and there are edges between each pair of users, weighted by the distance between them. The Minimum Spanning Tree of the graph is extracted and is used to define a force-directed-based objective function [47]. The minimization of this objective leads to a placement of the vertices on the two-dimensional plane, such that the connected vertices are kept close to each other.
Although large graph analysis is generally a computa-tionally expensive task, the proposed approach deals with it effectively, in two ways: First, the overall top-down architec-ture of the approach is meant to use less complex methods, such as the stacked plots and the Mobile Network Graph on large amounts of data, and then to focus on smaller datasets, so that the more complex multi-objective method is run with few computational resources required. Second, by using the Minimum Spanning Tree, instead of the full graph or a neighborhood graph, only a few number of edges are kept, specifically equal to the number of vertices minus one. The few number of edges renders the minimization of the force-directed potential function computationally efficient.
Since there are multiple descriptors extracted from the users, multiple notions of distance are considered and multiple objective functions are defined. The simultaneous minimization of all the objective functions is normally infeasible; however, such problems are solved by multi-objective optimization methods, which result in a set of solutions, instead of one. The set of solutions, namely the Pareto set, contains those solutions which cannot be further improved without sacrificing one of the objectives. These solutions represent different optimal trade-offs among the multiple objectives and can provide insight into various aspects of the mobile network data and the user behaviors. More details including the performance evaluation of the current method can be found in [47].
4.4. Hypothesis formulation and validation
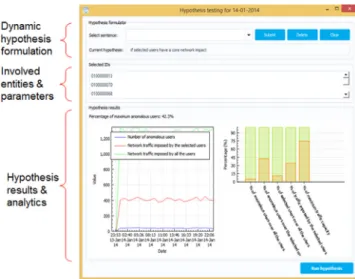
Following the above clustering approaches, the analyst is further limiting their analysis towards more depth and less data, as also suggested by the promoted top-down approach. At this point GAP allows the operator todynamically formulate
and validate network related hypotheses for the remaining
dataset as shown in the upper part of Fig. 6. This can be performed by interactively selecting a subset of the available nodes on the graph.
A more detailed example of the hypothesis formulation process is illustrated in Fig. 6, whereby the hypothesis regarding the anomaly state of a selected users group is formulated in two steps.
According to the nature/type of hypothesis submitted, an appropriate algorithm is employed transparently from the analyst in order to provide answers or, as shown in the lower part ofFig. 5.
Such algorithms are indicatively listed below but limited to these:
Fig. 5 – The Graphical User Interface of the dynamic hypothesis generator: The operator is given the opportunity to formulate their hypothesis query by selecting among a set of predefined sequential key-phrases. The ID numbers of the inspected users is listed in the middle section of the window. In the bottom of the image, some analytics regarding the behaviour of the users over time along with the impact on the core network are illustrated, as requested by the placed hypothesis.
Fig. 6 – The hypothesis are formulated by smaller phrasal parts, according to a predefined look-up table, allowing thus a large set of expressions to be structured. Each part of the finally formulated expression is the triggering a certain module or algorithm of the GAP, all of which running sequentially ignite the appropriate process and provide the desired outcomes.
• a state-of-the-art graph based anomaly detection algo-rithm for both small and large scale anomaly indica-tion [46]
• a state-of-the-art graph based infection or trend spread out prediction algorithm [46]
• statistics (e.g. histograms, wordclouds, etc.) with respect to the network’s characteristics (e.g. emerging trend de-tection, core network impact, network capacity saturation, etc.) and the involved entities (e.g. users, tweets, etc.) as shown in the bottom ofFig. 7
• a frequent pattern matching algorithm for attack attribu-tion [49] for the identification of past common activity se-quences.
The produced answers, either quantitative or visual, are presented to the analyst. Using this information as a guideline, the analyst can further explore the dataset by either updating the hypothesis or focusing on even more specific aspects of the data, mining thus even further reaching the very bottom of the proposed top-down approach. It should be noted that the whole application supports the usage of both stored historical network data, in an off-line manner, as well as streaming data, arriving at each time instance, in real time, in an on-line manner. Last but not least, it should be noted that the features/criteria for behavioural matching can be dynamically defined and spatiotemporally configured, e.g. by setting different durations of the time
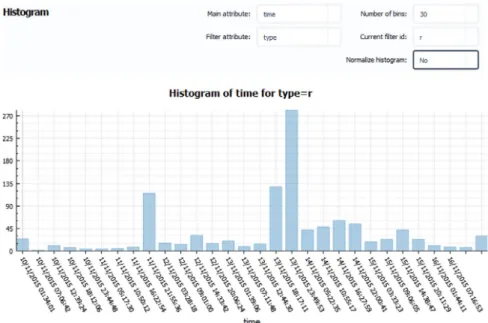
Fig. 7 – The histogram of posted re-tweets over time during the week 10–16 of November 2015.
window of the inspected timeline (see Section4.1). This way, the operator can overview various temporal characteristics of the data and cope with the arriving data velocity.
5.
Experimental results
GAP has been exploited and evaluated in two real world scenarios: a multi-behavioural attack scenario against a mobile network based on a synthetic dataset (see Section5.1) and early diagnosis and social-behavioural analysis scenario regarding a quickly emerging topic in social media as studied on real data collected from Twiter (see Section5.2).
A more detailed description of the datasets collected follows hereafter, while a fruitful discussion about the results and outcomes of the visual analytics tools and methods are provided in Section4.
5.1. GEDIS dataset
For the exploitation of the proposed GA platform with respect to the mobile network related application, CDR data corre-sponding to an extended version of the SMS flood scenario of [15] have been produced. In order to examine scenarios where multiple anomalous behaviors appear simultaneously, a third dataset has been generated with GEDIS studio [50], an online tool for generating Call Detail Record (CDR) data. SMS-related attacks are again considered. The dataset covers a pe-riod of 14 days, some of which are days of attack by malware of various types. There are 3000 users in total, split into the following groups:
• Group 1: 500 normal users, with a small SMS sending rate. • Group 2: 500 normal users, with a large SMS sending rate. • Group 3: 500 infected users, who, in the non-attack days
have the same behavior as Group 1, while at the attacking days they do not exhibit a diurnal cycle.
• Group 4: 500 infected users, who, in the non-attack days have the same behavior as Group 1, while at the attacking days they exhibit a uniform recipient distribution. • Group 5: 500 infected users, who, in the non-attack days
have the same behavior as Group 1, while at the attacking days they exhibit very large SMS sending rate, no diurnal cycle and uniform recipient distribution.
• Group 6: 500 infected users, who, in the non-attack days have the same behavior as Group 2, while at the attacking days they exhibit a high premium SMS sending probability. The four groups of infected users are defined in a way so that different types of malware activity is simulated. In Group 3, the malware acts by sending a low rate of SMSs, but does not discriminate between the hours of day and night. In Group 4, the malware acts by sending a low rate of SMSs, but not discriminating among the user’s contacts, resulting in a uniform distribution of SMSs to the recipients. The users of Group 5 are considered as infected by multiple malware samples, exhibiting all of the above abnormal behaviors, in combination with a high SMS sending rate. Finally, the users of Group 6 are considered as infected by a malware which sends a larger than normal amount of SMSs to premium numbers.
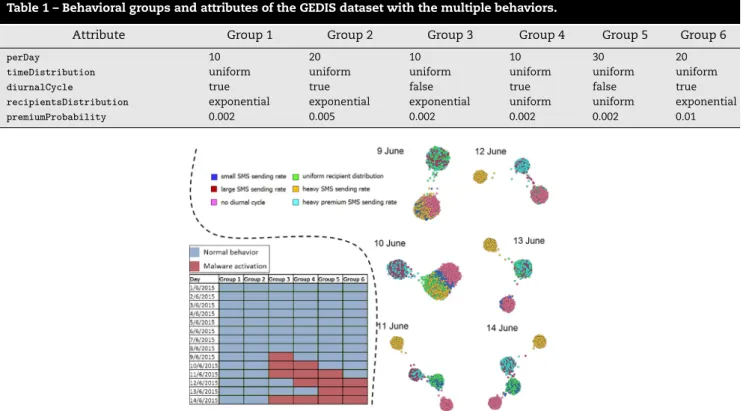
The behavioral attributes of the above groups are presented inTable 1.
The dataset covers a period of 14 days, from 1st to 14th of June, 2015. In the first days, all user groups behave normally. In the second week, at different days, the malwares of different groups of the infected users are activated and trigger an attack.Fig. 8depicts the exact days in which the malware(s) of each group are activated.
5.2. Twitter dataset
Similarly, for the exploitation of the proposed GA platform with respect to the social network related application, a
Table 1 – Behavioral groups and attributes of the GEDIS dataset with the multiple behaviors.
Attribute Group 1 Group 2 Group 3 Group 4 Group 5 Group 6
perDay 10 20 10 10 30 20
timeDistribution uniform uniform uniform uniform uniform uniform
diurnalCycle true true false true false true
recipientsDistribution exponential exponential exponential uniform uniform exponential
premiumProbability 0.002 0.005 0.002 0.002 0.002 0.01
Fig. 8 – Left: The days that the various malwares of the GEDIS multiple behaviour groups dataset are activated. Right: The application and clustering capacity of the multi-objective algorithm per day and per behaviour.
Twitter-based use case has been setup. In particular, a large dataset of Tweets has been collected which fulfilled the following requirements:
• it was posted between the 10th and the 16th of November 2015
• the location it was posted referred to one of the following cities {Amsterdam, Ankara, Athens, Baghdad, Beijing, Berlin, Bogota, Brasilia, Brussels, Budapest, Buenos Aires, Damascus, Dublin, Edinburgh, Hong Kong, Kyiv, London, Madrid, Mexico City, Moscow, New York, Ottawa, Paris, Rome, San Francisco, Singapore, Stockholm, Sydney, Tehran, Tokyo, Toronto, Vienna, Warsaw, Bucharest, Panama City, Zagreb}
• at least one of the above cities was mentioned within its text
• all available metadata were retrieved.
It should be highlighted that the period the collected data referred to was not luckily picked. On the contrary, it was the week that included the day of the unfortunate terroristic attacks against Paris on the 13th of November 2015.
5.3. Results elaboration 5.3.1. Mobile network use case
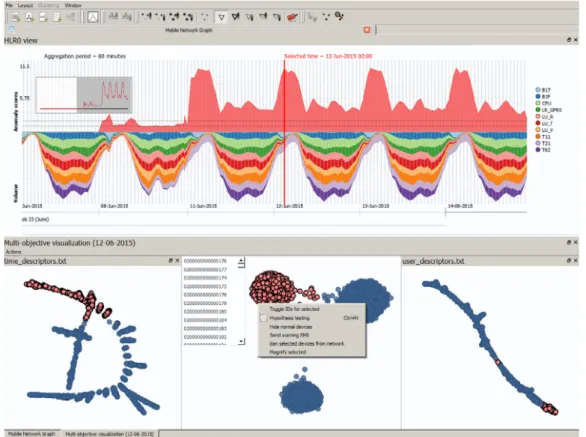
Fig. 9presents the visualization of the signaling activity. As
shown in the stacked graphs representation, the anomaly score on the 12th of June 2015 has suddenly increased by a large factor, when compared to the previous days. Along with this increase, there is also an increase in theT21 signaling message. This signaling message represents the number
of SMS received by the network subscribers. The graph representation of the signaling activity on the 12th of June 2015 for a specific hour is shown on the lower part ofFig. 9. With a more careful look on the graph, the reader can notice that a possible attack attempt is characterized by a uniform geographical distribution of its sources (i.e. malware infected devices). The same outcome can be also be concluded by the uniformity of the signalling activity along the graph.
Selecting the 12th of June 2015 as the time period for more detailed analysis, the analyst filters the CDR records and proceeds with the visualization of the CDR activity, using the multi-objective visualization tool. The THD and RHD descriptors were extracted and used as the multiple modalities.6Fig. 9depicts the results of the visualization. This visualization corresponds to a solution from the center of the Pareto front. Three groups of users appear to be formulating and separate from the each other, indicating that they exhibit different behaviours. The dark red color on the side graphs of
Fig. 9denotes the users selected by the operator for further
analysis.
Next step for the operator is to test various hypotheses re-garding these users. Testing the anomalous users hypothesis is performed by running the anomaly detection method de-scribed in Section4.4. The results of the anomaly detection 6Two types of descriptors are used, namely theTime Histogram Descriptor (THD), which is formed from the hours in a day that a user communicates with other users, and theRecipient Histogram Descriptor (RHD), which is formed from the IDs of the recipients of the user’s communications.
Fig. 9 – The visualization of the signaling activity. The anomaly score on the 12th of June 2015 is increased when compared to the previous normal time instances until the 10th of June 2015. In addition, the volume of the T21 signaling message (i.e. the number of SMS received by the network subscribers) has also increased.(For the reader’s convenience, a HQ version of this image can also be found in the following link:)http://www.iti.gr/~drosou/GraphAnalyticsPlatform/Figure_07%20(HQ).png.
are illustrated in the bottom middle ofFig. 9, where the dark red color denotes the users detected as anomalous. It is ap-parent that most of the selected users of the small cluster are indeed identified as anomalous by the anomaly detec-tion algorithm. The probability that the hypothesis is valid, i.e. that the selected users exhibit anomalous behaviour, is 87.6%.
The core network impact hypothesis can be used by the operator to test if the selected users exhibit a behaviour that has an impact to the core network, rather than to individual users.Fig. 6/left contains the results of testing the network impact hypothesis. From the leftmost figure, it is apparent that the number of anomalous users is maintained throughout the whole day, which is a first indication that the attack aims at the network malfunction. Furthermore, the network traffic of the selected users is above 85% (6th bar in the bottom middle of the figure) of the total traffic of all users, causing a significant negative impact to the core network.
Finally, a botnet attack hypothesis can be run from the same menu. The past few days of CDR activity were utilized for the detection of common behaviours. The Frequent Episode Mining algorithm (FEM) is utilized to identify the multiple activity patterns (i.e. prior visiting of websites) which contained the normal event⟨saf.com⟩. Removal of this event results in one dominant pattern, namely,⟨mal.com,10.10.10.1⟩. This pattern shows that all the anomalous users visited the webpage mal.com, from which they were infected by the
botnet7[51]. Afterwards, the botnet communicated with the specific IP address10.10.10.1for the command and control interface.
Finally, compared to methods that only utilize anomaly detection algorithms, the use of visual analytics, in the proposed application, has the advantage of data exploration. Visual analytics, by definition, involve the human operator in the visualization process, by allowing him/her to select data subsets, fine-tune parameters, compare different visualizations, etc. Combining the fast analytic processes of the automatic anomaly detection and analysis tools with the human perception, through visualization and interaction, leads to an effective means to explore the available data, to allow the operator to view different aspects of them and, ultimately, to gain more insight and arrive at a more accurate decision. Applications such as Motive Security Guardian [23] and NSN Mobile Guard [24], although able to detect malware activity, do not provide the mobile network operator with visualizations that would allow them to instantly view the infected users, the origins of an attack, etc.
5.3.2. Twitter network use case
The analysis that is illustrated inFig. 10concerns the Twitter related dataset as it was collected the days before and 7‘mal.com’ stands for a malware infecting website, while ‘saf.com’ corresponds to a safe website.
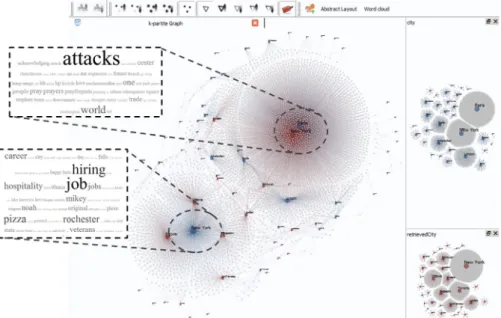
Fig. 10 – k-partite Graph visualization of all the tweets (i.e. nodes) that were posted between the 10th and the 16th of November 2015. The utilized features were the name of the city the tweet retrieved from and the name of the city contained within its text.
after the terroristic attack in Paris on the 13th of November 2015. Initially, the operator can notice on the histogram in right side ofFig. 7, an outburst of the amount of retweeted Teets on the beginning of that exact date, which ignites his curiosity for further investigation. By formulating the graph
in Fig. 10, the analyst is able to notice the following: On
the right side of the image two uni-partite graphs can be seen, each one illustrating the nodes around the city they have been sent from and about the city they have been talking about, respectively. The large network graph in the middle ofFig. 10has been the results of the aforementioned uni-partite graphs in a largek-partite one. Due to the force directed algorithm the visualization obtained clusters closely the cities between which a large amount of information is exchanges. For instance on can notice that there are a lot of tweets from New York about Paris and also quite a few from Ottawa, Toronto & Singapore talking about New York. By selecting the corresponding nodes (i.e. tweets) around the aforementioned pairs and by producing the wordclouds from them, the analyst can quickly get a first notion of what the emerging trends in these regions are.
As the reader can notice in Fig. 10, the most frequent word found in the tweet and re-tweeted messages is the word ‘attacks’, which directly links to the terroristic attack that occurred on that day. Similarly, the tweets about New York mainly concern the spreading out of some new vacancies and ‘job’/‘hiring’ opportunities in the area and this can also be justified by the fact that the discussion is being held within the neighbouring cities.
5.4. Performance issues
In order to provide a self-contained analysis of the proposed platform, some indicative results related to performance
issues of the two core algorithms are reported hereby. In particular, it should be noted that:
• Parallel programming (threads) is used for the force-directed layout of the visualization methods.
• Fast Multipole Multilevel Method (FM3), with O(N)log(N)
performance
• The error of the force approximation is low, i.e.
Error= N i=1 Freal i −Fapproximated i 2 N i=1 Freal i 2 <10−2 (1)
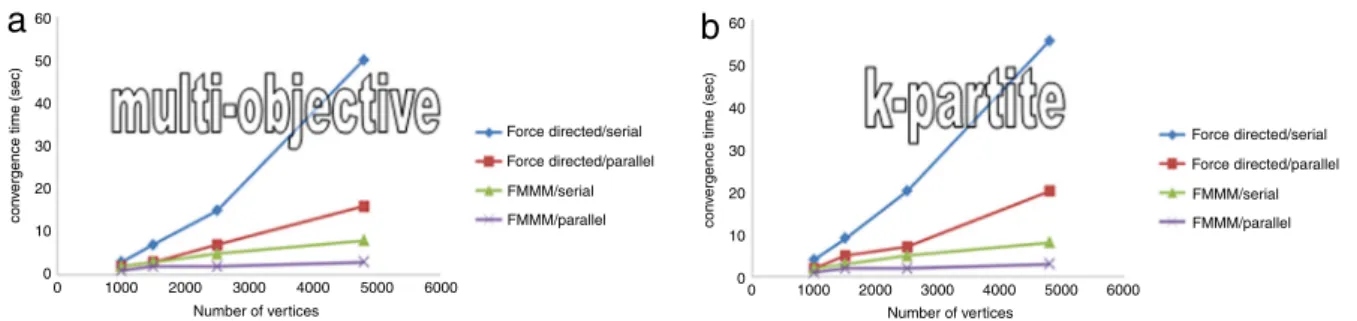
whereNis the number of vertices in the visualized graph. In this respect, the convergence time of both thek-partite algorithm (Section4.2) and the Multi-Objective (Section4.3) are shown inFig. 11(a) and in (b), respectively.
6.
Conclusions
In this paper, an enhanced Graph Analytics Platform for the monitoring of large networks has been presented, mainly focusing on the top-down behavioural investigation of network components by facilitating the traffic traces and available metadata. GAP provides the network operator with an extended toolkit to obtain an overview of the whole network and gradually focus on less abstract data, gaining thus, useful insights about the network status and operations. In particular, it allows the network operator to explore the mobile network and gradually focus on specific subsets of the initial large amounts of data, in order to finally detect anomalous behaviour and trace its origins. The proposed application is designed in order to handle Big Data in a time-efficient manner, starting with a large-scale overview of the
Fig. 11 – Convergence time of (a) thek-partite and the Multi-objective (b) algorithm according to the involved number of nodes and and the method used (see legend).
network and allowing the operator to gradually focus on the desired information and acquiring useful insights. The proposed application addresses modern challenges regarding the research about Big Data, as well as practical issues posed by telecommunication networks, mobile network security companies, social media analysis, internet security and international counter-crime and intelligence agencies.
The demonstration of the enhanced GAP on a mobile network related dataset and on another Twitter related dataset has exhibited some of the platform’s capabilities and has verified the applicability of the latter in both root cause analysis through visualization and visual analytics techniques, as well as its capacity on data mining of interesting events on chaotic amounts of data.
Acknowledgments
This work has been partially supported by the European Com-mission through project FP7-ICT-317888-NEMESYS funded by the 7th framework program. The opinions expressed in this paper are those of the authors and do not necessarily reflect the views of the European Commission.
R E F E R E N C E S
[1] A. Sandryhaila, J.M.F. Moura, Big data analysis with signal
processing on graphs: Representation and processing of massive data sets with irregular structure, IEEE Trans. Signal Process. 31 (5) (2014) 80–90.
[2] X. Wu, X. Zhu, G.Q. Wu, W. Ding, Data mining with big data,
IEEE Trans. Knowl. Data Eng. 26 (1) (2014) 7–107.
[3] L. Akoglu, H. Tong, D. Koutra, Graph based anomaly detection
and description: a survey, Data Min. Knowl. Discov. (2014) 1–63.
[4] S.J. Rysavy, D. Bromley, V. Daggett, DIVE: A graph-based
visual-analytics frame-work for big data, IEEE Comput. Graph. Appl. 34 (2) (2014) 26–37.
[5] R. Vatrapu, R.R. Mukkamala, A. Hussain, B. Flesch, Social set
analysis: A set theoretical approach to big data analytics, IEEE Access 4 (2016) 2542–2571.
[6] K.L. Ma, C.W. Muelder, Large-scale graph visualization and
analytics, IEEE Comput. 46 (7) (2013) 39–46.
[7] I. Butun, S.D. Morgera, R. Sankar, A survey of intrusion
detection sys-tems in wireless sensor networks, IEEE Commun. Surv. Tutor. 16 (1) (2014) 266–282.
[8] J.M. Hellerstein, et al., Interactive data analysis: the control
project, IEEE Comput. 32 (8) (1999) 51–59.
[9] J.K. Petersen, The Telecommunications Illustrated Dictionary,
CRC Press, 2002.
[10] P.P.C. Lee, T. Bu, T. Woo, On the detection of signaling DoS attacks on 3G wireless networks, in: 26th IEEE International Conference on Computer Communications, INFOCOM 2007, 2007, pp. 1289–1297.
[11]P.P.C. Lee, T. Bu, T. Woo, On the detection of signaling DoS
attacks on 3G/WiMax wireless networks, Comput. Netw. 53 (15) (2009) 2601–2616.
[12] A. D’Alconzo, A. Coluccia, F. Ricciato, P. Romirer-Maierhofer, A distribution-based approach to anomaly detection and ap-plication to 3G mobile traffic, in: Global Telecommunications Conference, 2009. GLOBECOM 2009, 2009, pp. 1–8.
[13]A. Coluccia, A. DAlconzo, F. Ricciato, Distribution-based
anomaly detection in network traffic, in: Data Traffic Monitoring and Analysis, Springer, 2013, pp. 202–216.
[14]G. Yan, S. Eidenbenz, E. Galli, Sms-watchdog: Profiling social
behaviours of sms users for anomaly detection, in: Recent Advances in Intrusion Detection, Springer, 2009, pp. 202–223.
[15]E.K. Kim, P. McDaniel, T. La Porta, A detection mechanism
for SMS flooding attacks in cellular networks, in: Security and Privacy in Communication Networks, Springer, 2013, pp. 76–93.
[16] I. Murynets, R.P. Jover, Anomaly detection in cellular Machine-to-Machine communications, in: IEEE International Conference on Communications (ICC), 2013, pp. 2138–2143.
[17]N. Eagle, A. Pentland, Reality mining: sensing complex social
systems, Personal and Ubiquitous Computing 10 (4) (2006) 255–268.
[18] Q. Ye, T. Zhu, D. Hu, B. Wu, N. Du, B. Wang, Cell phone mini challenge award: Social network accuracy exploring temporal communication in mobile call graphs, in: IEEE Symposium on Visual Analytics Science and Technology, VAST’08, 2008. [19] Z. Shen, K.-L. Ma, Mobivis: A visualization system for
explor-ing mobile data, in: IEEE Pacific Visualization Symposium, PacificVIS’08, 2008, pp. 175–182.
[20] SAS Visual Analytics, 2015.http://www.sas.com. [21] Tableau Analytics, 2015.http://www.tableau.com/. [22] Certifuge Systems, 2015.http://centrifugesystems.com/. [23] Alcatel Security-guardian, 2015.
http://www.alcatel-lucent.com/solutions/security-guardian.
[24] NSN mobile guard, 2015.http://nsn.com/sites/default/files/
document/nsn_mobile_guard_executive_summary.pdf.
[25]A. Mislove, M. Marcon, K.P. Gummadi, P. Druschel, B.
Bhattacharjee, Measurement and analysis of online social networks, in: Proceedings of the 7th ACM SIGCOMM Conference on Internet Measurement, ACM, 2007, pp. 29–42.
[26]S.A. Myers, A. Sharma, P. Gupta, J. Lin, Information network
or social network: The structure of the twitter follow graph, in: Proceedings of the Companion Publication of the 23rd International Conference on World Wide Web Companion, International World Wide Web Conferences Steering Committee, 2014, pp. 493–498.
[27]W. Fan, Graph pattern matching revised for social network analysis, in: Proceedings of the 15th International Conference on Database Theory, ACM, 2012, pp. 8–21.
[28] G.-J. Qi, C.C. Aggarwal, T. Huang, Community detection with edge content in social media networks, in: IEEE 28th International Conference on Data Engineering (ICDE), 2012, pp. 534–545.
[29]S. Lee, J. Kim, Warningbird: A near real-time detection system
for suspicious urls in twitter stream, IEEE Trans. Dependable Secure Comput. 10 (3) (2013) 183–195.
[30]C.C. Aggarwal, K. Subbian, Event detection in social streams,
in: SDM, vol. 12, SIAM, 2012, pp. 624–635.
[31] J. Chae, D. Thom, H. Bosch, Y. Jang, R. Maciejewski, D.S. Ebert, T. Ertl, Spatiotemporal social media analytics for abnormal event detection and examination using seasonal-trend decomposition, in: 2012 IEEE Conference on Visual Analytics Science and Technology (VAST), 2012, pp. 143–152.
[32]T. Sakaki, M. Okazaki, Y. Matsuo, Tweet analysis for
real-time event detection and earthquake reporting system development, IEEE Trans. Knowl. Data Eng. 25 (4) (2013) 919–931.
[33]S. Unankard, X. Li, M.A. Sharaf, Emerging event detection in
social networks with location sensitivity, World Wide Web 18 (5) (2015) 1393–1417.
[34] K. Amma, S. Wada, K. Nakayama, Y. Akamatsu, Y. Yaguchi, K. Naruse, Visualization of spread of topic words on twitter using stream graphs and relational graphs, in: Soft Computing and Intelligent Systems, SCIS’14, 2014, pp. 761–764.
[35]S. van den Elzen, D. Holten, J. Blaas, J.J. van Wijk, Reducing
snapshots to points: A visual analytics approach to dynamic network exploration, IEEE Trans. Vis. Comput. Graphics 22 (2016) 1–10.
[36]S. Ghani, B.C. Kwon, S. Lee, J.S. Yi, N. Elmqvist, Visual
analytics for multimodal social network analysis: A design study with social scientists, IEEE Trans. Vis. Comput. Graphics 19 (12) (2013) 2032–2041.
[37]M.E.J. Newman, M. Girvan, Mixing patterns and community
structure in networks, in: Statistical Mechanics of Complex Networks, Springer, 2003, pp. 66–87.
[38]Z. Wu, R. Leahy, An optimal graph theoretic approach
to data clustering: Theory and its application to image segmentation, IEEE Trans. Pattern Anal. Mach. Intell. 15 (11) (1993) 1101–1113.
[39] NEMESYS project, 2015.
http://www.nemesys-project.eu/nemesys/.
[40] I. Kalamaras, S. Papadopoulos, A. Drosou, D. Tzovaras, MoVA: A visual analytics tool providing insight in the big mobile network data, in: The 11th International Conference on Artificial Intelligence Applications and Innovations, AIAI’15, vol. 458, pp. 383–396.
http://dx.doi.org/10.1007/978-3-319-23868-5_27.
[41] R. Ranjan, Streaming big data processing in datacenter
clouds, IEEE Cloud Comput. 1 (1) (2014) 78–83.
[42] M.M. Breunig, H.-P. Kriegel, R.T. Ng, J. Sander, LOF: identifying
density-based local outliers, in: ACM Sigmod Record, vol. 29, ACM, 2000, pp. 93–104.
[43] S. Papadopoulos, A. Drosou, N. Dimitriou, O. Abdelrahman, G. Gorbil, D. Tzovaras, A BRPCA based approach for anomaly detection in mobile networks, in: 30th International Symposium on Computer and Information Sciences (ISCIS), in: Lecture Notes in Electrical Engineering, vol. 363, 2015, pp. 115–125.http://dx.doi.org/10.1007/978-3-319-22635-4_10.
[44] S. Papadopoulos, V. Mavroudis, A. Drosou, D. Tzovaras, Visual
analytics for enhancing supervised attack attribution in mobile networks, in: Information Sciences and Systems 2014, Springer, 2014, pp. 193–203.
[45] T, M.J. Fruchterman, E.M. Reingold, Graph drawing by
force-directed placement, Softw. - Pract. Exp. 21 (11) (1991) 1129–1164.
[46] S. Papadopoulos, A. Drosou, D. Tzovaras, A novel graph-based descriptor for the detection of billing-related anomalies in cellular mobile networks, IEEE Trans. Mobile Comput. (2016)
http://dx.doi.org/10.1109/TMC.2016.2518668. Early Access.
[47] I. Kalamaras, A. Drosou, D. Tzovaras, Multi-objective
optimization for multimodal visualization, IEEE Trans. Multimedia 16 (5) (2014) 1460–1472.
[48] I. Kalamaras, A. Drosou, D. Tzovaras, A multi-objective approach for the clustering of abnormal behaviours in mobile networks, in: IEEE International Conference in Communications Workshop (ICCW), 2015, pp. 1491–1496.
[49] B. Ding, D. Lo, J. Han, S.-C. Khoo, Efficient mining of closed
repetitive gapped subsequences from a sequence database, in: IEEE 25th International Conference on Data Engineering, ICDE’09, IEEE, 2009, pp. 1024–1035.
[50] GenieLog, GEDIS Studio online, 2014.
[51] S. Papadopoulos, A. Drosou, D. Tzovaras, Fast frequent episode mining based on finite-state machines, in: 30th International Symposium on Computer and Information Sciences (ISCIS), in: Lecture Notes in Electrical Engineering, vol. 363, 2015, pp. 199–208.