Design and Operation of Compressed Air
Energy Storage (CAES) for Wind Power
through Process Modelling and Simulation
A thesis submitted in partial fulfilment of the requirements for the degree of
Doctor of Philosophy
2018
Hui Meng
Supervisor: Prof Meihong Wang
Department of Chemical and Biological Engineering
Faculty of Engineering
i
Acknowledgement
I would like to express my sincere gratitude to my supervisor Prof Meihong Wang for his support, patience, motivation and immense knowledge. His guidance and suggestions helped me in all the time of research, writing of this thesis and future development of career. I could not have imagined having a better supervisor for my PhD study.
My sincere thanks also go to Dr Olumide Olumayegun, Dr Xiaobo Luo and Dr Mathew Aneke for their insightful comments on my published journal papers. I would also like to thank all of the group members at the Process & Energy Systems Engineering Group and my friends at the University of Hull and the University of Sheffield.
I would like to thank my family for all their love and encouragement. My parents raised me with a love of science and supported me in all my pursuits. Most of all for my loving and encouraging wife Xiaoyan Liu, whose faithful support during the entire stages of my PhD study is so appreciated.
I am also grateful to the Great Britain-China Educational Trust (GBCET) for the support of the Chinese student awards.
ii
Abstract
The compressed air energy storage (CAES) system, one of the grid-scale (>100MW) energy storage technologies, has been deployed in Germany and the USA. The round-trip efficiency of current commercial CAES plants is still low and needs to be improved. The CAES system will also play an important role in balancing electricity supply and demand because it can be integrated with renewable energy sources to overcome the intermittency problem. One unique feature of a CAES system integrated with wind power is that it is difficult to maintain constant operating conditions for CAES compression system due to fluctuating wind power output. The aim of this thesis is to study the approaches to improve the round-trip efficiency of CAES system, design and operation of the CAES system in the context of wind power and cost reduction when implementing the CAES system. This study is performed through process modelling, simulation and analysis.
In this study, an integrated system consisting of a CAES system and an organic Rankine cycle (ORC) was proposed to recover waste heat from the CAES system for improving the round-trip efficiency of the CAES system. Steady-state process models of the CAES system and the ORC were developed in Aspen Plus®. These models were validated using data from the literature. Process analysis was carried out using validated models regarding the impact of different organic working fluids (e.g. R123, R134a, R152a, R245fa, R600a) of ORC and expander inlet pressures of the ORC on system performance. It was found that integrating ORC with CAES system can be an effective approach to improve the performance of the CAES system. The round-trip efficiency was improved by 3.32-3.95%, compared to that of a CAES system without ORC.
iii
The performance analysis of a CAES system in the context of wind power at design and off-design conditions were investigated through process simulation. Different operation strategies for fluctuating wind power outputs were proposed. Steady-state models for charging and discharging processes of the CAES system were developed in Aspen Plus® and validated. To enable off-design performance analysis, compressor and turbine characteristic curves were used during model development. A pseudo-dynamic model for cavern was developed in Excel. It was found that the CAES system at variable shaft speed mode has better performance than that at constant shaft speed mode because at variable shaft speed mode, it can utilise more excess wind energy (49.25 MWh), store more compressed air (51.55×10³ kg), generate more electricity (76.00 MWh) and provide longer discharging time than at constant shaft speed mode.
Economic evaluation based on levelized cost of electricity (LCOE) was performed using Aspen Process Economic Analyser® (APEA). In terms of CAES system integrated with ORC, different working fluids in ORC and different power sources (e.g. wind and solar) associated with the CAES system were considered to estimate the LCOEs. It was found that the LCOEs for the integrated system were competitive with fossil-fuel fired power and even lower than offshore wind power and solar power. As for the CAES system in the context of wind power, it was found that the LCOE for the CAES system for wind power at variable shaft speed mode is lower than at constant shaft speed mode and the LCOEs at both modes are lower than solar and offshore wind power, conventional powers (e.g. natural gas combustion turbine) and especially the residential electricity price.
iv
Results and insights presented in this PhD thesis will help to promote the commercial development of CAES technology.
Keywords:
CAES, Wind power, ORC, Process modelling, Process design, Process operation, Process integration.
v
Peer-reviewed Publications and Presentations
Part of this thesis has been published in the following peer-reviewed journals:
Meng, H., Wang, M., Aneke, M., Luo, X., Olumayegun, O. and Liu, X. (2018). Technical Performance Analysis and Economic Evaluation of a Compressed Air Energy Storage System Integrated with an Organic Rankine Cycle. Fuel, 211: 318–330.
Meng, H., Wang, M., Olumayegun, O., Luo, X. and Liu, X. (2018). Performance investigation and economic evaluation of compressed air energy storage (CAES) system integrated with wind power at design and off-design conditions.
Renewable Energy. (Under Review)
The author contributed to the publication of the journal paper:
Liu, X., Chen, J., Luo, X., Wang, M. and Meng, H. (2015). Study on Heat Integration of Supercritical Coal-Fired Power Plant with Post-Combustion CO2
Capture Process through Process Simulation. Fuel, 158: 625–633.
Conference Presentation:
Meng, H., Wang, M., Olumayegun, O. (2018). Performance analysis at design and off-design conditions for a compressed air energy storage system integrated with wind energy. 12th European Conference on Coal Research and its Application (ECCRIA), Cardiff University, Cardiff, UK, 5-7 September 2018.
vi
Table of Contents
Acknowledgement ... i
Abstract ... ii
Peer-reviewed Publications and Presentations ... v
Table of Contents ... vi List of Figures ... xi List of Tables ... xv Nomenclatures ... xvii Abbreviations ... xix 1. Introduction ... 1 1.1 Background ... 1
1.1.1 Energy demand and renewable energy ... 1
1.1.2 Energy storage and energy storage technologies ... 3
1.1.2.1 Energy storage and benefits ... 3
1.1.2.2 Classification of energy storage technologies ... 4
1.1.2.3 Brief introduction to energy storage technologies ... 6
1.1.2.3.1 Pumped Hydroelectric Storage (PHS) ... 6
1.1.2.3.2 CAES ... 7
1.1.2.3.3 Flywheel Energy Storage (FES) ... 8
1.1.2.3.4 Conventional Battery ... 9
1.1.2.3.5 Flow Battery Energy Storage ... 13
1.1.2.3.6 Hydrogen Energy Storage (HES) ... 15
1.1.2.3.7 Capacitor and Supercapacitor ... 16
1.1.2.3.8 Superconducting Magnetic Energy Storage (SMES) ... 17
1.1.2.3.9 Thermal Energy Storage (TES) ... 18
1.1.2.4 Comparison of technical characteristics of energy storage technologies ... 19
1.1.3 Process description of the CAES system ... 20
vii
1.1.5 Air compressor and its implementation in CAES system ... 24
1.1.5.1 Axial compressor ... 24
1.1.5.2 Centrifugal compressor ... 25
1.1.5.3 Implementation of compressors in the CAES system ... 26
1.1.6 Linking of wind electricity to the electricity grid ... 27
1.1.6.1 Wind turbine ... 27
1.1.6.2 Wind turbines connected to the electricity grid ... 27
1.2 Motivations for this study ... 28
1.2.1 Grid-scale capacity ... 28
1.2.2 Round-trip efficiency ... 29
1.2.3 Use of renewable energy sources ... 29
1.3 Aim and objectives of this research ... 30
1.4 Novel contributions ... 32
1.5 Scope of this study ... 33
1.6 Research methodology and software tools used in this study ... 34
1.6.1 Research methodology ... 34
1.6.2 Software tools used in the study ... 35
1.6.2.1 Aspen Plus® ... 35
1.6.2.2 Aspen Process Economic Analyzer® (APEA)... 36
1.7 Outline of the thesis ... 36
2. Literature Review ... 39
2.1 Lab experimental rigs on CAES for wind power and relevant studies ... 39
2.1.1 Lab experimental rigs on a unidirectional hybrid system and relevant studies ... 39
2.1.1.1 Lab experimental rigs ... 39
2.1.1.2 Relevant studies ... 41
2.1.2 Lab experimental rigs on a bidirectional hybrid system and relevant studies ... 42
2.1.2.1 Lab experimental rigs ... 42
2.1.2.2 Relevant studies ... 43
2.2 Pilot CAES plants ... 43
viii
2.2.2 Supercritical CAES (SC-CAES) plant ... 45
2.2.3 Advanced CAES pilot plant ... 46
2.3 Commercial CAES plants ... 47
2.3.1 Huntorf CAES plant ... 47
2.3.2 McIntosh CAES plant ... 48
2.3.3 Comparison between the two commercial CAES plants ... 49
2.4 Planned CAES projects ... 50
2.4.1 Iowa CAES project ... 50
2.4.2 ADELE A-CAES project ... 51
2.4.3 Norton CAES project ... 52
2.4.4 Larne CAES Project ... 53
2.4.5 Texas CAES project ... 53
2.4.6 Columbia Hills CAES plant and Yakima Minerals hybrid CAES plant 53 2.4.7 Summary ... 55
2.5 Performance improvement of CAES and system optimisation ... 56
2.5.1 Methods for performance improvement and system optimisation ... 56
2.5.2 A-CAES system ... 58
2.5.3 ORC for performance improvement ... 61
2.6 CAES system integrated with renewable energy sources ... 63
2.6.1 CAES system integrated with wind power ... 63
2.6.2 CAES system integrated with photovoltaic power ... 65
2.7 Economic evaluation and environmental impact ... 66
2.7.1 Economic evaluation ... 66
2.7.2 Environmental impact ... 67
2.8 Performance criteria for CAES system ... 68
2.8.1 Heat rate ... 68
2.8.2 Charging electricity ratio ... 69
2.8.3 Round-trip efficiency ... 70
2.9 Summary ... 71
3. Model Development and Model Validations ... 73
3.1 Introduction ... 73
ix
3.2.1 Model development of charging and discharging processes of CAES
system ... 73
3.2.2 Model validation of the Huntorf CAES plant ... 75
3.2.3 Model comparison of the Columbia Hills CAES plant ... 77
3.3 Model development and validation of ORC ... 79
3.3.1 Process description of ORC ... 79
3.3.2 Model development of ORC ... 80
3.3.3 Model validation of ORC ... 81
3.4 Development of improved models for compressors, turbines and cavern of CAES system and model validations ... 83
3.4.1 Characteristic curves for compressors and turbines ... 83
3.4.2 Development of improved models for compressors and turbines ... 86
3.4.3 Model validations for compressors and turbines of the CAES system .. 86
3.4.4 Pseudo-dynamic model for cavern of CAES system ... 89
3.5 Improved model of the CAES system for wind power ... 91
3.6 Conclusions... 91
4. Technical Performance Analysis of a CAES System Integrated with ORC 93 4.1 Introduction ... 93
4.2 Process description ... 93
4.2.1 Process description of the CAES system integrated with ORC for waste heat recovery ... 93
4.2.2 Integration of the CAES system with ORC ... 95
4.2.3 Saturation curves and operating point of ORC ... 96
4.3 Round-trip efficiency of the integrated system ... 98
4.4 Process analysis and technical performance evaluation of the integrated system ... 99
4.4.1 Effects of the ORC organic working fluids ... 100
4.4.2 Effects of expander inlet pressure (EIP) of the ORC ... 104
4.5 Conclusions... 107
5. Performance Investigation of CAES System for Wind Power at Design and Off-design Conditions ... 109
x
5.2 Process description and operation strategies for the CAES system integrated
with wind power ... 109
5.2.1 Process description of the CAES system integrated with wind power 109 5.2.2 Operation strategies for the CAES system for wind power ... 111
5.3 Type selection for compressors and turbines of the CAES system ... 112
5.4 Performance analysis of the CAES system in the context of wind power . 114 5.4.1 Performance evaluation of the CAES system at design condition ... 114
5.4.2 Off-design analysis of the CAES system for wind power ... 118
5.4.2.1 Constant shaft speed mode ... 118
5.4.2.2 Variable shaft speed mode ... 124
5.4.2.3 Comparison between the two modes ... 127
5.5 Conclusions... 129
6. Economic Evaluation ... 131
6.1 Introduction ... 131
6.2 Methodology of economic evaluation ... 131
6.3 Economic evaluation for the CAES system integrated with ORC ... 133
6.3.1 Economic evaluation of effects of different working fluids of the ORC ... 133
6.3.2 Economic evaluation of effects of different power sources ... 135
6.3.3 Comparison of LCOEs for different power sources ... 137
6.4 Economic evaluation for the CAES system for wind power ... 138
6.5 Conclusions... 140
7. Conclusions and Recommendations for Future Work ... 142
7.1 Conclusions... 142
7.1.1 Model development and model validations ... 142
7.1.2 The CAES system integrated with ORC ... 143
7.1.3 The CAES system for wind power ... 143
7.2 Recommendations for future work ... 145
xi
List of Figures
Figure 1-1. The situation of global electrical energy consumption from 1996 to
2016……….……….... 1
Figure 1-2. The situation of global electricity generation by different power sources from 1974 to 2016………...……… 2
Figure 1-3. The schematic concept of energy storage……….. 3
Figure 1-4. Classification of energy storage technologies……… 5
Figure 1-5. The schematic diagram of PHS……….. 6
Figure 1-6. The schematic diagram of the CAES system………..7
Figure 1-7. The schematic diagram of the FES system……….... 8
Figure 1-8. The schematic diagram of the lead-acid battery………... 10
Figure 1-9. The schematic diagram of the NaS battery………....11
Figure 1-10. The schematic diagram of the Li-ion battery………. 13
Figure 1-11. The schematic diagrams of VRB flow batteries……… 14
Figure 1-12. The schematic diagrams of ZnBr flow batteries………. 15
Figure 1-13. The schematic diagram of the HES………. 16
Figure 1-14. The schematic diagram of a supercapacitor……… 17
Figure 1-15. The schematic diagram of the SMES system……….. 18
Figure 1-16. A schematic diagram of a CAES system……… 20
Figure 1-17. A schematic diagram of an A-CAES system……….. 21
Figure 1-18. The schematic diagram of the axial compressor………. 25
Figure 1-19. The schematic diagram of the centrifugal compressor……….. 25
Figure 1-20. The schematic diagram of a wind turbine……….. 27
xii
Figure 1-22. Operation of the CAES system in the context of wind power within 24
hours……….. 30
Figure 1-23. Overview of the scope of this thesis………... 33
Figure 1-24. Overview of research methodology……… 34
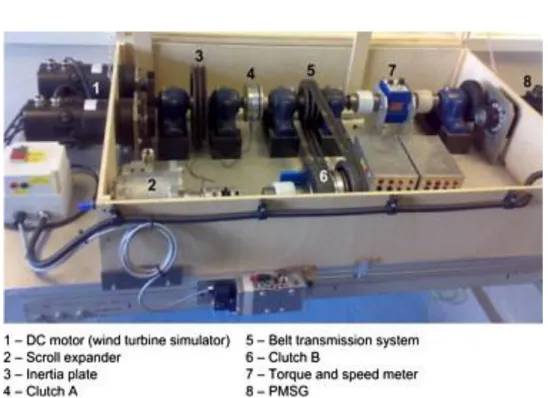
Figure 2-1. The schematic diagram of the unidirectional hybrid system ……….. 41
Figure 2-2. The experimental test rig of the unidirectional hybrid system ………. 40
Figure 2-3. The schematic diagram of the bidirectional hybrid system.…….….... 42
Figure 2-4. The pilot CAES plant with TES………... 43
Figure 2-5. The diagram of pilot CAES plant with TES……… 44
Figure 2-6. A 1.5MWe SC-CAES pilot plant………. 45
Figure 2-7. The schematic diagram of the SC-CAES pilot plant……… 46
Figure 2-8. A 10 MWe advanced CAES pilot plant……… 46
Figure 2-9. The Huntorf CAES plant in Germany………... 47
Figure 2-10. The McIntosh CAES plant……….. 49
Figure 2-11. The planning layout of the ADELE project……… 51
Figure 2-12. The schematic diagram of the Columbia Hills CAES plant……….. 54
Figure 2-13. The schematic diagram of the Yakima Minerals hybrid CAES plant. 55 Figure 2-14. The schematic diagram of a CAES system by Alstom……….. 58
Figure 3-1. A schematic diagram of the Huntorf CAES system……….. 75
Figure 3-2. The schematic diagram of the Columbia Hills CAES plant………… 77
Figure 3-3. A schematic diagram of an ORC………...……….…. 80
Figure 3-4. Characteristics curves of (a) LPC and (b) HPC of the CAES system... 84
Figure 3-5. Characteristics curves of (a) LPT and (b) HPT of the CAES system... 85
xiii
Figure 3-7. The pressure condition of the carven during charging and discharging processes of the CAES system for wind power……….. 89 Figure 4-1. The schematic diagram of the CAES system integrated with ORC….. 94 Figure 4-2. The T-s diagram of ORC……….. 97 Figure 4-3. The P-h diagram for ORC working fluid (e.g. R123)………. 98 Figure 4-4. Round-trip efficiency of the CAES system and the integrated system
using different working fluids………...…...… 103 Figure 4-5. Effect of EIP on ORC net power output during (a) charging and (b) discharging processes of the CAES system……...………...… 105 Figure 4-6. Effect of EIP on the round-trip efficiency of the integrated system during (a) charging and (b) discharging processes………... 106 Figure 5-1. The schematic diagram of the CAES system integrated with wind turbines………...………. 110 Figure 5-2. Wind power output in Northern Ireland over a 48-hour period…... 111 Figure 5-3. The sketch map of the relationship between the air mass flowrate and (a)
pressure ratio or (b) isentropic efficiency for LPC and HPC at constant shaft speed mode……….………... 119 Figure 5-4. The simulation results of charging and discharging power of the CAES
system for wind power at constant shaft speed mode within 24
hours……… 121 Figure 5-5. The air mass flowrate of the CAES system for wind power at constant shaft speed mode within 24 hours ……… 122 Figure 5-6. The mass change of the compressed air in the cavern at constant shaft speed mode within 24 hours………...…….. 123 Figure 5-7. The pressure change in the cavern at constant shaft speed mode within 24 hours……… 123
xiv
Figure 5-8. The simulation results of charging and discharging power of the CAES system for wind power at variable shaft speed mode within 24 hours……….125 Figure 5-9. The air mass flowrate of the CAES system for wind power at variable shaft speed mode within 24 hours ……….... 125 Figure 5-10. The mass change of the compressed air in the cavern at variable shaft speed mode within 24 hours………...……….. 126 Figure 5-11. The pressure change of the compressed air in the cavern at variable shaft speed mode within 24 hours………. 127 Figure 6-1. Comparative LCOEs for different power sources……….. 136 Figure 6-2. Comparative LCOE between the CAES system for wind power and different power sources………...……... 139
xv
List of Tables
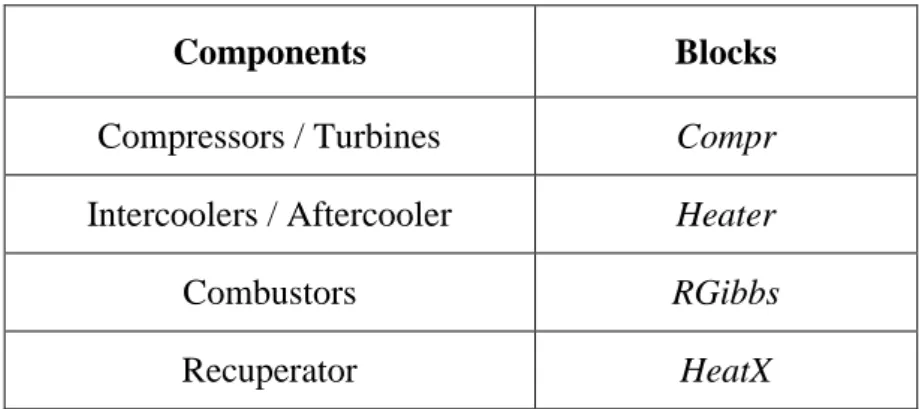
Table 1-1. Comparison of technical characteristics of different energy storage technologies………. 19 Table 2-1. The main components of lab rigs of the unidirectional hybrid system.. 41 Table 2-2. Comparison between the Huntorf and McIntosh CAES plants…….… 50 Table 2-3. Summary of different planned CAES projects……….. 56 Table 3-1. The CAES components and corresponding blocks in Aspen Plus®….. 74 Table 3-2. Input process conditions and parameters for the Huntorf CAES plant.. 76 Table 3-3. Comparison between simulation results and the data of the Huntorf CAES plant……….……… 76 Table 3-4. Input process conditions and parameters of the Columbia Hills CAES plant………...……. 78 Table 3-5. Simulation results compared with literature data from Columbia Hills
CAES plant………. 79 Table 3-6. Summary of components of the ORC and corresponding blocks in Aspen
Plus®………....81
Table 3-7. Input process conditions and parameters of ORC……… 82 Table 3-8. Simulation results compared with ORC data from the Chena Geothermal
Power Plant………..……… 82 Table 3-9. The reference conditions (r), simulation results (s) and relative errors (re) for LP compressor……….……….. 87 Table 3-10. The reference conditions (r), simulation results (s) and relative errors (re) for HP compressors……….. 88 Table 3-11. The reference conditions (r), simulation results (s) and relative errors (re) for turbines………... 88 Table 3-12. Compressibility factor for air………. 90
xvi
Table 4-1. Thermo-physical properties of different refrigerants for ORC……... 101 Table 4-2. Simulation results of the integrated system using different ORC working fluids……….………...……….. 102 Table 5-1. The wind power condition and input parameters at design condition for the CAES system……….……….. 115 Table 5-2. The simulation results of the CAES system at design condition…….. 117 Table 5-3. The simulation results of performance of the CAES system for wind power at design condition ………...………... 117 Table 5-4. The condition of wind power output within 24 hours………. 120 Table 6-1. Parameters for LCOE model……… 132 Table 6-2. Comparison of costs of the CAES system integrated with ORC using different working fluids……….………… 133 Table 6-3. LCOE of the standalone CAES system and the integrated system associated with different power sources……… 135 Table 6-4. Comparison of costs of CAES system for wind power at design and
xvii
Nomenclatures
𝐸𝑇 The output power of Turbine (kWh)
𝐸𝐶 Electrical energy taken from wind farm for driving the
compressors (kWh)
𝐸𝑓 Fuel input energy (kWh)
𝐸𝑂𝑅𝐶_1 The power output of ORC during the charging period of the
CAES system (kWh)
𝐸𝑂𝑅𝐶_2 The power output of ORC during the discharging period (kWh)
𝐸𝑝_1 The power consumption of ORC pump during the charging
period (kWh)
𝐸𝑝_2 The power consumption of ORC pump during the discharging
period (kWh)
𝑃𝐸𝐼𝑃 ORC expander inlet pressure (bar)
𝐸𝑜𝑢𝑡𝑝𝑢𝑡 Net power output annually of the integrated system
𝑃 The pressure of the cavern (Pa)
𝑉 The volume of the cavern (m3)
𝑀𝐴𝑖𝑟 The molar mass of the air (kg/kmol)
𝑅 Ideal gas constant (J K-1 mol-1)
𝑇 The temperature in the cavern (K)
𝑛 CAES plant lifetime (year)
𝑖 Discount rate
r Reference CAES system condition
s Simulation result
re Relative error
xviii
Greek Symbols
𝜂𝑠𝑦𝑠 System electric efficiency
𝜂𝑒𝑓𝑓_1 Round-trip efficiency of the CAES system
𝜂𝑒𝑓𝑓_2 Round-trip efficiency of the CAES system with system electric
efficiency
𝜂𝐶𝐴𝐸𝑆+𝑂𝑅𝐶 Round-trip efficiency of the integrated system based on reducing
the electricity taken from the grid
𝜂𝐶𝐴𝐸𝑆+𝑂𝑅𝐶′ Round-trip efficiency of the integrated system based on the
xix
Abbreviations
ACAPEX Annualised capital expenditure AC Alternating current
APEA Aspen Process Economic Analyser®
CAPEX Capital expenditure CER Charging electricity ratio CRF Capital recovery factor
CAES Compressed air energy storage DC Direct current
FES Flywheel energy storage FOPEX Fixed operation expenditure
HES Hydrogen energy storage HPC High-pressure compressor HPT High-pressure turbine
HR Heat rate
LCOE Levelized cost of electricity LHV Lower heating value
LPC Low-pressure compressor LPT Low-pressure turbine ORC Organic Rankine cycle
PHS Pumped hydroelectric storage
SMES Superconducting magnetic energy storage TAC Total annual cost
TES Thermal energy storage
1
1. Introduction
This chapter will introduce the background and aim of this research. Section 1.1 summarises the up-to-date development status of global energy demand and greenhouse gases emissions, briefly introduces different energy storage technologies, compressors of the CAES system and wind turbines connected to the electricity grid. Section 1.2 presents the motivations for this study. Section 1.3 summarises the aim and objectives of this study. Section 1.4 justifies the predicted novel contributions. Section 1.5 explains the scope of this study. Section 1.6 introduces research methodology and the software tools used in this study. Finally, Section 1.7 gives the outline of the thesis.
1.1 Background
1.1.1 Energy demand and renewable energy
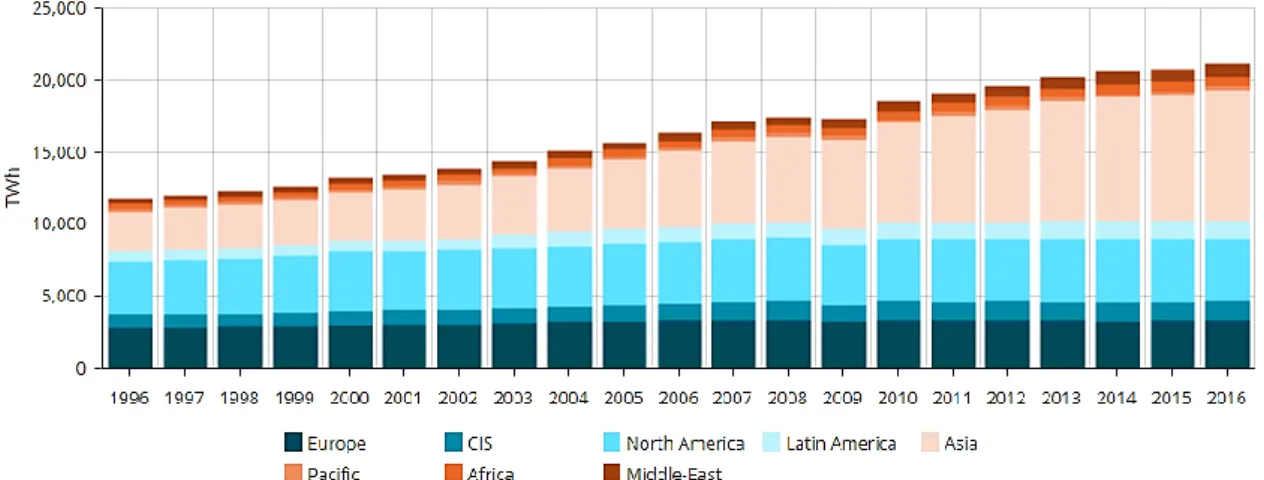
With the increase in global electrical energy demand, the annual amount of world electricity consumption reached 21,200 TWh in 2016 and the trend of global power consumption is still growing as shown in Figure 1-1 (Enerdata, 2017).
Figure 1-1. The situation of global electrical energy consumption from 1996 to 2016 (Enerdata, 2017).
2
Figure 1-2 shows that power generation by fossil fuels (e.g. coal, oil and natural gas) in conventional power plants contributed approximately 60% of world electrical energy supply in 2016 (IEA, 2017). As a result, massive CO2 emissions released
from these conventional power plants to the atmosphere has resulted in the problem of the greenhouse effect (Liu et al., 2015).
Figure 1-2. The situation of global electricity generation by different power sources from 1974 to 2016 (IEA, 2017).
To reduce the CO2 emissions and also the high dependence on fossil fuels for power
generation, renewable energy sources such as wind, solar and tide powers can be considered as alternative power generation sources (Skea and Nishioka, 2008; Ibrahim et al., 2008; Castillo and Gayme, 2014). In recent years, renewable energy sources have increased to nearly 10% of the world power generation in 2016 (IEA, 2017). The capacity of wind power reached 3% of global electricity production in 2015 and it is expected to increase from 11.6% (3599 TWh) in 2030 to 14.8% (6145 TWh) in 2050 (Bouman et al., 2016). However, the majority of renewable energy
3
sources have a common problem of intermittency. The increasing utilisation of renewable energy sources could lead to an imbalance between electricity generation and demand due to the intermittent nature of renewable energy sources, whose output mainly depends on local environmental conditions and unpredictable weather (Pan et al., 2016; Arsie et al., 2009). This brings a great challenge to ensure the stability and reliability of the electricity grid (Luo et al., 2015; Ibrahim et al., 2008; Sundararagavan and Baker, 2012). Wind power is one of the major renewable energy sources. Implementing energy storage technologies for wind power can overcome this problem and improve the stability and reliability of the electricity grid (Chen et al., 2009; Beaudin et al., 2014; Liu et al., 2017; Sioshansi et al., 2011).
1.1.2 Energy storage and energy storage technologies
1.1.2.1 Energy storage and benefits
The basic concept of energy storage is to store the energy and generate the energy for use when needed (Luo et al., 2015; Chen et al., 2009). The process of storing the energy can be regarded as the charging process, the process of releasing the energy can be regarded as the discharging process. Various working mediums used to store the energy can be regarded as the energy carriers (Aneke and Wang, 2016). Figure 1-3 presents the schematic concept of energy storage.
4
A key benefit of energy storage is better energy storage management, which can reduce the waste of energy and enhance the energy utilisation efficiency of power systems (Abedin and Rosen, 2012; Chan et al., 2013; Aneke and Wang, 2016). A process of electrical energy storage is to convert electricity into a form of energy stored for converting back to electricity when needed (Chen et al., 2009; Luo et al., 2015). The electrical energy storage can be one of the most promising methods to address the problem of intermittent renewable energy sources and energy storage technologies have become increasingly important in balancing supply and demand of electricity to improve the quality and maintain stability of the grid network, as well as help in load shifting and peak shaving (Ibrahim et al., 2008; Radcliffe, 2013; Pardo et al., 2014; Castillo and Gayme, 2014; Kousksou et al., 2014).
1.1.2.2 Classification of energy storage technologies
There are two suggested approaches to categorise the different energy storage technologies, depending on their functions and forms of stored energy (Chen et al., 2009). The classification of energy storage technologies is shown in Figure 1-4. Energy storage technologies can be classified by the form of stored energy into mechanical, electrical, chemical and thermal energy storage technologies. According to the functional classification, energy storage technologies can be divided into technologies for energy management, and power quality and reliability. By comparison, the most widely adopted method of the classification for energy storage technologies is according to the form of stored energy (Chen et al., 2009; Luo et al., 2015; Aneke and Wang, 2016).
5
6
1.1.2.3 Brief introduction to energy storage technologies 1.1.2.3.1 Pumped Hydroelectric Storage (PHS)
PHS is a mature technology and widely implemented large-scale energy storage technology (more than 100 MWe). The schematic diagram of the PHS is shown in Figure 1-5.
Figure 1-5. The schematic diagram of PHS (Luo et al., 2015).
There are two reservoirs located at different elevations. During the period of the charging process, water is pumped from a lower reservoir to a higher reservoir using off-peak electricity. During the period of the discharging process, the water flows from the higher reservoir to the lower reservoir to drive the turbine and to generate electricity. The rated power of PHS power plants can be between 1MWe and 3,003 MWe, the round-trip efficiency is around 70-85% with more than 40 years lifetime (Chen et al., 2009; Luo et al., 2015; Aneke and Wang, 2016; Ibrahim et al., 2008). Currently, there is more than 78,000 MWe capacity of PHS power plants in the world and the percentage of the PHS is over 99% of the worldwide large-scale energy storage construction (Aneke and Wang, 2016). One major limitation of PHS is the geographical requirement, including two large reservoirs at different
7
elevations. A long lead time (about 10 years) and high initial capital cost for construction, as well as environmental impacts, are constraints for the PHS development (Denholm and Kulcinski, 2004; Ferreira et al., 2013; Luo et al., 2015; Chen et al., 2009).
1.1.2.3.2 CAES
In addition to PHS, CAES is another large-scale energy storage (more than 100 MW) technology. A schematic diagram of a CAES system is given in Figure 1-6.
Figure 1-6. The schematic diagram of the CAES system (Ryan, 2017).
During the period of the charging process, the surplus off-peak electricity will be utilised to drive the compressors of the CAES system for compressing and injecting the air into the cavern. During the period of the discharging process, the compressed air stored in the cavern can be released and expanded in the turbines for generating electricity at peak time. Currently, there are two commercial CAES plants in the world, one is the Huntorf CAES plant established in 1978 with a rated power of 290 MWe and round-trip efficiency of around 42% in Germany, another is the McIntosh
8
CAES plant established in 1991 with a rated power of 110 MWe and round-trip efficiency of around 54% in the USA. The advantages of the CAES system include flexible size from kW to MW and it can be integrated with renewable energy sources to overcome the problem of intermittency. Nevertheless, the drawbacks of this system include the high initial capital cost and the limitation of the underground cavern. Details of the working principle of the CAES system will be described in Section 1.1.3.
1.1.2.3.3 Flywheel Energy Storage (FES)
An FES system consists of five key components: a flywheel, magnetic bearings, a motor/generator unit and a vacuum chamber (Amiryar and Pullen, 2017). The schematic diagram of the FES system is shown in Figure 1-7.
Figure 1-7. The schematic diagram of the FES system (Luo et al., 2015).
During the period of the charging process, the electricity is utilised to accelerate the motor connected to the flywheel through the bearing, the shaft rotation can transfer the rotational momentum to the flywheel which can store the energy. During the period of the discharging process, the flywheel transfers the kinetic energy and converts it back to electricity using the generator connected to the shaft. FES can be
9
classified into two types based on the rotating speed: low-speed and high-speed FES. The rotating speed of the low-speed FES is less than 6000 rpm, the high-speed FES is up to approximately 100,000 rpm (Pena-Alzola et al., 2011). The amount of energy stored depends on the rotating speed of the flywheel. The round-trip efficiency of the FES could be as high as 95%. It has a high power density, low maintenance cost, long lifetime and it is environmentally friendly (Luo et al., 2015; Aneke and Wang, 2016). However, the FES is not good for long time energy storage and the frictional force could decrease the round-trip efficiency in the process of operation (Ibrahim et al., 2008).
1.1.2.3.4 Conventional Battery
The conventional battery is the oldest way for electrical energy storage, which can store the electricity in the form of chemical energy. A rechargeable battery involves three key parts: the positive electrode (anode), the negative electrode (cathode) and the liquid, paste or solid electrolyte. These three sections constitute an electrochemical cell. During the process of discharging, the chemical reactions occur at the two electrodes and current flows through the external circuit from the anode to the cathode. During the charging process, the reaction will occur reversibly, the battery can be recharged by applying an external voltage across the electrodes (Ferreira et al., 2013; Chen et al., 2009). Most of the batteries can respond rapidly to load changes, which can improve the stability of the electricity grid or system. Batteries have a high energy efficiency (up to 95%), short lead time and easy installation (Kondoh et al., 2000; Kluiters et al., 1999; Luo et al., 2015). However, the disadvantages of batteries include low energy densities, small power capacity, high maintenance costs and short lifetimes. Also, many batteries contain toxic
10
materials which have a negative impact on the environment (Chen et al., 2009). There are different types of batteries in development, including lead acid, nickel cadmium, sodium sulphur, sodium nickel chloride and lithium-ion batteries (Luo et al., 2015; Aneke and Wang, 2016).
Lead-acid (PbO2) battery
The lead-acid battery is the oldest rechargeable battery and is used widely for both household and commercial applications. The schematic diagram of the lead-acid battery is shown in Figure 1-8. The anode is made of PbO2, the cathode is made of Pb and the electrolyte is sulfuric acid. The lead-acid battery has a rapid response time, low capital cost and high cycle efficiency with 63-90% (Hadjipaschalis et al., 2009; Kondoh et al., 2000; Luo et al., 2015). The lead-acid battery can be used as backup power for telecommunication systems and energy management systems. For example, it has been implemented as power sources in the vehicle industries (Ferreira et al., 2013; Luo et al., 2015). The drawbacks of the lead-acid battery include low cycle time (up to about 2000) and low energy density (Baker, 2008).
11 Nickel-cadmium (NiCd) battery
The NiCd battery is one of the most developed nickel-based batteries. It consists of a nickel hydroxide positive electrode plate, a cadmium hydroxide negative electrode plate and an alkaline electrolyte (Chen et al., 2009). The NiCd battery has high energy density and low maintenance requirements. Nonetheless, the weakness of this kind of battery is the high capital cost which is about 10 times higher than the lead-acid battery and the toxic metals (cadmium and nickel) which could be harmful to the environment (Aneke and Wang, 2016; Ferreira et al., 2013).
Sodium Sulphur (NaS) battery
NaS battery is considered as one of the most promising batteries implemented for energy storage in the fields of electricity distribution grid system, wind power integration and high-value grid service (Luo et al., 2015; Aneke and Wang, 2016). As shown in Figure 1-9, a NaS battery includes molten sodium at the negative electrode, molten sulphur at the positive electrode and employs beta-alumina as the solid electrolyte.
12
This battery needs to be operated at a high-temperature environment (e.g. 300-350˚C) during the periods of charging and discharging processes. The NaS battery can provide high energy density, high energy efficiency, long cycle life (~2500) and long discharge time (around 6 hours). The weaknesses of this kind of battery include a high operating temperature and a high capital cost. Sodium is combustible when it is exposed to water.
Sodium Nickel Chloride (NaNiCl2) battery
The NaNiCl2 battery is similar to the NaS battery, it also needs a high operation
temperature at around 270-350˚C. During the process of charging, NaCl salt and Ni can be converted into NiCl2 and molten Na. The chemical reaction will be reversed
during the process of discharging (Aneke and Wang, 2016). Compared with the NaS battery, the NaNiCl2 battery has better safety characteristics, but the moderate
energy density could be a weakness (Luo et al., 2015). At present, this battery has been used in the electric vehicles and submarines (Ferreira et al., 2013).
Lithium-ion (Li-ion) battery
The Li-ion battery (refer to Figure 1-10) uses a lithiated metal oxide as the cathode and graphitic carbon with a layering structure as the anode (Chen et al., 2009). This battery has been widely used for portable electronics and medical units. Compare with other batteries, the Li-ion battery is smaller, lighter and more powerful. The energy density is around 90-190 Wh/kg and power density is around 500-2000 W/kg (Hadjipaschalis et al., 2009; Aneke and Wang, 2016). Moreover, it has high efficiency and low self-discharge rate. The drawbacks of the Li-ion battery include that the life cycle is easily affected by the temperature and the high capital cost also
13
limits the development in the large capacity applications (Aneke and Wang, 2016; Chen et al., 2009).
Figure 1-10. The schematic diagram of the Li-ion battery (Roy and Srivastava, 2015).
1.1.2.3.5 Flow Battery Energy Storage
Unlike the conventional batteries, the flow battery can store energy in two soluble redox couples which are located in the external tanks of liquid electrolyte. The electrolytes are pumped from the tanks to the cell stack which includes two electrolyte flow compartments and the cell stack is separated by the ion-selective membranes. Thus, the capacity of the flow battery is mainly determined by the size of the electrolyte tanks, the rated power is mainly determined by the size of the cell stacks (Ferreira et al., 2013; Luo et al., 2015). The operation of the flow battery is dependent on the reduction-oxidation reactions of the electrolyte solutions. During the period of the charging process, one of the electrolytes at the anode will be oxidised, another electrolyte at the cathode will be reduced. The electricity charged
14
can be transformed into the chemical energy of the electrolyte. The reaction process will be reversed for generating electricity during the period of the discharging process (Ferreira et al., 2013).
The flow batteries have a high efficiency and short response time compared with other batteries. The weaknesses of the flow batteries include the low power density and the toxic characteristics of some materials (Ferreira et al., 2013). Currently, there are two types of flow batteries available for the commercial applications, vanadium redox (VRB) (refer to Figure 1-11) and zinc bromic (ZnBr) (refer to Figure 1-12) batteries.
Figure 1-11. The schematic diagrams of VRB flow batteries (Nikolaidis and Poullikkas, 2017).
15
Figure 1-12. The schematic diagrams of ZnBr flow batteries (Akhil et al., 2016).
The VBR is a mature flow battery system, it has a short response time, long cycle life (~10000 - 16000) and high efficiency (around 85%), but low energy density and high operating cost are the weaknesses which prevent its commercial development. The ZnBr flow battery has a high energy density (~30-65 Wh/L), but the cycle efficiency is low (approximately 65-75%) and the operating temperature range is
narrow (Luo et al., 2015).
1.1.2.3.6 Hydrogen Energy Storage (HES)
The HES is one of the most popular chemical energy storage technology because hydrogen is an efficient, clean and storable energy carrier (Carrasco et al., 2006). As shown in Figure 1-13, during the period of the charging process, the off-peak electricity can be used to electrolyse water to generate hydrogen for later use. The hydrogen can be stored as different forms such as gas or liquid. During the period of discharging process, the stored hydrogen is used in the fuel cell and or burned directly to generate the electricity for the grid (Díaz-González et al., 2012; Luo et
16
al., 2015). One major weakness of the HES is that the energy loss during the operation of a single cycle results in the low round-trip efficiency of the entire system (Schüth, 2012).
Figure 1-13. The schematic diagram of the HES (Ruiz, 2016).
1.1.2.3.7 Capacitor and Supercapacitor
A capacitor consists of two electrical conductors which are separated by a thin and nonconducting layer named a dielectric. When the capacitor is charged, the energy can be stored in an electrostatic field (Arepalli et al., 2005; Chen et al., 2009). Compared with the batteries, the capacitors have a higher power density and shorter charging time. Nevertheless, the development limitations of the capacitors are the finite capacity, low energy density and high energy dissipation because of the high self-discharge losses (Arepalli et al., 2005; Chen et al., 2009; Luo et al., 2015). Supercapacitors, also called electric double-layer capacitors, include two conductor electrodes, a porous membrane separator and an electrolyte (refer to Figure 1-14).
17
Figure 1-14. The schematic diagram of a supercapacitor (Luo et al., 2015).
Compared with the capacitor and electrochemical battery, the supercapacitor has both the characteristics of electrochemical batteries and capacitors (Luo et al., 2015). The supercapacitors store energy in the form of an electrolyte solution between two solid conductors instead of the general arrangement of a solid dielectric between the electrodes. The capacity of energy storage of the supercapacitor is much higher than the capacitor (Chen et al., 2009). The supercapacitors have long cycle times (> 100,000 times) and high cycle efficiency (Smith et al., 2008). Nonetheless, the self-discharge rate (around 5-40%) and the capital cost are high (Ibrahim et al., 2008; Díaz-González et al., 2012).
1.1.2.3.8 Superconducting Magnetic Energy Storage (SMES)
A SMES system includes three key components: a refrigerator and vacuum system, a power conditioning system and a superconducting coil/magnet unit. The schematic diagram of the SMES system is shown in Figure 1-15. The SMES system stores energy in the magnetic field created by the flow of the direct current (DC) in the superconducting coil, the temperature of the stored energy can be cooled to be lower
18
than its superconducting critical temperature. During the period of the discharging process, the stored energy can be released to the alternating current (AC) system using a power coverter module.
Figure 1-15. The schematic diagram of the SMES system (Luo et al., 2015).
The DC will increase during the charging process of the SMES system. The advantages of SMES system include a high power density (~4000 W/L), rapid response time, high cycle efficiency (~95-98%) and long lifetime (up to 30 years) (Smith et al., 2008; Chen et al., 2009; Luo et al., 2015; Schoenung, 2001). The drawbacks of the SMES system include high capital cost, high self-discharging rate (10-15%) and effects of the strong magnetic field (Schoenung, 2001; Beaudin et al., 2014).
1.1.2.3.9 Thermal Energy Storage (TES)
The TES technology can store the heat energy in the tanks/ reservoirs which can be used to store electricity or recover waste heat using different methods. There are three key approaches including sensible heat storage, latent heat storage and thermochemical heat storage methods. The sensible heat storage stores energy through changing temperature of the material (e.g. molten salt), the latent heat
19
storage stores energy through the phase change of materials (e.g. paraffin), the thermochemical heat storage stores energy through the chemical structure changes of the materials (e.g. metallic hydrides: CaH2; organic system: CH4/H2O) (Aneke
and Wang, 2016; Ibrahim et al., 2008; Sharma et al., 2009). The self-discharge rate is low (about 0.05-1%), the storage reservoirs have a high energy density (80-500 Wh/L). However, the round-trip efficiency of TES is low (around 30-60%) (Ibrahim
et al., 2008; Chen et al., 2009; Luo et al., 2015).
1.1.2.4 Comparison of technical characteristics of energy storage technologies Table 1-1. Comparison of technical characteristics of different energy storage technologies (Aneke and Wang, 2016; Luo et al., 2015; Chen et al., 2009; Zhao et
al., 2015; Hadjipaschalis et al., 2009).
System Energy density (Wh/L) Power density (W/L) Power rating (MW) Discharging time Suitable storage duration Response time Round-trip efficiency (%) Capital cost ($/kW) PHS 0.5-1.5 0.1-0.2 100-5000 1-24 hrs+ Hours-months Minutes 70-85 600-2000 CAES 2-6 0.2-0.6 5-300 1-24 hrs+ Hours-months Minutes 40-75 400-800
FES 20-80 5000 0-0.25 Up to 15mins
Seconds-minutes < Second 85-95 250-350 PbO2 50-80 90-700 0-20 Seconds-hours
Mintues-days < Second 63-90 300-600
NiCd 15-80 75-700 0-40 Seconds-hours
Mintues-days < Second 60-80 500-1500
NaS 15-300 120-160 0.05-8 Seconds-hours
Seconds-hours < Second 70-90
1000-3000 NaNiCl2 150-180 220-300 0-0.3 Seconds-hours
Seconds-hours < Second 85-90 150-300 Li-ion 200-400 1300-10000 0-0.1 Mintues-hours Mintues-days < Second 90-97 1200-4000 VRB 20-70 0.5-2 0.03-3 Seconds-10 hrs Hours-months Seconds 65-85 600-1500 ZnBr 30-60 1-25 0.05-2 Seconds-10 hrs Hours-months Seconds 65-75 700-2500 HES 500-3000 0.2-20 0-50 Seconds-24 hrs+ Hours-months Seconds-mintues 20-50 10000+
Capacitor 2-10 100000+ 0-0.05 Up to 60 mins Seconds-hours < Second 60-70 200-400 Supercapacitor 10-20
40000-120000 0-0.3 Up to 60 mins
Seconds-hours < Second 85-98 100-300
SMES 0.2-6 1000-4000 0.1-10 Up to 8s Seconds-1 hour < Second 95-98 200-300
TES 80-500 ─ 0.1-300 1-24 hrs+
Mintues-months
Not for rapid
20
Some enegy storage technologies have unique charateristics which can be implemented in the particular energy storage applications. These unique characteristics can help in the selection of the proper energy storage technologies to be used in any given conditions. The details of technical characteristics of different energy storage technoilogies are summarised in Table 1-1.
1.1.3 Process description of the CAES system
Figure 1-16. A schematic diagram of a CAES system (Butcher, 2010).
A CAES process (as shown in Figure 1-16) consists of three main subsystems: air charging, compressed air storage and compressed air discharging subsystems. In the charging subsystem, excess electricity at the off-peak time is utilised to compress air. The compressed air is injected into underground storage at high pressure. In the discharging subsystem, the stored compressed air in the cavern is extracted for generating electricity. The compressed air extracted is first preheated in the recuperator with recovered waste heat from the exhaust of the low-pressure turbine
21
before the waste heat is released to the atmosphere. The preheated air then passes into the combustion chambers where it is mixed with fuel (e.g. natural gas or methane) to be combusted. The high-temperature combustion product is expanded in the turbines to produce electricity (Chen et al., 2013; Elmegaard and Brix, 2011; Luo et al., 2014).
Currently, there are mainly two types of CAES system: the traditional CAES (also called diabatic CAES) and the adiabatic CAES (A-CAES). The traditional CAES is commercialised and has successfully been operated in the Huntorf CAES plant and the McIntosh CAES plant. Compared with the diabatic CAES system, the A-CAES (See Figure 1-17) can store the waste heat from the compression in the heat storage of charging process and re-use the waste heat to preheat the compressed air during the discharging process (Budt et al., 2016). A higher efficiency of up to 70% could be achieved and there is no longer any need to burn extra fuel (such as natural gas) to heat the compressed air. However, the A-CAES is still under research and not commercialised in the industry (ESA, 2017; Budt et al., 2016).
22
1.1.4 Historical development of the CAES technology
The elementary idea of using compressed air to store the electrical energy traces back to the early 1940s (Kalhammer and Schneider, 1976). However, the development of the CAES technology was not rigorously pursued by the scientific research community and the industry due to lack of necessity and feasibility of a grid network connecting to energy storage technologies. It was not concerned until the 1960s when CAES technology attracted great interest due to the geographical limitations of PHS. The Brown Boveri Company (BBC) proposed the concept of the gas turbine air storage peaking plant. The CAES technology was further mentioned and began to rise through the mid-1970s (Kalhammer and Schneider, 1976). The Huntorf CAES plant, as the first CAES plant in the world, was operated by the BBC company in Germany in 1978 (Crotogino et al., 2001). The details of this plant will be described in Section 2.3.1. With the successful operation of the Huntorf CAES plant and development of the CAES technology, the second generation A-CAES was investigated by Electric Power Research Institute (EPRI) (Budt et al., 2016). Moreover, the Pacific Northwest National Laboratory (PNNL) asserted that A-CAES would be the most suitable and promising technology for energy storage (Zaloudek and Reilly, 1982). Nonetheless, the A-CAES project was postponed due to the successful establishment of the first CAES plant (e.g. McIntosh diabatic CAES plant) in the USA.
The McIntosh CAES plant was operated by PowerSouth Electric Cooperative in 1991 (PowerSouth Electric Cooperative, 2017). The description of this plant and comparison between the Huntorf and McIntosh CAES plants will be summarised in Sections 2.3.2 and 2.3.3. The operation of the McIntosh CAES plant had attracted
23
much interest from several US companies, such as Hawaiian Electric Co. and Tennessee Vally Authority. However, neither of them attempted to construct a commercialized plant (Budt et al., 2016). In 2001, a Norton CAES project was planned for 2700 MWe (9×300 MWe) power output. However, this project has not been operated so far due to unfavourable low electricity prices. The Seneca CAES project was planned by NYSEG in the USA in 2012, but it was also cancelled because of economic conditions. The Apex Bethel Energy Centre planned a 317 MWe CAES project which started to be constructed in 2017 and expected to be operated in 2020 (Holloway, 2016; ApexCAES, 2017). A UK CAES project called ‘Project-CAES Larne’ was planned by Gaelectric Energy Storage (GES) in Northern Ireland in 2011. The rated power output of this project is 330 MWe (Budt
et al., 2016; Gaelectric, 2011). Details of this project will be described in Section 2.4.4.
Although many researches about the CAES technology are investigated, there is no more commercial CAES plant to be operated after the operation of the McIntosh CAES plant. Furthermore, the A-CAES technology is still under research. The EPRI only promotes the concepts of the CAES with few development efforts (Rice and Li, 2011). At present, the important features of the Huntorf and McIntosh CAES plants include black start capability and load shifting. Moreover, to overcome the intermittency problem of the renewable energy by integrating the CAES system with renewable energy can be another important driver for the development of the CAES technology. However, the CAES technology can be integrated with renewable energy sources was mentioned without being of importance. The CAES technology is now playing a more important role in overcoming the intermittency problem of
24
renewable energies (Lund and Salgi, 2009; Budt et al., 2016). In 2003, the European research on the project of A-CAES aimed to develop an A-CAES plant with the high round-trip efficiency of 70% but still has not been realised so far. The main concerns for the A-CAES system are the design of adiabatic compressors and materials of high-temperature TES (Budt et al., 2016; Luo et al., 2014). At the beginning of the 21st century, the research and development of the CAES technology have been spread to many aspects such as process design and optimisation, process integration and efficiency improvement.
1.1.5 Air compressor and its implementation in CAES system
The function of compressors of the CAES system is to provide sufficient air to store the compressed air in the cavern. The compressor can increase the pressure of the compressed air with the required mass flowrate and pressure for storage. The compressor is to supply bleed air for different purposes. The bleed air can be taken from any of the various pressure stages of compressors (AIRCAV, 2008). There are two main types of compressors implemented in the CAES plant, axial compressor and centrifugal compressor.
1.1.5.1 Axial compressor
The axial compressor (shown in Figure 1-18) includes two main components: a rotor and a stator. The air passes along the compressor through rows of rotating and stationary blades. The blades can convert the kinetic energy to pressure, and a balancing drum is built in order to offset the axial thrust (Arfalk, 2017). The advantages of the axial compressor include: high peak efficiency, small area of the front and high pressure ratio because of the increased number of stages with negligible losses. The drawbacks of axial compressor include the narrow rotational
25
speed range, complex structure, high cost and high starting power consumption (AIRCAV, 2008).
Figure 1-18. The schematic diagram of the axial compressor (Kala, 2011).
1.1.5.2 Centrifugal compressor
The centrifugal compressor (see Figure 1-19) comprises impeller (rotor), diffuser (stator) and casing.
Figure 1-19. The schematic diagram of the centrifugal compressor (mech4study, 2017).
26
The air enters the suction side of a rotating impeller with radial blades and is pushed toward the centre by centrifugal force. This radial movement of the air can lead to the rise of pressure and generate kinetic energy. Before the air enters the impeller, the kinetic energy can be also converted into pressure by the diffuser and volute (Arfalk, 2014; AIRCAV, 2008). The advantages of the centrifugal compressor include: high pressure ratio (per stage), wide rotational speed range, low cost and low starting power consumption. The disadvantages include: large area of the front and the impracticality of more than two stages due to non-ignorable losses between stages (AIRCAV, 2008).
1.1.5.3 Implementation of compressors in the CAES system
A combination of low-pressure axial compressors and high-pressure centrifugal compressors was used in the Huntorf CAES plant (Wang, et al., 2017; Riaz, 2010; Hoffeins, 1994). The pressure of the cavern of the CAES system can reach over 70 bar, so the multi-stage compressors need to be considered. The axial compressor implemented in the first stage of compression process is typically used in an application with the requirement of low differential pressure (head), high volume air flowrate and higher efficiency (around 85%) (EnggCyclopedia, 2012).
The wide range of pressure rise from 6 bar to over 70 bar after the first-stage compression mainly depends upon high rotational speed of impeller and its size. Nevertheless, the maximum allowable speed could be limited by strength of structural materials of impeller blades. This limitation on maximum achievable pressure rise can be overcome using high shaft speed centrifugal compressors, which can compress air to the required pressure using multi-stage centrifugal compressors operating in series (EnggCyclopedia, 2012).
27
1.1.6 Linking of wind electricity to the electricity grid
1.1.6.1 Wind turbine
A wind turbine is a device which can convert kinetic energy of wind into electrical energy. The main components of a wind turbine include: tower, rotor, blades, main shaft, gearbox system, yaw mechanism and generator (as shown in Figure 1-20) (Ragheb, 2014). The energy in the wind turns the blades around a rotor which is connected to the gearbox and the main shaft. The shaft can spin the generator to produce electricity (DOE, 2018).
Figure 1-20. The schematic diagram of a wind turbine (Ragheb, 2014).
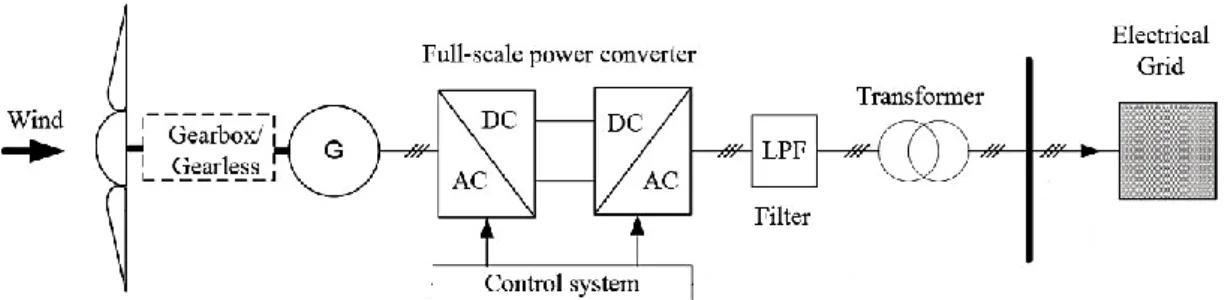
1.1.6.2 Wind turbines connected to the electricity grid
In Figure 1-21, the wind turbine converts wind energy into electrical energy. The electricity will be delivered to the electricity supply system. The output electricity
28
of the wind turbine to the supply system is transmitted to the different levels of voltage systems. The majority of wind turbines are connected to the medium-voltage grid (1-35kV), the large offshore wind farms will be connected to the high-voltage grid (more than 35kV) (DM Energy, 2011). The generator of a wind turbine produces AC electricity. The power converter can convert AC to direct current (DC) with a rectifier, then convert back to AC with an inverter. The purpose of converting AC to DC and then back to AC again is to match the frequency and phase of the electricity grid (DM Energy, 2011; DOE, 2018).
Figure 1-21. The schematic diagram of wind turbines connected to the grid (Kalyani et al., 2016).
1.2 Motivations for this study
1.2.1 Grid-scale capacity
At present, only PHS and CAES technologies can be applied in large or grid-scale (>100MW) application. The PHS technology is mature and has been implemented widely in many countries around the world. However, geographical constraints for the PHS technology requiring two large reservoirs at different elevations and also the environmental issues limit its commercial deployment (Chen et al., 2009; Kousksou et al., 2014; Denholm and Kulcinski, 2004; Denholm and Holloway,
29
2005). Thus, the CAES technology could become an attractive alternative for large or grid-scale energy storage applications.
1.2.2 Round-trip efficiency
With regards to waste heat from charging and discharging processes in the CAES system, the temperatures of inter-coolers (around 95 ˚C to 130˚C), after-cooler (around 130˚C) and exhaust from recuperator (around 121˚C) are high enough to be recovered for power generation using an organic Rankine cycle (ORC). CAES system integrated with ORC for waste heat recovery will also improve the round-trip efficiency of the CAES system. Therefore, the CAES system integrated with the ORC to recover waste heat from the charging and discharging processes of the CAES system is to be investigated and analysed through process simulation for improving system performance.
1.2.3 Use of renewable energy sources
Wind power as one of the major renewable energies is intermittent, whose output mainly depends on local environmental conditions and unpredictable weather. The CAES technology as one grid-scale energy storage technology can be an attractive and promising option to mitigate the intermittency problem of large-scale wind power generation to improve the stability and reliability of the grid. Figure 1-22 shows that CAES system can utilise excess off-peak wind electricity to store and discharging electricity during the period of high demand. For example, from 1 am to 4 am and from 6 am to 10 am, the external electricity demand is low, the excess off-peak electricity will drive air compression and the cavern pressure increases. From 11 am to 1 pm, the external electricity demand becomes higher, the stored air will be expanded to drive turbines for electricity generation.
30
Figure 1-22. Operation of the CAES system integrated with wind power within 24 hours (Crotogino et al., 2001).
One unique feature of a CAES system in the context of wind power is that it is difficult to maintain constant operating conditions for the CAES compression system due to fluctuating wind power output. Thus, the performance of a CAES system in the context of wind power at design and off-design conditions will be investigated and analysed through process simulation.
1.3 Aim and objectives of this research
The aim of this thesis is to study the approaches to improve the round-trip efficiency of CAES system, design and operation of the CAES system for wind power and cost reduction when implementing the CAES system. This study is performed through process modelling, simulation and analysis. To achieve the aim, the following objectives have been identified:
31
To provide a comprehensive review and critical assessment of previous researches on round-trip efficiency improvement, design and operation of the CAES system.
To develop and validate process models for the CAES system and ORC in Aspen Plus®:
Steady-state models for charging process of the CAES system
Steady-state models for discharging process of the CAES system
Steady-state model for ORC
To carry out process analysis of the CAES system integrated with ORC and to explore different factors which can influence round-trip efficiency of the CAES system.
To develop and validate improved models of the CAES system for wind power in Aspen Plus®:
Improved models for the compressors and turbines based on their charateristic curves.
Pseudo-dynamic model for the storage cavern of the CAES system
Improved model of the CAES system for wind power
To perform process analysis of the CAES system for wind power at design and off-design conditions involving the different modes: constant and variable shaft speed modes of the compressors.
To perform economic evaluations of different systems, consisting of the CAES system integrated with the ORC and the CAES system for wind power at design and off-design conditions.
32
1.4 Novel contributions
In a stand-alone CAES system, there is a large amount of low-grade waste heat from heat exchangers (e.g. intercooler, aftercooler and recuperator). ORC is a widely used technology for recovery of low-grade heat. On the other hand, most of the studies on process modelling and simulation of the CAES system in the context of wind electricity were for the system analysis at design condition. The off-design performance of the CAES systems for wind power is yet to be investigated. The novel contributions of this thesis include:
For the CAES system integrated with ORC
Steady-state models were developed and model validations were carried out for the CAES system and ORC respectively.
A new scheme for waste heat recovery using ORC technology was proposed for the CAES system.
Technical performance of the integrated system of the CAES system with ORC was evaluated through process simulation using the validated models.
Economic evaluation of the integrated system was carried out using Aspen Process Economic Analyser® (APEA).
For the CAES system in the context of wind power
Improved steady-state models were developed for compressors and turbines of the CAES system based on characteristic curves in Aspen Plus® and Fortran, a pseudo-dynamic model for the cavern was
33
Models for the CAES system in the context of wind power at design and off-design conditions were developed.
Different operation strategies for the CAES system integrated with wind power were proposed for different wind power output conditions.
Technical performance analysis of the CAES system in the context of wind power at design and off-design conditions was investigated, also two different modes (constant and variable shaft speed modes) at off-design conditions were evaluated.
Economic evaluation for the CAES system for wind power at design and off-design conditions was carried out using APEA.
1.5 Scope of this study
Figure 1-23. Overview of the scope of this thesis.
Figure 1-23 shows the scope of this thesis, the blue dashed line (- - - - -) is the boundary of this thesis. This thesis focuses on the CAES system. Firstly, it is the CAES system integrated with ORC to improve the round-trip efficiency of the CAES system. Secondly, it is the CAES system in the context of wind power to
34
curtail the intermittency problem of wind power. However, this thesis does not include model development of wind farm and components between the CAES system and wind turbines. This thesis also does not include the integrated system of the CAES system with ORC for wind power which will be mentioned in Section 7.2 for future research and the consideration of mechanical stress or integrity of the system (e.g.materials, control and monitoring).
1.6 Research methodology and software tools used in this study
1.6.1 Research methodology