wind farm connected by parallel diode-rectifier based HVDC and HVAC
links. IET Renewable Power Generation. ISSN 1752-1416 ,
http://dx.doi.org/10.1049/iet-rpg.2019.0033
This version is available at
https://strathprints.strath.ac.uk/67365/
Strathprints is designed to allow users to access the research output of the University of Strathclyde. Unless otherwise explicitly stated on the manuscript, Copyright © and Moral Rights for the papers on this site are retained by the individual authors and/or other copyright owners. Please check the manuscript for details of any other licences that may have been applied. You may not engage in further distribution of the material for any profitmaking activities or any commercial gain. You may freely distribute both the url (https://strathprints.strath.ac.uk/) and the content of this paper for research or private study, educational, or not-for-profit purposes without prior permission or charge.
Any correspondence concerning this service should be sent to the Strathprints administrator: [email protected]
The Strathprints institutional repository (https://strathprints.strath.ac.uk) is a digital archive of University of Strathclyde research outputs. It has been developed to disseminate open access research outputs, expose data about those outputs, and enable the
Institution of Engineering and Technology Copyright. The copy of record is available at IET Digital Library.
1
Hierarchical control of offshore wind farm connected by parallel diode-rectifier
based HVDC and HVAC links
Lujie Yu 1, Rui Li 1*, Lie Xu 1
1 Department of Electronic and Electrical Engineering, University of Strathclyde, G1 1XW, Glasgow, UK *[email protected]
Abstract: This paper investigates the operation of offshore wind farm connected by parallel diode-rectifier based HVDC
(DR-HVDC) and HVAC links. A secondary voltage control is proposed to control the offshore AC voltage amplitude by regulating the DC voltage of the DR-HVDC link. A secondary frequency control and a phase angle control are proposed to adjust the reactive power reference in the primary control, which synchronise the offshore point of common coupling (PCC) frequency and phase angle to those of the HVAC link. Such secondary voltage control, frequency control and phase angle control enable seamless transition from DR-HVDC mode to parallel mode. A tertiary power control scheme is further proposed to control the active power flow distribution between DR-HVDC and HVAC links through the regulation of PCC phase angle. To ensure smooth transition from HVAC mode to parallel mode, a virtual DC power control is proposed to control the virtual DC power at zero prior to the connection of the DR-HVDC link. A small-signal model of the parallel system is developed and the stability analysis is carried out for the proposed control scheme. Simulation results in PSCAD/EMTDC verify the proposed control under normal and fault conditions.
1. Introduction
Increased installation of large offshore wind power plants located far from onshore connection point requires reliable and efficient transmission technology. Recently, diode-rectifier based high voltage direct current (DR-HVDC) system, which uses offshore diode rectifier and onshore modular multilevel converter (MMC), has been proposed for offshore wind power transmission [1]-[4]. Compared with MMC based HVDC for offshore wind farm connection, DR-HVDC system can potentially lead to significant reductions of offshore converter volume, transmission losses and total cost [1]-[2].
However, unlike offshore MMCs, offshore diode rectifiers are unable to control the offshore frequency and voltage. Thus, WT converters have to behave as grid-forming converters to establish the offshore AC voltage and frequency. A voltage and frequency control of permanent magnet synchronous generator (PMSG) based wind turbines (WTs) is proposed for DR-HVDC system using low bandwidth communication in [3]-[4]. With the same control, the research is extended to efficiency analysis and fault-ride through analysis [5], operation with reduced filter banks [6] and integration of the diode-rectifier in HVDC grids [7]-[8]. The operation of doubly-fed-induction-generator based WTs connected with DR-HVDC is studied in [9] using a centralized active power control to change the offshore PCC voltage. In [10], a fixed-frequency control based on global positioning system (GPS) is proposed to provide a common angular reference for all the WTs, but reactive power sharing among the WTs is not addressed. A decentralized control is proposed in [11] which uses reactive power and frequency droop control to regulate the WT phase angle and achieve equal reactive power sharing. However, WT initial synchronization with the offshore network before de-blocking is not considered. A distributed phase-lock-loop (PLL) based WT control [12] is proposed with each WT controlled as an AC voltage source. The offline WTs can be easily synchronized to offshore AC network and WTs can provide offshore AC frequency control autonomously. The
fault performances including offshore symmetrical and asymmetrical faults, DC fault and diode-rectifier unit fault are analysed and relevant protection schemes are developed in [13]-[14].
Series connection of diode rectifier and VSC is proposed in [15] to transmit offshore wind power whereas in [16], umbilical AC cables are connected in parallel with DR-HVDC link during start-up, in order to energize the offshore network and diode rectifier. However, the umbilical AC cables are disconnected during normal operation, without making full use of the AC cables transmission capability. Parallel operation of DR-HVDC and existing HVAC links is also considered when testing the new DR-HVDC grid-connection solution, such that the DC link can be quickly disconnected in the event of malfunction without losing the entire power [17]. Two different operation modes are investigated under such scheme, i.e. DC mode when the wind farm is only connected with DR-HVDC link and AC mode when only connected with HVAC link. However, the transition between different operation modes is not clarified. In addition, the parallel operation when both DR-HVDC link and HVAC link are connected with the offshore network is not investigated. In [18], the operation switching from parallel mode to AC and DC mode is briefly discussed, but the transition from DC mode to parallel mode is not analysed.
This paper provides detailed investigation of parallel operation of DR-HVDC and HVAC links for connecting large offshore wind farms. The main contributions of the paper are summarized as follows
o To ensure seamless transition from DR-HVDC operation mode to parallel AC and DC operation mode, a secondary voltage control is proposed to control the offshore AC voltage amplitude by regulating the DC voltage of the DR-HVDC link, and a secondary synchronization control is proposed to synchronize the frequency and phase angle of the offshore AC network with those of the HVAC link. o A tertiary power control scheme is proposed to improve
the power flow distribution between DR-HVDC and HVAC links under parallel mode. By controlling the
Engineering and Technology Copyright. The copy of record is available at IET Digital Library.
2 active power through the HVAC and/or the HVDC links,
power sharing can be achieved.
o In the transition from HVAC mode to parallel mode, a virtual DC power control is proposed to avoid large transient current of the DR-HVDC link during its connection.
o A small-signal model of the parallel system is developed for analysing stability of the proposed control scheme.
The rest of this paper is organized as follows. The layout and control requirements of the parallel system are described in Section 2. In Section 3, the secondary voltage and synchronization control, tertiary power flow control and virtual DC power control are proposed. In Section 4, the small-signal model of the parallel system is developed and stability analysis is carried out for the proposed control scheme. Section 5 presents simulation results and finally Section 6 draws conclusions.
DR MMC DR-HVDC link 800MW Grid 2 WT Cluster1 50x8 MW WT Cluster2 50x8MW WT Cluster3 50x8MW
HVAC link 400 MW Grid 1
pcc pcc V dr
i
dr Q 1:Tdr B2 B2 B1 B1 dr
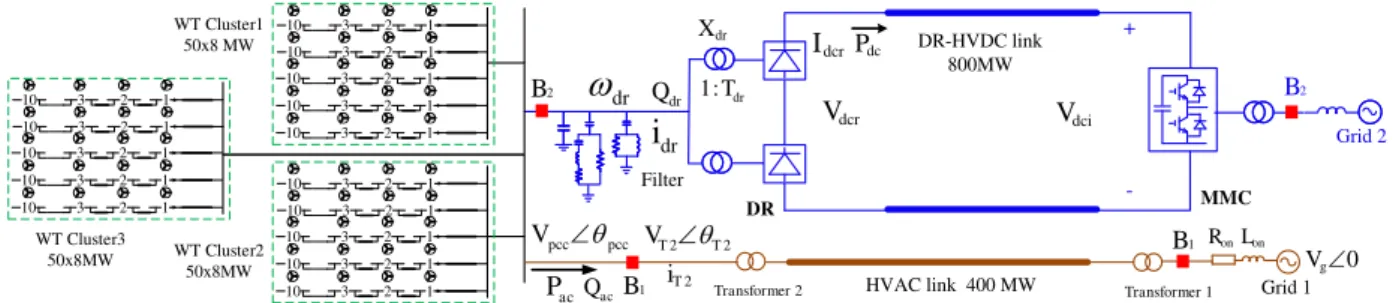
ac P + -2 2 T T V dr X 0 g V Filter dcr V Vdci dcr I on R Lon Transformer 1 Transformer 2 1 2 3 10 1 2 3 10 1 2 3 10 1 2 3 10 1 2 3 10 1 2 3 10 1 2 3 10 1 2 3 10 1 2 3 10 1 2 3 10 1 2 3 10 1 2 3 10 1 2 3 10 1 2 3 10 1 2 3 10 2 T i dc P ac QFig. 1.Diagram of the offshore wind farm connected with DR-HVDC and HVAC transmission system.
2. Parallel operation of the system 2.1. System structure
Fig.1 shows the layout of the system where the offshore wind farm is connected to both DR-HVDC and HVAC links. The wind farm considered here is rated at 1200 MW and has 3 clusters with each consisting of 50 PMSG based WTs. The power rating of each WT is 8 MW. The DR-HVDC link uses a 12-pulse diode rectifier offshore and a half-bridge submodule based MMC onshore, rated at 800 MW (two-third of the total wind power) and ±320 kV DC. Capacitors and low-frequency and high-frequency filter banks [19] rated at 240 MVAr are installed at the AC side of the diode rectifier for harmonic filtering and reactive power compensation. The HVAC link is rated at 150 kV and one-third (400MW) of the total wind power, which is connected with the wind farm via an offshore AC transformer. Two independent onshore AC grids are considered, one for the HVAC link and the other for the DR-HVDC link, similar to
the ‘Kriegers flak-combined grid solution’ project [20]-[21].
2.2. Operation mode
Depending on the connection of the transmission links, the system operation modes can be classified as:
o HVAC mode: Wind power is only transmitted through HVAC link while DR-HVDC link is disconnected from the offshore wind farm.
o DR-HVDC mode: Wind power is only transmitted through DR-HVDC link while HVAC link is disconnected from the offshore wind farm.
o Parallel mode: The offshore wind farm is connected to both DR-HVDC and HVAC links. Wind power can be transmitted through both links according to operation requirements.
2.3. Control requirements
To ensure efficient operation under different modes, the control requirements of the parallel system include: o Wind power generation according to WT operation
requirements under all operation modes.
o Establishing offshore voltage and frequency under DR-HVDC mode.
o Smooth transition from DR-HVDC mode to parallel mode.
o Smooth transition from HVAC mode to parallel mode. o Power flow control between DR-HVDC link and HVAC
link under parallel mode.
In order to meet the aforementioned operation requirements, a hierarchical control structure which includes primary, secondary and tertiary controls, is proposed in this paper. The primary control provides WT active power and reactive power control under all operation modes and maintains the offshore voltage and frequency on DR-HVDC mode. The secondary control regulates the offshore voltage magnitude, frequency and phase angle to achieve smooth transition from HVAC mode to parallel mode. The tertiary control adjusts the power flow between DR-HVDC link and HVAC link on parallel mode. The detailed function and control will be described in the following sections.
2.4. Primary control
The primary control is designed in each WT converter to provide plug and play capability without the use of communication. In addition to transmitting wind power and sharing reactive power among the WTs, this control level is also designed to provide decentralized offshore frequency and voltage control on DR-HVDC mode [3, 12]. In order to achieve smooth transition between different operation modes and to avoid primary control switching, the same WT converter primary control is used for all the operation modes.
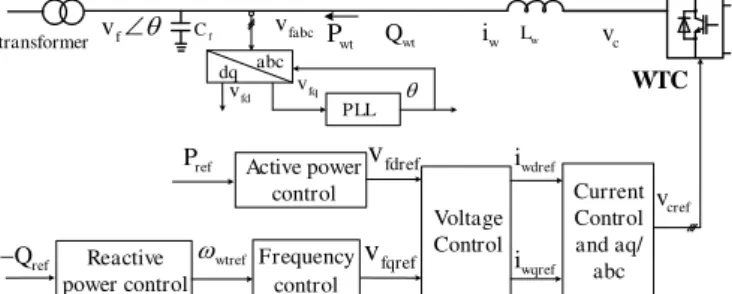
Assuming that WT generator-side converters control their DC voltages, Fig. 2 shows the primary control of WT line-side converters in the dq reference frame where the converter filter bus voltage vf is aligned with the d axis [12],
which includes:
o Current control to prevent the converters from overcurrent during fault conditions;
o Decentralized offshore AC voltage and frequency control to ensure large numbers of WTs work autonomously to provide AC voltage and frequency regulation, especially under DR-HVDC mode;
o WT active power control to ensure generated wind power is transmitted to the offshore network;
o WT reactive power control to ensure reactive power is shared among all the WT line-side converters.
Engineering and Technology Copyright. The copy of record is available at IET Digital Library. 3 PLL fq v dq abc fabc v w L f C transformer WTC f v fqref v Voltage Control Current Control and aq/ abc Frequency control wt P fd v Active power control ref P vfdref wt Q Reactive power control w i ref Q − wdref i wqref i c v cref v wtref
Fig. 2.Primary control of the offshore WT line-side converter.
3. Proposed secondary control and tertiary control
3.1. Voltage and frequency deviation caused by the primary control under DR-HVDC mode
Under DR-HVDC mode, the relationship between the offshore AC voltage Vpcc, the DC current Idcr and offshore DC
voltage Vdcr is expressed as [12] 3 2.7 1.35 dcr dr dcr pcc dr dr V X I V T T = + (1) where Xdr and Tdr are the reactance and turn ratio of the DR
transformer respectively. The offshore DC voltage Vdcr and
current Idcr are expressed as
,
dcr dct dcr dci dcr wtt dcr
V =R I +V I =P V
(2)
where Pwtt, Vdci and Rdct are the total transmitted wind power,
onshore DC voltage and total DC resistance, respectively. Combining (1) and (2), the offshore PCC voltage is rewritten as
(
6)
2 4 2.7 5.4 dct dr dci dci dct wtt dci pcc dr dr dct R X V V R P V V T T R + − + + = +.
(3)As can be seen, the minimum offshore PCC voltage when the DR starts conducting is Vdci/2.7Tdr, and Vpcc
increases when the transmitted wind power Pwtt increases.
Reactive power consumption Qdr of the DR is
expressed as
( ) ( ) 2 sin 2 2 , arccos 1 1 cos 2 dr dcr dr wtt dr pcc X I Q P T V − = = − − (4)
Thus, the reactive power consumption of the DR varies with the generated wind power. In order to balance the reactive power in the offshore network, Q-f droop control in the WT primary control is adopted to regulate WT reactive power output [12]-[13]. As a result, the offshore frequency also deviates slightly from the rated value during wind power variation under DR-HVDC mode [3]-[8].
3.2. Proposed secondary offshore voltage, frequency and phase angle control
During the transition from DR-HVDC mode to parallel mode, it is important to ensure the matching of the voltage magnitude, frequency and phase angle between the offshore PCC voltage Vpccpcc and HVAC link voltage
2 2
T T
V , before connecting the two AC networks together. A. Voltage matching
As described in (3), the offshore PCC voltage Vpcc
under DR-HVDC mode is dependent on the generated active power Pwtt and onshore MMC DC voltage Vdci. However, the
active power Pwtt varies according to wind speed. Thus, in
order for the offshore PCC voltage magnitude Vpcc to match
that of the HVDC link prior to switching to parallel mode (i.e.
connecting the HVAC cables to the offshore wind farm), the onshore MMC DC voltage Vdci is adjusted. The proposed
secondary offshore voltage control is shown in Fig. 3, where VT2 is the voltage amplitude of the HVAC link and Vdci0 is the
rated onshore MMC DC voltage. kvp and kvi are the control
parameters of the secondary offshore voltage control. The generated onshore DC voltage reference Vdciref is then sent to
the onshore MMC by low bandwidth communication to adjust the DC voltage accordingly.
B. Frequency matching
Due to the use of Q-f droop control, expressed as , in the WT primary control [12]-[14], the reactive power reference Qref in the
primary control is adjusted to regulate the offshore frequency as shown in Fig. 3, where kfp and kfi are the control parameters
of the secondary frequency control, is the offshore PCC frequency and is the desired offshore frequency equalling to the HVAC link frequency. When pcc< ref, the
secondary frequency control produces a reduced Qref in the
centralized controller, which is then sent to all the WT converters by low bandwidth communication. Consequently, the Q-f droop control in the WT primary control leads to the increase of each WT generated frequency. As a result, offshore PCC frequency pcc is also increased until becoming
identical to the reference ( pcc= ref). Similarly, when pcc> ref, offshore PCC frequency is decreased to the
reference by the combined functions of secondary frequency control and Q-f droop control in the primary control.
+ _
++
Secondary voltage control
+ _ -+ 0 dci
V
dcirefV
+ _Phase angle control
ref
Secondary frequency control
pcc
syn
fi fp k k s + syni synp k k s + pcc 2 T 0 Q ref Q pccV
2 TV
vi vp k k s + Fig. 2 ac P + -dci V v sTe
− d sTe
− dc P Fig. 2 PCC pcc pcc V 2 2 T T V +Fig. 3Proposed secondary control of WT converters.
C. Phase matching
A phase angle control is proposed in this paper by adding an adjustment term to the frequency reference in the secondary offshore frequency control block as shown in Fig. 3
,
where ksynp and ksyni are the control parameters of theactive synchronization control, and are the voltage phase angles at the HVAC link and offshore PCC. As seen, when , the phase angle control produces a positive , leading to the increase of offshore PCC frequency . Consequently, is also increased until becoming identical to the reference ( ). Similarly, when , offshore PCC phase angle is decreased until .
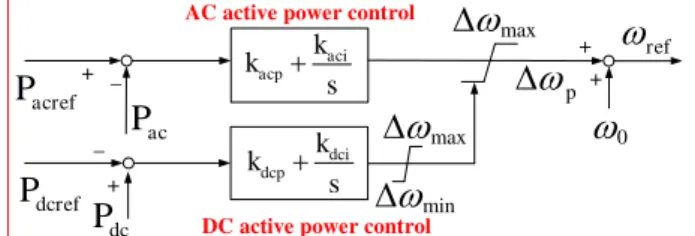
3.3. Proposed Tertiary Power Flow Control
For the parallel transmission system, one particular challenge is power flow distribution between the two links.
Engineering and Technology Copyright. The copy of record is available at IET Digital Library.
4 In [22], a phase-angle based active power control is
implemented in offshore MMC to control power flow when an MMC-HVDC link operates in parallel with an HVAC link. In case of DR-HVDC, the DR is unable to control power flow and thus, power flow control is designed as a tertiary control in the WT centralized controller to actively adjust the phase angle difference between the offshore and onshore AC voltages connected by the HVAC link.
As illustrated in Fig. 4, the tertiary power flow control can operate on either AC active power control or DC active power control. Pacref and Pac are the reference and measured
HVAC link active power, Pdcref and Pdc are the reference and
measured HVDC link active power, respectively, is the rated offshore frequency. In order to achieve smooth transition between AC active power control and DC active power control, the output of DC active power control is used as the lower limit of the AC active power control mode.
+ _ +
ref
AC active power control
+ _
DC active power control
p
dcrefP
dcP
acP
aci acp k k s + acrefP
dci dcp k k s +
max min
0
+ max
Fig. 4Proposed AC active power control and DC active
power control.
A. AC active power control under parallel mode Under low wind conditions when the total generated wind power Pwtt is smaller than the rated power of the
DR-HVDC link Pdcref, DC power control saturates (its output
during saturation is ) and the tertiary control works on AC power control mode. Thus, through the regulation of the offshore PCC phase angle, the HVAC link power is controlled to follow its reference Pacref at 0 while all the wind
power is transmitted through the DR-HVDC link. When the generated wind power changes, the controller keeps the offshore PCC phase angle largely unchanged while the offshore PCC voltage magnitude changes automatically to adjust the DR-HVDC active power transmission. If required, the Pacref can also be set at a desired value to ensure certain
power sharing between the AC and DC links.
B. DC active power control under parallel mode Under high wind conditions, when the generated power Pwtt exceeds the capacity of the DR-HVDC link Pdcref,
DC power control starts to de-saturate and the corresponding output starts to increase. As a result, AC power control saturates while the power flow between the two links is regulated by the DC active power control with reference Pdcref
at rated value to avoid any overload of DR-HVDC link. When the generated wind power changes, the controller regulates the offshore PCC phase angle to ensure that the surplus wind energy is transmitted through the HVAC link.
C. Proposed virtual DC power control during the
transition from HVAC mode to parallel mode For smooth transition from HVAC mode to parallel mode, active power transmitted through DR-HVDC link should remain largely unchanged before and immediately after the mode change so as to minimise any transients to the offshore networks. During HVAC mode operation, the DR-HVDC link is disconnected and does not transmit any power. Therefore, to ensure smooth transition, DR-HVDC active
power should remain at 0 immediately after connecting the DR-HVDC link, i.e. switching from HVAC mode to parallel mode.
According to (1) and (2), the transmitted active power through DR-HVDC link Pdc after the connection of
DR-HVDC link is
(
)
2 6 2.7 2.7 6 ( ) dr pcc dct dr dci dr pcc dci dc dct dr T V R X V T V V P R X + − = + . (5)To ensure DC power remains at 0 after the mode transition, the "virtual DC power" concept is proposed, which considers a virtual DR-HVDC link is connected with the offshore network under HVAC mode. Thus, the virtual DC power can also be described by (5), which resembles the DR-HVDC transmitted power when the DC link is switched in. A virtual DC power control can then be designed, similar to the one in the tertiary control shown in Fig. 4, with its power reference at 0 and feedback from the virtual DC power calculated by (5). Through the adjustment of the offshore network frequency and WT reactive power output, the PCC voltage is regulated to ensure the virtual DC power as calculated by (5) is 0. That means the DC power after the mode transition will also remain at 0, ensuring a smooth mode transition.
4. Stability analysis of the system
In order to analyse the stability of the hierarchical control for the parallel system, a small-signal model is established and eigenvalues are derive to identify the impact of control parameters on the critical modes.
4.1. Small-signal modelling of the system
The DR-HVDC link modelling is divided into three parts: DR, DR filter and DC cables. Three filter banks are considered, as shown in Fig. 1, i.e. reactive power compensation, low-pass filter and high-pass filter [3]. The onshore MMC is simplified as a controllable DC source [23]-[24].
The diode rectifier in dq reference frame is represented as [25]
(
)
(
)
(
)
( ) ( )(
)
0.5 2 2 2 2 6 3 6 1.5 tan 1.5 2 sin 2 tan 1 cos 2 2 arccos 1 3 dr pccd pccq dr dr dcr dcr dr dcr dcr pccd drd pccq drq dr dcr dcr pccd drq pccq drd dr dr dcr dr pccd pccq T v v L I V P V I v i v i Q V I v i v i L I T v v + − = = = + = = − + − = − = − + . (6)where is the offshore PCC frequency, vpccd and vpccq are
the d- and q-axis components of offshore PCC voltage vpcc.
The modelling of filter banks, HVDC cables and HVAC link is presented in the Appendix.
The dynamics of the DR-HVDC link and HVAC link described above are based on their own rotating dq references, as shown in Fig. 5. In order to analyse the parallel operation when the two links are connected to the PCC, it is necessary to transform the individual rotating reference to a same
Engineering and Technology Copyright. The copy of record is available at IET Digital Library.
5 reference for stability analysis. In this paper, the rotating
reference of the diode-rectifier dDRqDR is chosen as the
common rotating reference.
AC
d
DRd
DRq
ACq
Fig. 5Diagram of dq rotating reference for DR-HVDC link
and HVAC link.
Fig. 5 shows the phase angle difference of the dq rotating references between the two links. The current of HVAC link transformer 2 in dACqAC reference frame is
transformed to that based on dDRqDR reference ,
which can be expressed as
2 _ 2 2 2 _ 2 2 cos sin cos sin T AC DRd T d T q T AC DRq T q T d i i i i i i = − = + . (7)
On the other hand, the offshore PCC voltage vpcc in
dDRqDR reference frame needs to be converted to dACqAC
reference using the reversed transformation as
_ _ cos sin sin cos pccDR ACd pccd pccq pccDR ACq pccd pccq v v v v v v = + = − + . (8)
The offshore wind farm consists of WT converters, transformers and AC cables. The corresponding modelling is derived using the methods presented in [26] and is not detailed in this paper. By linearizing the system at an operating point, the state space model of the parallel system is obtained. The delay e-sT is linearized using a third-order
Pade-approximation to obtain a rational linear result [27]. Fig. 6 shows the complete small-signal model of WT converters connected with DR-HVDC link and HVAC link.
DR-HVDC link dq1 dq2 WT 1 HVAC link WT 2 WT 3 Primary Control Secondary Control dq1 dq_DR Tertiary Control dq2 dq3 dq_AC dq_DR dq2 dq_DR dq3 dq_DR dq3 dq_DR dq_AC dq_DR + + + + + + ref Q Primary Control Primary Control 1 dq i 2 dq i 3 dq i pccdq v 2 T i
Fig. 6 Complete small-signal model of WT converters
connected with DR-HVDC link and HVAC link.
4.2. Validation of the small-signal model
In order to validate the small-signal model, time domain performances of the small-signal model in MATLAB are compared with the simulation results in PSCAD/EMTDC under different operation modes. The system parameters are shown in Table I.
Table I Parameters of the tested parallel operation system
Components Parameters Values
DR-HVDC link Power 800 MW DC voltage ±320 kV DR transformer (Y/Y/∆) Leakage inductance 66/260/260 kV, 0.18 pu Reactive power compensation 0.2 pu
HVAC link Power 400 MW
HVAC cable length 7×5 km Rating of aggregate WTC 400 MW×3 Transformer (Y/∆)
Leakage inductance
0.69/66 kV 0.08 pu
WTC WT Filter capacitor Cf 0.1pu Converter reactance Lw 0.1 pu AC cable length (for each
aggregate WT converter)
5 km, 10 km, 15 km
Fig. 7 (a) compares the responses from the two models under DR-HVDC mode with the phase angle control enabled and the phase angle order increased by 0.05 rad at 0.2s (operating point: WT 1, 2 and 3 generate 100, 200 and 400 MW respectively). Under the same WT operating condition, the response under parallel mode with AC active power control when the power order changed from 0 to 1 MW at 0.2 s is compared in Fig. 7(b). As can be seen, the performances of the small-signal model are in good agreements with the results of PSCAD/EMTDC simulation.
t/s
(a) Angle (ra
d/s)
(b) Power (MW)
Fig. 7.Comparisons between the small-signal model (red-dot
curve) and PSCAD model (blue-solid curve) under different operation modes
(a) Angle order change on DR-HVDC mode, (b) AC power
order change on parallel operation mode.
4.3. Stability analysis of the proposed control scheme
This sub-section describes the stability analysis of the secondary control and tertiary power flow control.
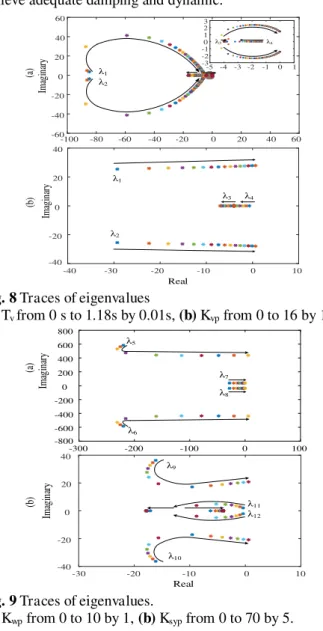
The eigenvalues are derived when the secondary voltage control is enabled. Fig. 8 (a) shows the trace of the dominant eigenvalues when the communication delay Tv
increased from 0 s to 1.18 s. As seen, 1,2 (-84.9 ± 3.6i) are
shifted towards the right plane and eventually become
evanescent modes, whereas 3,4 (-1.27, -4) become
conjugated roots. When Tv increases to 1.18 s, the real parts of 3,4 become positive, resulting in potential system
instability. Considering both system stability and practical implementation, communication delay Tv is chosen as 0.08s
in this paper.
Fig. 8 (b) shows the root-loci of the closed-loop system by varying the secondary voltage control parameter Kvp from 0 to 16 (Kvp/ Kvikeeps constant at 0.1). 3,4 move
towards the left side, whereas 1,2 become less damped and
eventually move to the right plane at kvp =16. In this paper,
kvp= 2 is chosen for a balance of stability and response time.
Similar studies are conducted for the secondary frequency control and phase angle control, as shown in Figs. 9 (a) and (b), respectively. Kwp and Ksyp are chosen as 3 and
20 respectively to achieve satisfactory response.
Fig. 10 (a) shows the movements of the dominant eigenvalues when AC power control parameter Kacp increased
from 0 to 0.13. 15,16 are shifted towards more stable region
while 13,14 become less damped. When Kacp > 0.13, the real
part of 13,14 turns to positive, resulting in potential system
instability. Fig. 10 (b) shows the trace of the eigenvalues when DC power control parameter Kdcp varies. The system
Engineering and Technology Copyright. The copy of record is available at IET Digital Library.
6 can remain stable until Kdcp is larger than 0.1. Based on the
analysis, Kacp and Kdcp are both chosen as 0.05 in this study to
achieve adequate damping and dynamic.
1 2 -100 -80 -60 -40 -20 0 20 40 60 -60 -40 -20 0 20 40 60 -5 -4 -3 -2 -1 0 1 -3 -2 -10 1 2 3 3 4 -40 -30 -20 -10 0 10 -40 -20 0 20 40 1 2 3 4 (a ) (b ) Real Ima gi na ry Ima gi na ry
Fig. 8Traces of eigenvalues
(a) Tv from 0 s to 1.18s by 0.01s, (b) Kvp from 0 to 16 by 1
-300 -200 -100 0 100 -800 -600 -400 -200 0 200 400 600 800 7 8 5 6 -30 -20 -10 0 10 -40 -20 0 20 40 9 10 11 12 (a ) (b ) Real Ima gi na ry Ima gi na ry
Fig. 9Traces of eigenvalues.
(a) Kwp from 0 to 10 by 1, (b) Ksyp from 0 to 70 by 5.
-30 -20 -10 0 10 -60 -40 -20 0 20 40 60 13 14 15 16 (a ) (b ) Real Ima gi na ry Ima gi na ry -30 -20 -10 0 10 -60 -40 -20 0 20 40 60 17 18 19 20
Fig. 10Traces of eigenvalues
(a) Kacp from 0 to 0.13 by 0.01, (b) Kdcp from 0 to 0.1 by 0.01.
5. Simulation results
In order to verify the operation of offshore wind farm under different operation modes, the system shown in Fig. 1
and Table I is established in PSCAD/EMTDC. The wind farm is modelled as three aggregate 400 MW WT line-side converters.
5.1. Transition from DR-HVDC mode to parallel mode
Fig. 11 shows the performances during the transition from DR-HVDC mode to parallel mode.
At the beginning, the generated active power of WT 1, 2 and 3 is 100 MW, 150 MW and 400 MW respectively under the DR-HVDC mode, as shown in Fig. 11 (a). The reactive power is well shared among the WTs at 6 MVAr each (positive Qwt defined as WTs providing capacitive reactive
power to the offshore AC network), as shown in Fig. 11 (b). At 5 s, the proposed secondary voltage control is enabled. The onshore MMC DC voltage Vdci is regulated from
1 pu to 0.978 pu and the offshore PCC voltage Vpcc is
decreased from 0.983 pu to 0.965 pu to match the HVAC link voltage VT2, as shown in Figs. 11 (d) and (c).
At 10 s, the proposed secondary frequency control is initialized. The offshore frequency is decreased from 50.2 Hz to match the HVAC link frequency of 50 Hz, as shown in Fig. 11 (e). Consequently, the phase angle difference ( ) between the offshore PCC voltage and HVAC link voltage keeps stable at 1.51 rad., as shown in Fig. 11 (f).
At 20 s, the phase angle synchronization control is enabled. The phase angle difference ( ) between the offshore PCC voltage and HVAC link starts to decrease from 1.51 rad. to 0 rad., as shown in Fig. 11 (f). For illustration, Figs. 11 (h) and (i) show the instantaneous voltages of the offshore PCC and HVAC link before and after phase synchronization. As seen, after the phase synchronization, the two waveforms become closely matched.
At 30 s, the AC breaker of the HVAC link B1 (shown
in Fig. 1) is closed to connect the HVAC link with the offshore wind farm. No inrush current is observed and smooth transition from DR-HVDC mode to parallel mode is achieved, as shown in Fig. 11 (i). Meanwhile, the proposed tertiary power flow control is enabled to control the HVAC link active power at 0. As a result, all the wind power is still transmitted through the DR-HVDC link with the HVAC link power at 0, as illustrated in Fig. 11 (g).
At 32 s, the secondary offshore PCC voltage control is disabled to restore the onshore MMC DC voltage to 1 pu, as seen in Fig. 11 (d). The PCC voltage also increases, resulting the increase of HVAC link reactive power Qac from 0 MVAr
to 31 MVAr and so as the reactive power provided by the 3 WTs.
WT 2 ramps its active power from 150 MW to 300 MW from 35 s to 40 s as shown in Fig. 11 (a). With active power transmitted by the DR-HVDC link increased to rated value of 800 MW, the proposed tertiary control is automatically switched from AC active power control to DC active power control.
From 45 s to 50 s, both WT 2 and 3 increase their generated wind power to rated value of 400 MW, as shown in Fig. 11 (a). Fig. 11 (g) shows the DR-HVDC link transmitted active power is controlled at 800 MW while additional 400 MW active power is transmitted through the HVAC link due to the tertiary DC active power control.
Engineering and Technology Copyright. The copy of record is available at IET Digital Library. 7 0 10 20 30 40 50 60 -400 0 400 800 1200 0 10 20 30 40 50 60 0.94 0.96 0.98 1 1.020 10 20 30 40 50 60 0 25 50 75 100 0 10 20 30 40 50 60 0 100 200 300 400 500 (a )P (MW ) (c )V (pu) (b) Q (MVA r) Pwt1 Pwt2 Pwt3 Qwt1 Qwt2 Qwt3 Pac Pdc Vac Vpcc (d) V (pu) 0 10 20 30 40 50 60 0.9 0.951 1.05 1.1 0 10 20 30 40 50 60 49 49.5 50 50.5 51 (e )f (pu) (g) P (MW ) 29.9 29.95 30 30.05 30.1 -2 -10 1 2 (h) v( pu) (i) v(pu) 19.8 19.85 19.9 19.95 20 -2 -10 1 2 vac vpcc vac vpcc Vdci 0 10 20 30 40 50 60 (f )a ngle (r ad.) 23 -0 t/s
Fig. 11. Simulation results from DR-HVDC mode to parallel
mode
(a) WTs active power, (b) WTs reactive power, (c) voltage of
offshore PCC and HVAC link, (d) onshore MMC DC voltage, (e) offshore frequency, (f) phase angle difference between
offshore PCC and HVAC link, (g) transmitted active power of DR-HVDC and HVAC, (h) voltages of offshore PCC and
HVAC link before synchronization, (i) voltages of offshore
PCC and HVAC link after synchronization.
5.2. Transition from HVAC mode to parallel mode
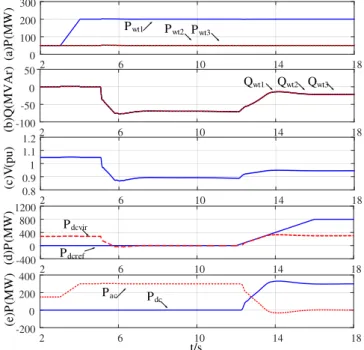
The performances of the system during the transition from HVAC mode to parallel mode are illustrated in Fig. 12. Initially, WT 1, 2 and 3 generate 50 MW respectively on HVAC mode while reactive power of each WT converter is controlled at 0, as shown in Figs. 12 (a) and (b). From 3 s to 4 s, WT 1 ramps its power from 50 MW to 200 MW, while WT 2 and 3 active powers remain at 50 MW. Consequently, HVAC transmitted active power is increased from 150 MW to 300 MW as shown in Fig. 12 (e). These results indicate the primary control can well operate under HVAC mode.
2 6 10 14 18 -200 0 200 400 2 6 10 14 18 -100 -50 0 502 6 10 14 18 0 100 200 300 (a )P (MW ) (b) Q (MV A r) (d) P (MW ) (e) P (MW ) Pwt1 Pwt2 Pwt3 Qwt1 Qwt2 Qwt3 Pac Pdc 2 6 10 14 18 -400 0 400 800 1200 Pdcref Pdcvir 2 6 10 14 18 0.8 0.9 1 1.1 1.2 (c )V (pu) t/s
Fig. 12. Simulation results from HVAC mode to parallel
mode
(a) WTs active power, (b) WTs reactive power, (c) offshore
PCC voltage, (d) virtual power and power reference of
DR-HVDC link, (e) active power of DR-HVDC link and HVAC
link.
At 5 s, the proposed virtual DC power control is enabled with Pdccref at 0 pu. Figs. 12 (c) and (d) show the
offshore PCC decreases from 1.046 pu to 0.89 pu and the virtual DC power is decreased from 280 MW to 0 MW, respectively. Meanwhile WTs start to absorb 66 MVAr reactive power, as shown in Fig. 12 (b).
At 8 s, DR-HVDC link is connected to the offshore wind farm. As shown in Fig. 12 (e), smooth transition from HVAC mode to parallel mode is achieved. At 10 s, the virtual DC power control is switched to real DC power control. From 12 s - 16 s, DC power reference is increased from 0 MW to 800 MW, as shown in Fig. 12 (d). With the increase of DC power reference, the DC power control saturates meanwhile AC power control starts to de-saturate. As seen in Fig. 12 (e), HVAC link transmitted power is thus decreased to 0 while all wind power is transmitted to onshore grid through the DR-HVDC link.
5.3. Parallel mode to DR-HVDC mode due to AC fault
The performances of the system during the transition from parallel mode to DR-HVDC mode due to AC permanent fault are illustrated in Fig. 13. Initially, WT 1, 2 and 3 generate 100, 200, 300 MW respectively on parallel mode while reactive power of each WT converter is controlled at 0, as shown in Fig. 13 (d) and (e).
At 5 s, a solid three-phase fault occurs at the middle of the HVAC link. As shown in Figs. 13 (a) and (b), voltages at the fault location vacf and offshore PCC vpcc rapidly decrease
to 0 and 0.3 pu respectively after the fault. The reduction of the offshore AC voltage leads the WT converters to decrease their active powers to around 0, as shown in Fig. 13 (d). Due to reduced offshore PCC voltage, diode-rectifier is automatically reverse-biased and no power can be transmitted through DR-HVDC link, as shown in Fig. 13 (f). Meanwhile, each WT converter operates under current-limit mode, controlling the fault current at 1.2 pu assuming 20%
Engineering and Technology Copyright. The copy of record is available at IET Digital Library.
8 overcurrent capability as seen in Fig. 13 (c). Fig.13 (e) shows
that each WT converter reactive power output increases from 1 MVAr to 210 MVAr to achieve the offshore network reactive power re-balance.
At 5.15 s, the AC breaker B1 (shown in Fig. 1) is
opened to isolate the faulty HVAC link. As seen from the Fig. 13 (d) and (f), the wind power generation and DR-HVDC link transmission are quickly restored.
(d) P (MW ) (a )v (pu) (e )Q (MV A r) (b) v( pu) (f )P (MW ) 4.8 5 5.2 5.4 5.6 -200 0 200 400 600 4.8 5 5.2 5.4 5.6 -400 -200 0 200 400 4.8 5 5.2 5.4 5.6 -2 -1 0 1 2 4.8 5 5.2 5.4 5.6 -2 -1 0 1 2 4.8 5 5.2 5.4 5.6 -400 0 400 800 1200 (c )i (pu) 4.8 5 5.2 5.4 5.6 -2 -1 0 1 2 Pwt1 Pwt3 Pwt2 Qwt1 Qwt2 Qwt3 Pac Pdc vacf vpcc iw t/s
Fig. 13. Simulation results from parallel operation to
DR-HVDC operation mode due to HVAC link fault
(a) HVAC link AC voltage, (b) offshore PCC voltage, (c) WT
current, (d) WTs active power, (e) WTs reactive power, (f)
active power of DR-HVDC link and HVAC link.
5.4. Parallel mode to HVAC mode due to DC fault
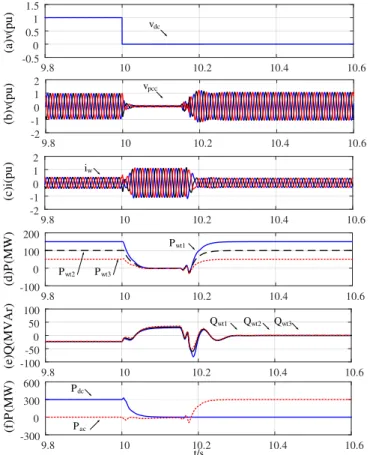
The performances of the system during the transition from parallel mode to HVAC mode due to DC permanent fault are illustrated in Fig. 14. Initially, WT 1, 2 and 3 generate 50, 100, 150 MW respectively on parallel mode while reactive power of each WT converter is controlled at -20 MVAr, as shown in Figs. 14 (d) and (e).
At 10 s, a solid DC fault occurs at the DR-HVDC link. Figs. 14 (a) and (b) show the DR-HVDC link DC voltage rapidly decreases to 0 pu after the fault and offshore PCC voltage drops to around 0.05 pu. During the fault, the WT fault current is well controlled at 1.2 pu as shown in Fig. 14 (c). Meanwhile, each WT converter increases its reactive power output from -20 MVAr to around 30 MVAr to achieve the offshore network reactive power re-balance, as seen in Fig. 14 (e). Both the transmitted DC power and AC power reduce to 0 MW, as shown in Fig. 14 (f).
At 10.15 s, the AC breaker B2 (shown in Fig. 1) opens
to isolate the DR-HVDC link from the offshore network. As seen from the Fig. 6 (d) and (f), the wind power is quickly restored and transmitted through the HVAC link.
9.8 10 10.2 10.4 10.6 -100 0 100 200 9.8 10 10.2 10.4 10.6 -300 0 300 6009.8 10 10.2 10.4 10.6 -100 -50 0 50 100 9.8 10 10.2 10.4 10.6 -2 -1 0 1 2 9.8 10 10.2 10.4 10.6 -2 -1 0 1 2 (d) P (MW ) (a )v (pu) (e )Q (MV A r) (b) v( pu) (f )P (MW ) (c) i(pu) 9.8 10 10.2 10.4 10.6 -0.5 0 0.5 1 1.5 vdc vpcc iw Pwt1 Pwt3 Qwt1 Qwt2 Qwt3 Pac Pdc t/s Pwt2
Fig. 14.Simulation results from parallel operation to HVAC
operation mode due to DR-HVDC link DC fault
(a) DC voltage, (b) offshore PCC voltage, (c) WT current, (d)
WTs active power, (e) WTs reactive power, (f) active power
of DR-HVDC link and HVAC link.
6. Conclusion
A hierarchical control of WT line-side converters, including primary control, secondary voltage, frequency, phase angle control and tertiary active power flow control, is proposed to achieve smooth operation mode switch between DR-HVDC mode, parallel mode and HVAC mode when offshore wind farm is connected to parallel DR-HVDC and HVAC links. The proposed secondary voltage control, frequency control and phase angle control enable seamless transition from DR-HVDC mode to parallel mode. The tertiary control regulates the power flow between DR-HVDC link and HVAC link through the modification of PCC phase angle, ensuring the required power sharing during parallel mode. The proposed virtual DC power control regulates the virtual DC power at 0 by adjusting the offshore PCC voltage magnitude, enabling seamless switch from HVAC mode to parallel mode. Small-signal stability analysis is carried out to design the secondary, tertiary control parameters and investigate the effect of communication delay on system performance for the centralized controller. Simulation results verify the proposed control strategy during the transition among various operation modes.
7. Acknowledgments
This work was supported by the European Union’s
Horizon 2020 research and innovation programme under Grant 691714.
Engineering and Technology Copyright. The copy of record is available at IET Digital Library.
9
8. Reference
[1] Seman, S., Zurowski, R., Christ, T.: 'Investigation of DC Converter Nonlinear Interaction with Offshore Wind Power Park System'. EWEA Offshore Conference, Copenhagen, Denmark, Mar, 2015, pp. 1–6
[2] Menke, P.: 'Major breakthrough in DC grid access for large scale offshore wind farms'. EWEA Offshore Conference, Copenhagen, Denmark, Mar 2015, pp. 1–6 [3] Blasco-Gimenez, R., Ano-Villalba, S.,
Rodriguez-D'Derlee J., et al.:'Distributed Voltage and Frequency Control of Offshore Wind Farms Connected With a Diode-Based HVdc Link', IEEE Trans. Power Electron., 2010, 25, (12) pp. 3095-3105
[4] Blasco-Gimenez, R., Ano-Villalba, S., Rodriguez-D'Derlee J., et al.:'Diode-Based HVdc Link for the Connection of Large Offshore Wind Farms', IEEE Trans. Energy Convers., 2011, 26, (2), pp. 615-626
[5] Bernal-Perez, S., Ano-Villalba, S., Blasco-Gimenez, R., et al. : 'Efficiency and Fault Ride-Through Performance of a Diode-Rectifier- and VSC-Inverter-Based HVDC Link for Offshore Wind Farms', IEEE Trans. Ind. Electron., 2013, 60, (6), pp. 2401-2409
[6] Blasco-Gimenez, R., Aparicio, N., Ano-Villalba, S., et al.:'LCC-HVDC Connection of Offshore Wind Farms With Reduced Filter Banks', IEEE Trans. Ind. Electron., 2013, 60, (6), pp. 2372-2380
[7] Bernal-Perez, S., Ano-Villalba, S., Blasco-Gimenez, R., et al. :'Connection of off-shore wind power plants to VSC-MTdc networks using HVdc diode-rectifiers', 2013 IEEE International Symposium on Industrial Electronics, Taipei, May 2013, pp. 1-6
[8] Bernal-Perez, S., Ano-Villalba, S., Blasco-Gimenez, R., et al. :'Wind power plant control for the connection to multiterminal HVdc links', 2012 IEEE Energy Conversion Congress and Exposition (ECCE), Raleigh, US, Sep, 2012, pp. 2873-2879
[9] Vidal-Albalate, R., Peña, R., Belenguer, E., et al.: 'Simultaneous connection of type-3 and type-4 off-shore wind farms to hvdc diode rectifier units'. Proceedings of the 15th Wind Integration Workshop, Vienna, Australia, Nov, 2016, pp. 1–6
[10] Prignitz, C., Eckel, H. G., Achenbach, S., et al.: 'FixReF: A control strategy for offshore wind farms with different WTtypes and diode rectifier HVDC transmission'. 2016 IEEE 7th International Symposium on Power Electronics for Distributed Generation Systems (PEDG), Vancouver, Canada, Jun 2016, pp. 1-7
[11] Cardiel-Álvarez, M. Á., Arnaltes, S., Rodriguez-Amenedo, J. L.: 'Decentralized Control of Offshore Wind Farms Connected to Diode-Based HVdc Links'. IEEE Trans. Energy Convers., 2018, 33, (3), pp. 1233-1241 [12] Yu, L., Li, R., Xu, L.: 'Distributed PLL-based Control of
Offshore Wind Turbine Connected with Diode-Rectifier based HVDC Systems', IEEE Trans. Power Del., 2018, 33, (3), pp. 1328-1336
[13] Li, R., Yu, L., Xu, L.: 'Offshore AC Fault Protection of Diode Rectifier Unit Based HVDC System for Wind Energy Transmission'. IEEE Trans. Ind. Electron.(early access)
[14] Li, R., Yu, L., Xu, L., et al.: 'DC fault protection of diode rectifier unit based HVDC system connecting offshore wind farms', 2018 IEEE Power and Energy Society
General Meeting, Portland, United States, Aug 2018, pp. 1-5
[15] Nguyen, T. H., Lee, D. C., Kim, C. K.: 'A Series-Connected Topology of a Diode Rectifier and a Voltage-Source Converter for an HVDC Transmission System', IEEE Trans. Power Electron., 2014, 29, (4), pp. 1579-1584
[16] Menke, P., Zurowski, R., Christ, T., et al.: '2nd Generation DC Grid Access for Large Scale Offshore Wind Farms', Proceedings of the 14th Wind Integration Workshop, Brussels, Belgium, Oct 2015, pp. 1-6
[17] Seman, S., Zurowski, R., Taratoris, C.: 'Interconnection of advanced Type 4 WTGs with Diode Rectifier based HVDC solution and weak AC grids'. Proceedings of the 14th Wind Integration Workshop, Brussels, Belgium, Oct 2015, pp. 1-6.
[18] Yu, L., Li, R., Xu., L.: 'Parallel operation of diode-rectifier based HVDC link and HVAC link for offshore wind power transmission'. The 7th International Conference on Renewable Power Generation (RPG2018), Copenhagen, Denmark, Sep 2018, pp. 1-6.
[19] Szechtman, M. Wess, T. and Thio, V. C.: 'First benchmark model for HVDC control studies'. Electra, 1991, 135, (4), pp. 54–67.
[20] Marten, A., Akmatov, V., Sørensen, B. T., et al.: 'Kriegers flak-combined grid solution: coordinated cross-border control of a meshed HVAC/HVDC offshore wind power grid'. IET Renewable Power Generation, 2018, 12, (13), pp. 1493-1499,.
[21] Kraftnät, S.: 'An analysis of offshore grid connection at kriegers flak in the baltic sea'. Energinet. dk, Tech. Rep, 2009.
[22] Guan, L., Fan, X., Liu, Y., et al.: 'Dual-Mode Control of AC/VSC-HVDC Hybrid Transmission Systems With Wind Power Integrated', IEEE Trans. Power Del., 2015, 30, (4), pp. 1686-1693.
[23] Cheah-Mane, M., Sainz, L., Liang, J., et al.: 'Criterion for the Electrical Resonance Stability of Offshore Wind Power Plants Connected Through HVDC Links', IEEE Trans. Power Syst., 2017, 32, (6), pp. 4579-4589 [24] Kunjumuhammed, L. P., Pal, B. C., Gupta, R., et al.:
'Stability Analysis of a PMSG-Based Large Offshore Wind Farm Connected to a VSC-HVDC', IEEE Trans. Energy Convers., 2017, 32, (3), pp. 1166-1176
[25] Karawita, C., Annakkage, U. D.: 'Multi-Infeed HVDC Interaction Studies Using Small-Signal Stability Assessment', IEEE Trans. Power Del., 2009, 24, (2), pp. 910-918
[26] Pogaku, N., Prodanovic, M., Green, T. C.: 'Modeling, analysis and testing of autonomous operation of an inverter-based microgrid', IEEE Trans. Power Electron., 2007, 22, (2), pp. 613–625
[27]'Linearization of Models with Delays'. https://www.mathworks.com/help/slcontrol/examples/lin earization-of-models-with-delays.html, accessed 21 February 2019.
9. Appendix
9.1. Modelling of diode rectifier filters
The dynamics of diode rectifier filters in dq reference, as shown in Fig. 15, are expressed as
Engineering and Technology Copyright. The copy of record is available at IET Digital Library. 10
(
)
(
)
2 3 2 4 1 2 3 2 3 1 1 2 2 3 2 4 1 2 3 2 3 1 1 2 2 2 2 1 2 2 2 2 2 2 pccd pccd d d dr pccq d d casumd drd pccq pccq q q dr pccd q q casumq drq pccd d d d dr q q pccq dv R R v v v C dt R R R R C v i i i i dv R R v v v C dt R R R R C v i i i i v dv v C i C v dt R R dv v C dt + = − + + + − − + − + = − + + − − − + − = − + + = 2 1 2 2 2 2 3 3 1 3 3 3 3 1 3 3 4 4 4 2 4 4 3 3 4 4 4 2 4 4 3 3 1 1 2 3 1 11 1 1 q q dr q d d dr q q q dr d pccd d d d dr q q pccq q q dr d d pccd d d d dr q q v i C v R R dv C i C v dt dv C i C v dt v dv v C i C v dt R R dv v v C i C v dt R R di L v v v Ri L i dt di L v dt − + − = + = − = + − + = + − + = − − − + = 2 3 1 11 2 2 4 2 2 2 4 2 2 pccq q q q dr d d pccd d dr q pccq q dr d v v Ri L i di L v v L i dt diq L v v L i dt − − − − = − + = − − (9)where C1 is reactive power compensation capacitance; R1, C2,
C3 and L1 are the resistance, capacitances and inductance of
low frequency filter; R2, C4 and L2 are the resistance,
capacitance and inductance of high frequency filter; vpccd,
vpccdq, v2d, v2q, v3d, v3q, v4d and v4q are the d- and q-axis
components of the voltages of C1, C2, C3 and C4; i1d, i1q, i2d
and i2q are the d- and q-axis components of currents of L1 and
L2; icasumd and icasumq are the d- and q-axis components of the
current injected to the diode rectifier filter.
9.2. Modelling of HVDC cables
HVDC cables are represented by T-model and their dynamics are expressed as
2 2 2 dcr eq dc dcr dcc dcr dcc dc dcr dci dci dc dc dci dci dcc dI L R I V V dt dV C I I dt dI L R I V V dt + + = = − + + = (10)
where Rdc, Ldc, and Cdc are the resistance, inductance and
capacitance of HVDC cable; Vdcc and Vdci are the DC voltage
of DC capacitor and onshore inverter; Idci is the DC current of
onshore inverter; Leq is the equivalent inductance and equals
to 2Ldc+2BLdr. 4 C v4 pcc pcc v 1 C 1 R 3 C 2 C dr i 2 i 1 i 3 v pcc v casum i 2 v 1 L 2 L R2 dr L 1:Tdr dc R dc L dc R dc L dc R Ldc dc R Ldc dc C dcr V Vdcc Vdci dcr I Idci
Fig. 15. Diagram of DR-HVDC link.
9.3. Modelling of HVAC link
HVAC link modelling is divided into three parts: onshore grid with transformer 1, HVAC cables and offshore transformer 2, as shown in Fig. 16. The dynamics of onshore grid with transformer 1 are expressed as
(
)
(
)
(
)
(
)
1 1 1 1 1 1 1 1 ond ca don T on T onq ond on ond
ac
onq ca q
on T on T ond onq on onq
ac di v L L L L i v R i dt T di v L L L L i v R i dt T + = + + − − + = − + + − − (11) where Ron, Lon and LT1 are the resistance, grid inductance and
transformer 1 inductance; iond and ionq are the d- and q-axis
components of onshore grid current; vca1d , vca1q, vond and vonq
are the d- and q-axis components of HVAC cable capacitor voltage and grid voltage. Tac1 is the ration of the transformer
1.
HVAC cable is represented by 7 R-L-C sections. When two sections are connected in series, two parallel capacitors at joint can be regarded as one capacitor with twice the original value. The modelling of HVAC cable and transformer 2 can be extended from one AC cable section. The dynamic of one R-L-C sections is expressed as
1 1 1 1 1 1 1 1 1 1 1 1 1 1 1 1 2 1 1 1 1 1 1 1 2 1 1 1 ca d ond ca ca ca q ca d ac ca q onq ca ca ca d ca q ac ca d ca ca ca q ca d ca d ca ca d ca q ca ca ca d ca q ca q ca ca q dv i C C v i dt T dv i C C v i dt T di L L i v v R i dt di L L i v v R i dt = + − = − + − = + − − = − + − − (12)
where Rca1, Cca1 and Lca1 are the resistance, capacitance and
inductance of first AC cable section; ica1d and ica1q are the d-
and q-axis components of cable inductance current; vca2d and
vca2q are the d- and q-axis components of second section
cable capacitor voltage. The modelling of transformer 2 is similar to transformer 1 and is not detailed here.
Transformer 1 on R Lon on v 1 T L 1:1 ac T on i 1 ca v 1 ca C 1 ca L Transformer 2 2 T i Rca1 1 ca i Fig. 16. Diagram of HVAC link.