www.astesj.com
347
Zebrafish Larvae Classification based on Decision Tree Model: A Comparative Analysis
Bayan AlSaaidah*,1, Waleed Al-Nuaimy2, Mohammed Rasoul Al-Hadidi3, Iain Young4
1Department of Electrical Engineering and Electronics, University of Liverpool, Liverpool, L69 3GJ, UK
2Department of Electrical Engineering and Electronics, University of Liverpool, Liverpool, UK
3Department of Computer Engineering, Al-Balqa Applied University, Al-Salt, Jordan
4Institute of Integrative Biology, University of Liverpool, Liverpool, UK
A R T I C L E I N F O A B S T R A C T
Article history:
Received: 18 July, 2018 Revised: 09 August, 2018 Accepted: 21 August, 2018
Screening the abnormal development of the zebrafish embryos before and after being hatched for a large number of samples is always carried out manually. The manual process is presented as a tedious work and low-throughput. The single female fish produce hundreds of eggs in every single mating process, the samples of the zebrafish embryos should be studied and analyzed within a short time according to the fast response of their bodies and the ethical regulations. The limited number of the automatic screening systems for aquaculture experiments encourage researchers to find out a high-throughput screening systems with a fast prediction results according to the large number of experimental samples. This work aims to design an automatic segmentation, classification system for zebrafish eggs using two ways for feature extraction and also a classifier. Using the whole image generally with several feature vectors useful for detection process, this way does not depend on the type of the image. The second way focus on specific characteristics of the image which are the colour and the texture features relating to the system purposes. Two different ways for feature extraction integrated by the Classification And Regression Tree (CART) classifier are proposed, analysed, and qualified by comparing the two methods performance and accuracies. The experimental results for zebrafish eggs classification into three distinct classes: live egg, live embryo, dead egg show higher accuracy using the texture and colour feature extraction with an accuracy 97% without any manual intervention. The proposed system results very promising for another type of classification such as the zebrafish larva deformations.
Keywords: Classification CART Model Feature Extraction Zebrafish
1. Introduction
This paper is an extended work for the published paper in International Conference on Information and Communication Systems (ICICS) [1]. The proposed procedure is a part of an integrated detection, classification, counting system for zebrafish embryo malformations. After adding different chemical substances with different concentration, several deformation types appear on the larva body whether before or after being hatched. The malformations classified depending on the affected
part such as the tail curvature, necrosed yolk, and the dead larva. Over the
recent years the zebrafish has become one of the most common animal models. This is due to many factors including a high degree of genetic similarity with humans, short generation times, transparent larval stages, extensively annotated genome and simple husbandry [2][3]. Zebrafish are now widely used in drug development, to measure the impact of environmental changes, of toxins and pollutants and many other applications. However, the use mammals in the biological experiment is expensive and laborious, it also led to an increasing number of
ASTESJ
ISSN: 2415-6698* Bayan AlSaaidah, University of Liverpool, Email: [email protected]
www.astesj.com
Special Issue on Recent Advances in Engineering Systems
ethical issues for toxicological research, and that have been limited in large-scale screening efforts [4].
The standard protocols, laws, and regulations for animal protection have been submitted to use zebrafish larvae in the experiment instead of using the adult and also with a specific age depending on the degree of the acuteness of the added materials, as only larvae less than five days after fertilization are exempt from this legislation [5][6]. Screening zebrafish larvae development and evaluating the effects of the chemical compounds is started from the early ages of the samples. This process is carried out manually for a large number of samples. After each mating time, the single female can produce hundreds of eggs [7] that differ depending on their hormones [8].
In [9], the author segmented the embryos from the collected images and classify the sample into live or coagulated using Bayes classifier. However, the image gathering process was carried out using camera over the microscope, this way need to be aware about several factors like illumination and the focal point for high performance capturing process. The capturing process is carried out using different focal points till reach the suitable one. The proposed classification algorithm was Bayes model using colour and shape features. The same dataset of [9] was used by [10] to classify the images into healthy and coagulated eggs. This texture features were extracted using Segmentation-based Fractal Texture Analysis (SFTA) with the rotation forest classifier.
Using video analysis for zebrafish embryos was proposed in [11] to classify if the sample is alive or dead. By detecting the zebrafish embryo heart position and analysing the intensity variation of the heart, if the cyclic motion areas are zero then the sample will be considered as dead embryo.
Despite the rapid growth in the use of zebrafish embryos as an experimental model, there is still a lack of automated classification systems according to several challenges. Screening the zebrafish eggs and larvae abnormalities within one system where the zebrafish embryos grow in a fast way and hatched within few hours. To overcome this limitation global features can be extracted regardless the type of image. The samples may slide to the edges of the petri dish this can affect the detection process. To address this problem a fixed platform is used which is a flatbed scanner with the samples container.
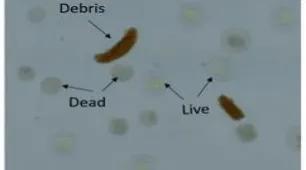
Another challenge is presented by unwanted objects such as the debris or food particles, as these can interfere with the detection process. To avoid this problem pre-processing operations and robust shape with colour thresholding processes are applied. The fast development of the zebrafish embryos lead to have two classes of the live embryos which have different age and different features, one of them is transparent and the other having a completed growing embryo. To address this challenge, robust and consistent different texture and colour features are extracted and used for classification purposes.
The lack of automated capture systems limit the development of a fully automated system. Using the proposed platform which
is affordable and easy to use, the images are collected automatically and the biologist only need to place the dish on the scanning area.
2. Experiment and Methodology
The proposed methods aim to identify the status of zebrafish eggs using two different methods of feature extraction. The images are comprised of many features which could be extracted aautomatically or manually. These two types of feature extraction are applied and analysed for the system purposes. The collected images were gathered using a scanner collecting a large number of high resolution images (suitable for biological observation) every scan facilitating high-throughput analysis. The images were classified as: live egg, dead egg or live embryo. The scanning process is always carried out synchronously with the biological experiments. Experiments ran for up to five days post fertilization (after which the embryos become protected) during which time chemical (e.g. application of different chemicals to the holding water) or physical interventions (e.g. temperature) can be applied. The images were prepared and subdivided into three different categories for the software design step.
2.1. Data Collection
The sample images that were used in this work were collected from dish containing a hundreds of zebrafish eggs. The dish images were used in [1] for counting purposes and have been collected by the authors during several biological experiments in the Institute of Integrative Biology laboratories at the University of Liverpool in collaboration with the colleagues in this Institute. The eggs were subjected to a number of chemical substances such as: Dimethyl sulfoxide (DMSO), Alcohol, the waste nitrogenous compounds Ammonia, (Sodium) Nitrite, (Sodium) Nitrate and metals such as Copper (Sulphate) as well as antimicrobial aquarium treatments.
The images were collected using a flatbed document scanner with a high speed scanning for a petri dish of 100mm diameter. The benefit of using a scanner were manifold. The scanner has its own source of illumination and a fixed focal length, therefore, there is no need to consider the exposure or focus on the capturing process. The scanner provides the biologist hundreds of sample images in one scan where the traditional way for collecting images in the proposed systems is always carried on using camera with a microscope which is considered as a time consuming process. Figure 1 shows an example of the collected scanner images. The images that have been used in the proposed classifier were gathered from the dish images.
Depending on the egg detection process, the samples are cropped using the egg centres and diameters. The egg detection process starts by Canny edge detection function using a threshold produced from a Sobel edge detection function. This process is followed by several morphological operations. Finally, the circles with specific range of radius are extracted from the whole image. The resulting images are collected and have been used to classify them into three classes as resulting from the biological experiments. Figure 2 shows an example from the collected images from the three classes. The live eggs between 0-40 hpf (hours post fertilization) are transparent and looks like a yellow circle. The dead eggs are white and appear dark. The last class which present a bigger embryo with more than 48hpf and before hatching.
(a) (b) (c)
Figure 2: Scanner images of three classes :(a) Live egg. (b) Live embryo. (c)Dead egg
2.2.Experiment
In this work, two methods of feature extraction are proposed, analysed, and assessed to develop a high performance classification system. The first method depends up on the image pixel values after splitting each colour image into multiple sub-images, while the second method deals with the sample objects and extracts the most important colour and texture features. With these two different ways the same classifier type with the same parameters is used such as the number of trees of the CART model. These two scenarios are briefly illustrated in the following two sections.
2.3.Colour and Texture Features
Traditionally, feature extraction is one of the most important steps in object recognition. The process of feature extraction uses the most valuable characteristics of the image and converts them into numeric representations. The first proposed method for our system is shown in Figure 3.
2.3.1. Image Pre-Processing
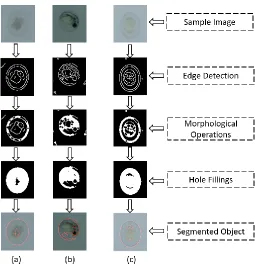
The collected images for the proposed classification system are 1211 images from the three classes live egg, live embryo, and dead egg. Several image processing operations are applied as shown in Figure 4 to segment the sample object from the whole image to make sure that the most important and useful features will be extracted where the image may contain debris and unwanted objects. These operations start with the edge detection process using Canny filter. After detection of the edges, some dilation using a disk mask with two pixels is done. To remove any unwanted objects, the largest object is segmented depending on the object areas. The resulting image is produced from the gray image multiplied by largest object binary image to keep the target
object information. The processed images have been used in the next steps to extract the features using two different ways. These features are used to train the classifier how to predict and classify the three classes.
Figure 3: First scenario for classification
Figure 4: Object segmentation :(a)Dead egg. (b)Live embryo. (c)Live egg
2.3.2. Feature Extraction
extracted from the egg images. The texture features are useful for the classification process when a wide variation of the gray levels are present in the image. Combining first and second order features aims to have robust features for classifier training step. The feature vector consists of 24 features for colour and texture image characteristics. For the image I of nxm in size, the mean and the standard deviation values are calculated as follows:
𝑚𝑒𝑎𝑛 = ∑ ∑ 𝐼𝑖𝑗
𝑚 𝑗=1 𝑛 𝑖=1
𝑚𝑛 (1)
𝑠𝑡𝑑 = √ 1
𝑚𝑛∑ ∑ (𝐼𝑖𝑗− 𝑚𝑒𝑎𝑛)
2 𝑚
𝑗=1 𝑛
𝑖=1 (2)
The first order features provide a basic information about the gray level distribution. However, the relative positions of these gray levels have not been provided by the first order features. The second order features describe and analyse if the low gray levels are together or mixed with the high gray levels. These features are calculated as proposed and illustrated in [12] [13] [14]. The second order statistics are calculated depending on a matrix Cθ,d (Ip1,Ip2) of the relative frequencies that describes how often the two pixels (Ip1,Ip2) of different or similar gray levels Ng appear as a pair in the image matrix concerning the distance d and the direction θ. The value of this parameter Ng is 8 levels.
Using the co-occurrence matrix, 22 features are extracted where the smoothness, coarseness, and the image texture information are described and quantified. The image contrast, correlation, cluster shade, cluster prominence, energy, homogeneity, entropy, and variance are measured as following:
1. Auto correlation:
𝑓1= ∑ ∑ (𝑖𝑗)(𝐶(𝑖, 𝑗))𝑖 𝑗 (3)
2. Contrast:
𝑓2 = ∑ 𝑛2{∑ ∑ 𝐶(𝑖, 𝑗)||𝑖 − 𝑗 = 𝑛|
𝑁𝑔 𝑗=1 𝑁𝑔 𝑖=1 𝑁𝑔−1
𝑛=0 (4)
3. Correlation:
𝑓3=
∑ ∑ (𝑖𝑗)𝐶(𝑖,𝑗)− 𝜇𝑖 𝑗 𝑥𝜇𝑦
𝜎𝑥𝜎𝑦 (5)
Where:
𝜇𝑥= ∑ 𝑖 𝐶𝑥(𝑖) 𝑖
𝜇𝑦= ∑ 𝑗 𝐶𝑦(𝑗) 𝑗
𝜎𝑥= ∑ 𝐶𝑥(𝑖) − 𝜇𝑥(𝑖) 𝑖
𝜎𝑦= ∑ 𝐶𝑦(𝑗) − 𝜇𝑦(𝑗) 𝑗
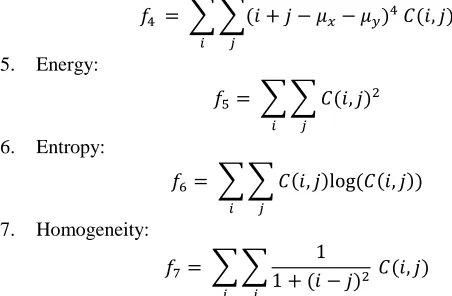
4. Cluster prominence:
𝑓4 = ∑ ∑(𝑖 + 𝑗 − 𝜇𝑥− 𝜇𝑦)4 𝐶(𝑖, 𝑗) 𝑗
𝑖 5. Energy:
𝑓5= ∑ ∑ 𝐶(𝑖, 𝑗)2 𝑗
𝑖 6. Entropy:
𝑓6= ∑ ∑ 𝐶(𝑖, 𝑗)log (𝐶(𝑖, 𝑗)) 𝑗
𝑖 7. Homogeneity:
𝑓7= ∑ ∑
1 1 + (𝑖 − 𝑗)2 𝑗
𝐶(𝑖, 𝑗) 𝑖
The rest of the 15 features are correlated using Matlab functions, cluster shade [13], dissimilarity [13], homogeneity using a Matlab function, maximum probability [13], sum of squares [12], sum average [12], sum variance [12], sum entropy [12], difference variance [12], difference entropy [12], information measure of correlation1 [12], information measure of correlation2 [12], inverse difference [14], inverse difference normalized [14], inverse difference moment normalized [14].
2.3.3. Classification
The idea of the CART classifier model is presented by conditions. In this model, several questions are answered by the trees sequentially like If-Then condition statements. These questions depend on the extracted features from the images. Using CART model related to its efficiency and flexibility. The tree model is easy to interpret and modify according to the observed internal work. The classification consists of two main steps, training and testing. The data set is divided for training and testing processes as follows:
Table 1: Data Set Division
Class Training Set Testing Set Total
Dead 322 161 483
Live (Embryo) 14 7 21
Live (Egg) 464 231 695
In the training stage the feature set (predictors) with class labels (responses) are used to train a CART classifier model. The second step is the testing step in which the classifier performance appears as an important indication of its capability. To predict the class of a new sample, the designed model follow the decisions in the tree from the root (beginning) node down to a leaf node. The leaf node contains the response. By repeating the first steps for preparing the image and extracting the 24 features, these features (predictors) are provided to the saved classifier model to predict the class (response).
2.4.Pixel Values Features
Figure 5: Second scenario of system
2.4.1. Image Splitting
The proposed method breaks the sample image down into several sub images. Each sub image presents a part of the whole image with a specific size (10x10) pixels from random positions and locations. The number of these sub images is chosen by trials as a sensitivity test for the process and it appears not to have a strong influence on recognition performance. However, the time complexity rises with increasing the number of extracted sub images. Each sub image is described by a feature vector containing a numerical values which are the pixel values. Using a fixed size for each sub image allows the classifier model to learn using the same size of the feature vectors for these sub images. The positivity of this process in its generalization where it can be applied on any type of images and it does not need for any image processing operations or features calculations.
2.4.2. Classification
Based on the ensemble approach in machine learning, a CART classifier model is built for each sub image. Each sub image is labelled according to the original image class then a CART model for each sub image is designed and provided by the feature vectors. According to the large number of features, the learning algorithm should deal with this number efficiently where this is one of the decision tree capabilities. In the training stage, the trees are grown until the model learns perfectly the training sample characteristics and can correctly classifies the training sample classes.
For the testing stage, non-labelled images are used and all the training images are no longer used here. To predict a new image, the image splitting or dividing step is repeated and the resulting
vectors are provided to the saved models. Each CART model predict class depending on the sub image features. The most frequent predicted class is considered to be the final decision of the predicted class.
2.5.Results and Discussion
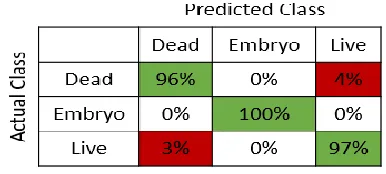
Both of the two methods of feature extraction and classification show good results. However, the texture and colour features extraction method has a higher accuracy especially for the live embryos class. This is related to the similarities between the live embryos class and the dead class. The classification algorithm is the same for the two methods where the comparison is done to compare two feature extraction ways. The first method based on the object texture and colour characteristics. The proposed work uses a CART model after extract 24 features as explained earlier. Based on this method, the classification accuracy to classify the sample image into three classes is 97%. This proposed method correctly classify 384 images out of 399 images that were used for testing. Figure 6 shows the confusion matrix for these three classes using this method.
Figure 6: Confusion matrix of the first method
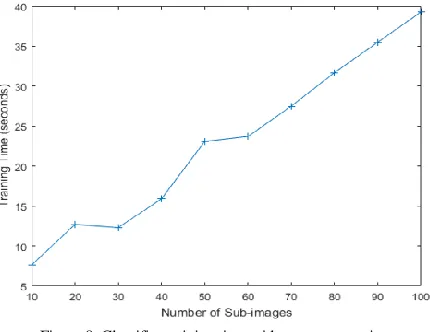
Depending on the pixel values of the image is the second proposed method in which the most important features are the pixel values regardless the image type. Furthermore, this method does not need for image preparing operation or a various type of calculations for feature extraction. By tuning the number of extracted sub images parameter to different numbers, the training and testing accuracy have not been changed obviously as shown in figure.7. However, the time complexity is affected by this variations directly proportional as shown in Figure 8. In addition, using larger size of the sub images rise the system accuracy as presented in Figure 7.
Figure 8: Classifier training time with parameter tuning
All the classification model parameters are the same in the two proposed methods. But, our analysis based on the feature extraction ways. The first one shows satisfactory results using the most important features in the image. The second way use the pixel values of the extracted sub-images to train the classifier model. This method performs well and varies according to the number of the sub-images and the size of each sub-image. The second method can be considered as a robustness and simpleness of the feature extraction calculations.
The first scenario classifier model shows a higher performance comparing with the second one, the complexity time is extremely the same. This classifier model is used to detect, segment, and classify the eggs within the whole dish image. Figure 9 shows examples of small parts of different dishes where the egg samples are detected successfully and classified correctly. The label L for the live organism and D for the dead ones.
Figure 9: Classification results for the whole dish image
As shown in Figure 9, the debris which is considered as unwanted object is discarded and the target objects are detected, segmented, and classified efficiently. However, in some cases the proposed system fail in detection and classification processes as shown in Figure 10. Some samples are misclassified which can be manipulated either by cross validation for the classifier or reducing the number of extracted features by using a feature selection algorithm.
Figure 10: Drawbacks of the classifier
Using the scanner images provide us with a large number of samples of very good quality. However, these images are taken from a bigger image that contains hundreds of eggs. Partitioning process to get every sample and deal with it as a single image distort the sample images in many cases which is considered as a big challenge in this work. Table 2 shows a comparison between the scanner and the tradition way for image gathering process, camera with a microscope which considered as a time-consuming process.
Table 2: Comparison between two imaging tools
Imaging tool Speed
(image/shot) Illumination Focal point Resolution
Flatbed Scanner
Hundreds of images *
Fixed by scanner
Fixed by
scanner High
Microscope
& Camera One
Important and influential
(fixed by the expert)
Important and influential
(fixed by the expert)
High
*depending on the number of samples, the imaging process is carried out for the whole dish.
3. Conclusion
In this paper, a novel zebrafish egg classification method is proposed using two methods for feature extraction process. Two methods were tested, analysed, and compared to each other and to the ground truth. By extracting the most important features for both colour and texture characteristics of the image, a high performance model is presented and evaluated with 97% testing accuracy to classify the sample image of the zebrafish egg into three classes depending on its status.
Using the flatbed scanner is presented as low cost effective imaging tool that save the consuming time where the one shot provide the system by hundreds of sample images. Furthermore, this tool affordable and easy to use by the biologists with a least imaging problems.
Using the pixel values of the split image parts was considered as a generic method where there is no need for applying any calculations or operations or even image modification. The results of this model is satisfactory and the parameters were tuned to a several values to reach the optimal parameter values and to see to how extent these parameters effect on the system accuracy. The performance of the first method was higher than the second one even though this method is generic and may applied on more than three classes with different characteristics.
samples is always carried out individually for hundreds of samples which is a time consuming process. In addition, the biologist need to analyse each sample to decide its status which is also considered as a time consuming process. By using the proposed system the biologist intervention is limited and the experiment time should be shorter than usual. This system present a part from a bigger classification system for detection, classification, and counting system for zebrafish embryo abnormalities using a high-throughput model for both the petri dish and the n-well plates.
4. References
[1] Al-Saaidah, B., Al-Nuaimy, W., Al-Hadidi, M., and Young, I., (2018, April). Automatic Counting System for Zebrafish Eggs using Optical Scanner. The 9th International Conference on Information and Communication Systems, 2018 9th International Conference. IEEE.
[2] Detrich, H. William, Monte Westerfield, and Leonard I. Zon, eds. The zebrafish: Disease models and chemical screens. Vol. 3. Academic Press, 2011.
[3] Yang, Lixin, Nga Yu Ho, Rüdiger Alshut, Jessica Legradi, Carsten Weiss, Markus Reischl, Ralf Mikut, Urban Liebel, Ferenc Müller, and Uwe Strähle. Zebrafish embryos as models for embryotoxic and teratological effects of chemicals. Reproductive Toxicology 28, no. 2 (2009): 245-253.
[4] Bhusnure, O., Mane, J.M., Gholve, S.B., Thonte, S.S. and Giram, P.S., 2015. Drug target screening and its validation by zebrafish as a novel tool. Pharm. Anal. Acta, 6(426), pp.10-4172.
[5] Braunbeck T., Böttcher M., Hollert H., Kosmehl T., Lammer E., Leist E., Rudolf M. and Seitz N., Towards an Alternative for the Acute Fish LC50 Test in Chemical Assessment:The Fish Embryo Toxicity Test Goes Multi-species – an Update. ALTEX - Alternativen zu Tierexperimenten. vol.22, pp. 87–102, (2005).
[6] Al-Jubouri Q., Al-Nuaimy W., Al-Taee M., Luna J., and Sneddon L., An automatic pattern detection method for behavioral analysis of zebrafish larvae, The International Multi-Conference on Systems, Signals and Devices (SSD), Germany, pp. 301-312, (2016).
[7] Chakraborty, Chiranjib, Chi H. Hsu, Zhi Hong Wen, Chang Shing Lin, and Govindasamy Agoramoorthy. Zebrafish: a complete animal model for in vivo drug discovery and development. Current drug metabolism 10, no. 2 (2009): 116-124.
[8] Hisaoka, K.K. and Firlit, C.F., 1962. Ovarian cycle and egg production in the zebrafish, Brachydanio rerio. Copeia, pp.788-792.
[9] Alshut, Rüdiger, Jessica Legradi, Lixin Yang, Uwe Strähle, Ralf Mikut, and Markus Reischl. Robust identification of coagulated zebrafish eggs using image processing and classification techniques. In Proc. of the 19th GMA-FA 5.14" Computational Intelligence” Workshop, pp. 2-4. 2009.
[10] Tharwat, Alaa, Tarek Gaber, Mohamed Mostaf Fouad, Vaclav Snasel, and Aboul Ella Hassanien. "Towards an automated zebrafish-based toxicity test model using machine learning." Procedia Computer Science 65 (2015): 643-651.
[11] Puybareau, É., Genest, D., Barbeau, E., Léonard, M. and Talbot, H., 2017. An automated assay for the assessment of cardiac arrest in fish embryo. Computers in biology and medicine, 81, pp.32-44.
[12] Haralick, R.M. and Shanmugam, K., 1973. Textural features for image classification. IEEE Transactions on systems, man, and cybernetics, (6), pp.610-621.
[13] Soh, L.K. and Tsatsoulis, C., 1999. Texture analysis of SAR sea ice imagery using gray level co-occurrence matrices. IEEE Transactions on geoscience and remote sensing, 37(2), pp.780-795.
[14] Clausi, D.A., 2002. An analysis of co-occurrence texture statistics as a function of grey level quantization. Canadian Journal of remote sensing, 28(1), pp.45-62.