UCLA Previously Published Works
Title
Gene expression in human brain implicates sexually dimorphic pathways in autism
spectrum disorders.
Permalink
https://escholarship.org/uc/item/5rt063gm
Journal
Nature communications, 7(1)
ISSN
2041-1723
Authors
Werling, Donna M
Parikshak, Neelroop N
Geschwind, Daniel H
Publication Date
2016-02-19
DOI
10.1038/ncomms10717
Peer reviewed
eScholarship.org
Powered by the California Digital Library
Received 20 Aug 2015|Accepted 14 Jan 2016|Published 19 Feb 2016
Gene expression in human brain implicates
sexually dimorphic pathways in autism spectrum
disorders
Donna M. Werling
1, Neelroop N. Parikshak
1& Daniel H. Geschwind
1,2,3,4Autism spectrum disorder (ASD) is more prevalent in males, and the mechanisms behind this sex-differential risk are not fully understood. Two competing, but not mutually exclusive, hypotheses are that ASD risk genes are sex-differentially regulated, or alternatively, that they interact with characteristic sexually dimorphic pathways. Here we characterized sexually dimorphic gene expression in multiple data sets from neurotypical adult and prenatal human neocortical tissue, and evaluated ASD risk genes for evidence of sex-biased expression. We find no evidence for systematic sex-differential expression of ASD risk genes. Instead, we observe that genes expressed at higher levels in males are significantly enriched for genes upregulated in post-mortem autistic brain, including astrocyte and microglia markers. This suggests that it is not sex-differential regulation of ASD risk genes, but rather naturally occurring sexually dimorphic processes, potentially including neuron–glial interactions, that modulate the impact of risk variants and contribute to the sex-skewed prevalence of ASD.
DOI: 10.1038/ncomms10717 OPEN
1Center for Neurobehavioral Genetics, Semel Institute, David Geffen School of Medicine, University of California, Los Angeles, Los Angeles, California 90095, USA.2Program in Neurogenetics, Department of Neurology, David Geffen School of Medicine, University of California, Los Angeles, Los Angeles, California 90095, USA.3Center for Autism Research and Treatment, Semel Institute, David Geffen School of Medicine, University of California, Los Angeles, Los Angeles, California 90095, USA.4Department of Human Genetics, David Geffen School of Medicine, University of California, Los Angeles, Los Angeles, California 90095, USA. Correspondence and requests for materials should be addressed to D.H.G. (email: [email protected]).
A
utism spectrum disorder (ASD) is a developmental condition characterized by deficits in social communica-tion and restricted, repetitive behaviours or interests1that is estimated to affect 1 in 68 children in the United States2. Genetic variation contributes strongly to ASD risk, as evidenced by high familial recurrence3–5, overlap with monogenic syndromes such as Fragile X (FMR1) or Smith–Lemli–Opitz syndrome (DHCR7)6, and higher rates of gene-disrupting genetic variants in ASD cases compared with their siblings or controls7–9. The set of genes that can be definitively implicated as ASD risk genes has been growing rapidly, and predictive models from studies of single nucleotide variants in sporadic cases estimate that there are likely to be hundreds of genes involved in ASD risk8,10. Given the scope of this genetic heterogeneity, understanding the biological aetiologies of ASD and designing broadly applicable treatments has proven challenging.One robust risk factor for ASD is sex: for every female with ASD in the United States, there are 4.5 affected males2, and a male bias in prevalence is consistent across countries and across diagnostic criteria11. A multiple threshold liability model has been applied to conceptualize this difference in vulnerability, which posits that a higher minimum liability is required for females to manifest the ASD phenotype as compared with males12–14; this is also referred to as the female protective model. There is now evidence from population-wide data, family-level data14and at the genetic level7,9,15to support the hypothesis from this model that autistic females with ASD carry greater genetic liability. However, we note that a female protective model is not incompatible with the existence of male-specific risk factors, and the molecular mechanisms responsible for either protecting females or potentiating males’ vulnerability remain unknown.
Several theories have been proposed regarding sex-differential risk and protective mechanisms, though the evidence supporting each is varied12. For example, ASD has been conceptualized as an X-linked disorder16,17, and although several X-chromosome genes have been implicated, numerous autosomal genes contribute to risk as well7,8; X-chromosome genes alone do not explain the overall male bias9,18,19. Imprinted, paternally expressed X-chromosome genes have also been proposed to exert protective effects on females20, though such genes have yet to be identified. Beyond genetics, the extreme male brain theory of autism posits that elevated prenatal testosterone exposure increases risk21. While recent evidence has linked increased fetal testosterone levels to later ASD diagnoses in a population sample22, the molecular and cellular mechanisms that act to link an early hormone exposure to a later ASD phenotype are unknown. It is also plausible that multiple mechanisms, acting independently or interacting with one another, collectively account for the sex bias in ASD risk.
We reasoned that since sex-differential gene expression patterns contribute to the development and function of a sexually dimorphic brain, evaluating genome-wide sex-differential gene expression in neural tissue could elucidate points of overlap with ASD risk genes and related pathways. Here we test two basic hypotheses about the relationship between sexually dimorphic expression and ASD risk genes: (1) ASD risk genes are expressed at different levels in males and females. With differing baseline expression levels, the magnitude of the impact of a disruptive mutation in a risk gene is likely to differ by sex. Accordingly, we expect to observe enrichment of sex-differentially expressed (sex-DE) genes among known ASD risk genes. (2) ASD risk genes are expressed at the same level in males and females, but genes in interacting molecular pathways and/or cellular processes are differentially expressed by sex. In this case, the downstream impact of sex-neutrally expressed ASD risk genes is likely modulated by their interactions with sexually dimorphic
processes. If this were the case, we would expect to observe enrichment of sex-DE genes among gene sets representing processes associated with ASD pathophysiology, but not among ASD risk genes themselves.
To evaluate these hypotheses, we identify sexually dimorphic gene expression patterns in adult and prenatal human cerebral cortex tissue and test ASD-associated gene sets for enrichment of sex-differential expression. We observe significantly male-biased expression patterns for microglial-function-enriched, ASD-upre-gulated, co-expression modules from post-mortem ASD brain23,24 and microglia and astrocyte marker genes25–27, but no enrichment of sex-differential expression for ASD risk genes. These patterns are most consistent with our second hypothesis, and suggest that sex differences in biological processes captured by specific ASD-dysregulated co-expression modules, or sexual dimorphisms in cortical microglia and/or astrocytes, may play critical roles in setting males’ greater risk for ASD.
Results
To identify sex-differential gene expression patterns in the human brain, we analysed RNA-sequencing (RNA-seq) gene expression data from human cerebral cortex tissue from the BrainSpan project28and from an independent, in-house data set, as well as published array data from prenatal samples29. We focused on cerebral cortex, since ASD risk genes are highly expressed in this region in neurotypical brain30,31, and examination of post-mortem autistic brain has demonstrated consistent gene expression changes in the cerebral cortex as well23,24. To characterize stable sex differences in gene expression, we evaluated samples from adult subjects, and to assess sex-differential expression during early development, when many ASD risk genes are highly expressed, we evaluated samples from prenatal subjects. We then tested multiple ASD risk gene sets, ASD-associated gene sets and cell type markers for enrichment of sex-differential expression8,23–27,32–34, to determine whether sexually dimorphic utilization of ASD risk genes, or genes in interacting processes, may contribute to the sex bias in ASD prevalence.
Sex-differential expression in adult human cortex. We first analysed RNA-seq data from 58 post-mortem cortex samples from the BrainSpan project28for sex-differential gene expression using a linear mixed model. This set of samples was collected from 10 teenage and adult subjects matched for sex, age and brain region (13–40 years; 5 females), and filtered for outliers (Supplementary Table 1).
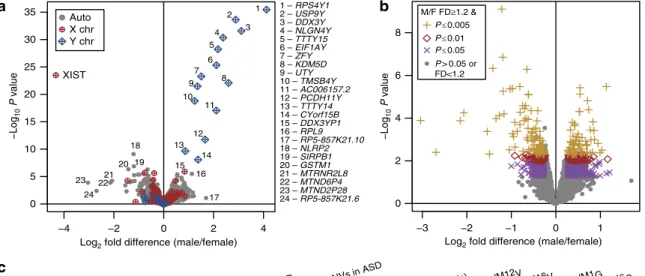
Sex-differential expression patterns in adult cortex show expected, robust differential expression of Y-chromosome genes andXIST, an X-chromosome transcript that initiates X-chromo-some inactivation and is only expressed in females (Fig. 1a). We note that all Y-chromosomal transcripts that fail to show male-biased expression are pseudogenes with high sequence similarity to their corresponding genes on other chromosomes. Previous studies of sex-differential expression in human brain have preferentially reported sex-DE genes with pronounced fold differences (FDs), such as those on the X and Y chromosomes29,35,36. Beyond these differences driven by sex chromosome copy number, sex-differential expression of auto-somal and non-XIST X-chromosome transcripts are generally subtle in magnitude37, and may reflect sex-specific tuning of molecular pathways. Using a minimum FD magnitude of 1.2, a standard threshold, we identify 186 genes atPo0.005, 311 genes atPo0.01 and 866 genes atPo0.05 (Fig. 1b and Supplementary Data 1); just 58 genes are sex-DE at a Benjamini–Hochberg adjustedPvalue of 0.05, 21 of which are on the sex chromosomes.
0.08 0.13 0.21 0.35 0.6 1 1.7 2.8 4.7 7.9 13.3
Odds ratio for
enrichment
NeuronsOligodendrocytesAstrocytesActivated microgliaCA1 pyramidal neuronsS1 pyramidal neuronsInterneuronsOligodendrocytesAstrocytesMicroglia Endothelial cellsEpendymal cellsMural cells
0.019
1.4e-08 0.03 1.0e-04 1.8e-12
Cahoy et al. 2008 Zeisel et al. 2015 0 20 40 60 80 100 0 20 40 60 80 100
% Genes with higher expr.
in males (M/F FD>1)
% Genes with higher
expr. in females (M/F FD <1) 3.3e-11 8.5e-37 4.2e-09 1.7e-07 e f FD≥1.2 Male-DE FD≥1.2 Female-DE c
ASD candidate genesGenes with protein-disr. RDNVs in ASDGenes with protein-disr., missense RDNVs in ASDFMRP-interacting genesGenes up in ASD (relative to controls)Genes down in ASD (relative to controls)ASD-down co-expression module asdM12 V
ASD-up co-expression module asdM16 V
ASD-down co-expression module asdM1 G
ASD-up co-expression module asdM6 G
ASD-up co-expression module asdM5 G 1.5e-04 0.0058 1.8e-10 8.1e-04 0.0069 1.0e-07 4.9e21 8.2e-14 0.0058 9.2e-08 FD≥1.2 Male-DE 0.08 0.13 0.21 0.35 0.6 1 1.7 2.8 4.7 7.9 13.3
Odds ratio for
enrichment 0 20 40 60 80 100
% Genes with higher expr.
in males (M/F FD>1) 0 20 40 60 80 100
% Genes with higher
expr. in females (M/F FD <1) d P≤0.05 P≤0.05 P≤0.05 P≤0.05 FD≥1.2 Female-DE −3 −2 −1 8 −Log 10 P value M/F FD≥1.2 & P≤0.005 P≤0.01 P≤0.05 0 1
Log2 fold difference (male/female) 6 4 2 0 P> 0.05 or FD<1.2 −4 −2 10 15 20 25 30 35
Log2 fold difference (male/female)
−Log 10 P value Auto X chr Y chr 0 2 4 0 5 XIST 1 – RPS4Y1 2 – USP9Y 3 – DDX3Y 4 – NLGN4Y 5 – TTTY15 6 – EIF1AY 7 – ZFY 8 – KDM5D 10 – TMSB4Y 11 – AC006157.2 12 – PCDH11Y 13 – TTTY14 14 – CYorf15B 15 – DDX3YP1 16 – RPL9 17 – RP5-857K21.10 18 – NLRP2 19 – SIRPB1 20 – GSTM1 21 – MTRNR2L8 22 – MTND6P4 23 – MTND2P28 24 – RP5-857K21.6 9 – UTY 1 2 3 4 5 6 7 8 9 10 11 12 13 14 16 17 18 19 20 21 22 23 24 15 b a Albright and Gonzalez -Scarano 2004
Figure 1 | Microglia and astrocyte markers and genes upregulated in ASD brain tend toward higher expression in adult male brain.(a) Volcano plot for the differential expression results from all 16,392 transcripts expressed in the adult BrainSpan sample (nmale¼29 samples from 5 subjects,nfemale¼29 samples from 5 subjects). (b) Subset of the volcano plot inafor all 15,724 autosomal transcripts. (c) Enrichment for ASD risk genes and ASD-associated gene expression patterns, and (e) neural cell type markers, within male-DE (higher expression in males, FDX1.2,Pp0.05; 439 genes) and female-DE (higher expression in females, FDX1.2,Pp0.05; 427 genes) gene sets by Fisher’s exact test; circle size and colour indicate the odds ratio of all significant overlaps (Bonferroni-adjustedPvalueo0.05); overlaid text displays the adjustedPvalue for each enrichment. (d) Shifts in the distribution of sex-differential expression direction for genes in each ASD risk or ASD expression sets, and (f) neural cell type markers. Blue and pink bars display the proportions of each gene set that have higher expression in males (FD41) or females (FDo1); whiskers note 95% confidence intervals; horizontal black lines note the proportion of male- and female-higher genes in the corresponding background gene set. Overlaid text displays significant Bonferroni-adjusted Pvalues from the binomial test. chr, chromosome; disr., disrupting; expr., expression; F, female; M, male.
The 37 autosomal sex-DE genes, then, are not sexually dimorphic due to copy number differences between males and females. Instead, they may be the regulatory targets of sex steroid hormone receptors or transcription factors from the X or Y chromosomes, or they may be preferentially expressed in a certain cell type that is differentially represented in male and female cortex.
Over-representation analysis for gene sets of interest. To determine whether genes associated with ASD risk show sex-dif-ferential expression in the human adult cortex, we examined sets of known risk genes from several sources: (a) candidate genes from a manually curated database32; (b) genes with rare,de novo, protein-disrupting or missense single nucleotide variants in sporadic ASD cases from the Simons Simplex Collection8; and (c) FMRP (Fragile X mental retardation protein) binding targets33 (Supplementary Data 2). Together, these gene sets capture a broad scope of ASD risk genes, including heavily studied candidates, genes with evidence of de novo risk variants, and genes from a strongly ASD-associated regulatory network33. For each gene set, we first applied a Fisher’s exact test to assess its overlap with sex-DE genes defined by specific thresholds (FDZ1.2 and Pr0.05, Fig. 1c,
Supplementary Data 3; FDZ1.2 and Pr0.01 or Pr0.005,
Supplementary Data 3). To corroborate these results and assess sexually dimorphic shifts in gene expression across the transcriptome without applying arbitrary thresholds, we also used a binomial test to assess each gene set’s distribution into two possible outcomes: higher expression in males (FD41, any P
value), or higher expression in females (FDo1, anyPvalue). We found no evidence from either test for significant sex-differential expression of any of these diverse sets of ASD risk genes in the adult cerebral cortex, providing no evidence supporting hypothesis 1 (Fig. 1d and Supplementary Data 3).
Next, we tested gene sets with evidence of ASD-associated expression patterns in adult human cortex23,24 (Supplementary Data 2), neural cell type marker gene sets25–27(Supplementary Data 4) and genes marking cell types of the adaptive immune system34(Supplementary Data 5) for sex-differential expression. We include immune cell markers in this analysis, since recent work has suggested complementary roles for T cells and microglia in mediating behaviour, specifically pain responses, in female versus male animals38. The ASD-associated gene sets include genes differentially expressed in post-mortem cortex from subjects diagnosed with ASD24, and two ASD-associated co-expression modules from this same study (asdM12V,
down-regulated in ASD and enriched for genes with neuronal and synaptic functions; and asdM16V, upregulated in ASD and
enriched for genes involved in immune and inflammatory responses)24. We also tested three ASD-associated co-expression modules from a subsequent RNA-seq study by Gupta et al.23, which used a larger, but overlapping set of individuals (asdM1G, downregulated in ASD, and asdM6G,
upregulated in ASD, both modules are enriched for neuronal markers and synaptic genes and overlap with the asdM12V
module24; asdM5G, which is upregulated in ASD, enriched for
M2-state microglial genes, and overlaps with the asdM16V
module24). These DE genes and co-expression modules comprise large gene sets that were coherently altered in samples of ASD cases harbouring different genetic aetiologies. Therefore, these sets are likely to represent the downstream consequences of deleterious variants in risk genes, an upstream or ongoing background of molecular risk for ASD, or a secondary response to alterations in brain function that accompany ASD, any of which might be sexually dimorphic.
In contrast to the ASD risk genes, we observe significant enrichment and depletion for neural cell type markers and gene
sets dysregulated in post-mortem brain from autistic subjects24. Among genes expressed at significantly higher levels (FDZ1.2, Po0.05) in males than in females (male-DE), we find a sevenfold enrichment of ASD-upregulated genes (7.0-fold, Fisher-adjusted
P (PFisher_adj)¼1.5e-04; Fig. 1c and Supplementary Data 3).
Among genes upregulated in ASD post-mortem cortex (ASD-up)24, 67% show higher expression in males than in females (male-higher, 21% shift from background expectation, binomial test-adjusted P (PBinom_adj)¼6.9e-03, Fig. 1d). Genes belonging
to the ASD-upregulated module asdM16Valso show enrichment
for significantly male-DE genes (5.2-fold, PFisher_adj¼1.8e-10,
Fig. 1c) and a significant shift towards male-biased expression overall (73% male-higher, 28% shift,PBinom_adj¼4.9e-21, Fig. 1d).
The related co-expression module asdM5Gfrom Gupta et al.23
also shows this male-biased shift in expression (57% male-higher, 11% shift,PBinom_adj¼9.2e-08, Fig. 1d). It is critical to note that
this apparent concordance between sex and ASD status is not the result of a male skew or lack of sex balance in the cases and controls used by either post-mortem ASD study23,24, as all samples consisted predominantly of males (Voineagu et al.24: 4/16 female ASD cases and 1/16 female controls; Guptaet al.23: 8/32 female ASD cases and 9/41 female controls). Both of these published studies use multiple approaches to show that sex confounds do not drive the observed ASD-associated gene expression changes in brain23,24.
The ASD-upregulated gene list asdM16V, and asdM5G are
associated with astrocyte and microglial function; asdM16V
overlaps significantly with human microglial and astrocyte co-expression modules identified in neurotypical cerebral cortex24,39 and asdM5Gis enriched for gene expression signatures from M2
microglia23. Consistent with this, we also observe significant enrichments among male-DE genes for two independently generated sets of microglia markers (Albright et al.25: 2.1-fold,
PFisher_adj¼0.029; Zeisel et al.27: 6.4-fold, PFisher_adj¼1.8e-12,
Fig. 1e, Supplementary Data 3) and for two independently generated sets of astrocyte markers (Cahoy et al.26: 2.4-fold,
PFisher_adj¼1.4e-08; Zeisel et al.27: 4.2-fold, PFisher_adj¼1.0e-04,
Fig. 1e); this is corroborated by significant shifts towards male-biased expression for both astrocyte gene sets and the microglial markers generated by single-cell RNA-seq27 (Cahoy et al.26, astrocytes: 60% male-higher, 15% shift, PBinom_adj¼8.5e-37;
Zeisel et al.27, astrocytes: 69% male-higher, 23% shift,
PBinom_adj¼4.2e-09; microglia: 64% male-higher, 19% shift, PBinom_adj¼1.7e-07, Fig. 1f).
In contrast, the forebrain neuronal marker gene set26 is significantly enriched for genes expressed at significantly higher levels in females than in males (FDZ1.2, Po0.05; female-DE;
1.8-fold, PFisher_adj¼0.019, Fig. 1e) and shifted towards
female-biased expression overall (64% with higher expression in females (female-higher), 9% shift,PBinom_adj¼3.3e-11, Fig. 1f). Similarly,
genes in the ASD-downregulated, neuronal and synaptic module asdM12V show enrichment for female-DE genes (2.7-fold, PFisher_adj¼5.8e-03, Fig. 1c), while the ASD-downregulated
module asdM1G shows depletion of male-DE genes (0.37-fold, PFisher_adj¼8.1e-04, Fig. 1c); both show a significant shift towards
female-biased expression overall (asdM12V: 70% female-higher,
16% shift,PBinom_adj¼1.0e-07; asdM1G: 64% female-higher, 10%
shift, PBinom_adj¼8.2e-14, Fig. 1d). No T- or B-cell modules
showed any significant enrichment with sex-DE genes or any significant shift towards male- or female-biased expression (Supplementary Fig. 1a).
Comparison of sex- and ASD-differential expression patterns. We were particularly interested in the sex-DE enrichment in the ASD-associated co-expression modules from post-mortem brain, asdM16V and asdM12V (ref. 24). Previous studies have
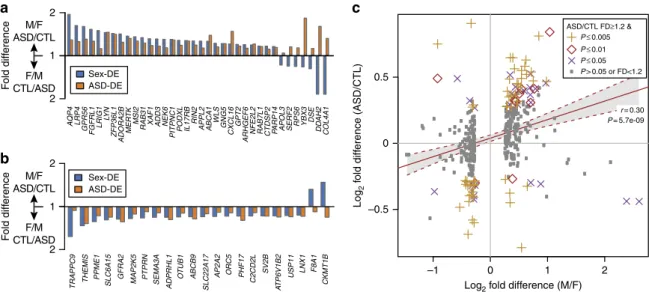
demonstrated that co-expression modules frequently correspond to neural cell types and coherent biological functions39,40; thus, sex-DE enrichments in these modules may most directly implicate pathways involved in sex-biased ASD risk. Strikingly, we observe that all 36 sex-DE genes that are also members of asdM16V are
expressed at higher levels in ASD than in control cortex24, 29 of which are also expressed at higher levels in neurotypical male than in female cortex (Fig. 2a). We also observe that all of the 22 sex-DE genes in asdM12V are expressed at lower levels in ASD than in
control cortex, and 20 of these are also expressed at higher levels in females compared with males (Fig. 2b). In short, we find concordant directionality of differential expression by sex and ASD status, with asdM16Vsex-DE genes expressed at higher levels
in ASD and typical males and asdM12Vsex-DE genes expressed at
higher levels in controls and typical females.
To assess the extent of these parallel expression patterns across the transcriptome, we compared the FDs from sex-DE genes with FDs observed in the differential expression analysis of ASD cortex24. For the 374 sex-DE genes (FDZ1.2,Pr0.05) that were
also tested in the ASD-DE analysis, we observe a highly signifi-cant positive correlation between the sex-differential and ASD-differential FDs (r¼0.30,P¼5.7e-09, Fig. 2c), as well as for the subset of genes differentially expressed at FDZ1.2 andPr0.05 in
both comparisons (r¼0.29,P¼5.7e-04,N¼90 genes). We note that among the 47 genes expressed at significantly higher levels in both males and in ASD, 22 are asdM16Vmembers24and 19 are
astrocyte markers26(16 belong to both sets). Among the 25 genes expressed at significantly higher levels in both females and in unaffected controls, 11 are asdM12V members41 and 12 are
neuron markers14(5 belong to both sets). These results suggest that the parallels in sex-differential and ASD-differential express-ion directexpress-ion extend beyond asdM16Vand asdM12V, and that this
pattern may be more broadly indicative of sexually dimorphic transcriptomes originating from specific neural cell types.
Independent replication of adult sex-differential expression. To validate these observations, we next analysed RNA-seq data from an independent sample of adult cortex tissue (16–56 years,
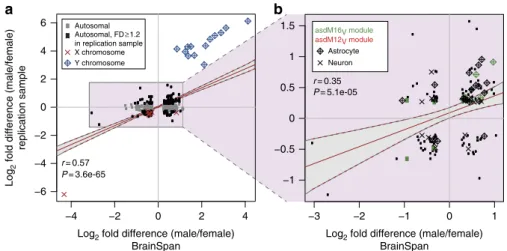
Supplementary Table 1) for sex-differential expression patterns. Using this smaller data set, we identify 65 genes atPo0.005, 98 genes at Po0.01 and 519 genes at Po0.05 (Supplementary Fig. 2a,b and Supplementary Data 1). Overall, sex-DE genes from the BrainSpan data were expressed at comparable levels and with positively correlated fold differences in this independent sample (expression levels: r¼0.78, P¼2.9e-150; log2(FD)s, r¼0.57, P¼3.6e-65; Fig. 3a). We observed no over-representations of ASD risk genes among significantly sex-DE genes (FDZ1.2, Po0.05) from these data (Supplementary Fig. 2d and Supplementary Data 6); however, FMRP targets were more likely to show higher expression in females than in males (62% female-higher, 13% shift, PBinom_adj¼2.9e-10, Supplementary Fig. 2d).
Oligodendrocyte markers and endothelial cell markers also showed shifts towards female-biased expression (Cahoy et al.26
oligodendrocytes: 56% female-higher, 9% shift,PBinom_adj¼
1.5e-11; Zeiselet al.27oligodendrocytes: 59% female-higher, 15% shift,
PBinom_adj¼5.8e-07; endothelial cells27: 55% female-higher, 11%
shift,PBinom_adj¼5.7e-03, Supplementary Fig. 2f). We also found
depletion of male-DE genes in asdM1G (0.26-fold, PFisher_adj¼0.027, Supplementary Fig. 2c), but enrichments for
asdM16V genes (4.7-fold, PFisher_adj¼2.8e-03; 64% male-higher,
11% shift,PBinom_adj¼5.2e-03, Supplementary Fig. 2c,d), asdM6G
genes (58% male-higher, 7% shift, PBinom_adj¼0.014,
Supple-mentary Fig. 2d), astrocyte marker genes (Cahoy et al.26: 61% male-higher, 10% shift, PBinom_adj¼1.7e-16; Zeisel et al.27: 69%
male-higher, 18% shift, PBinom_adj¼6.6e-06, Supplementary
Fig. 2f) and ependymal cell markers (60% male-higher, 9% shift, PBinom_adj¼0.027, Supplementary Fig. 2f). Again, we find
no sex-differential expression signal in T- and B-cell modules (Supplementary Fig. 1b and Supplementary Data 6). Of the 164 genes expressed more highly in males with a FDZ1.2 in both
adult data sets, 24 are asdM16Vmembers (8.8-fold enrichment, P¼5.5e-14) and 70 are astrocyte markers (10.3-fold enrichment,
P¼3.3e-35; 14 of these genes are belong to both sets), further supporting the characterization of astrocytic genes and ASD-upregulated, microglial-function-enriched asdM16V genes, as
displaying male-biased expression in the adult human cortex (Fig. 3b). A QP4 LRP4 GPR56 FGFRL1 LRIG1 LY N ZFP36L1 ADORA2B MER TK MSI2
RAB31 XAF1 ADD3 NEK6 PITPNC1 PODXL IL17RB
RIN2 APPL2 ABCA1 WLS GNG5 CXCL16 GPT2 ARHGEF6
NFE2L2 RAB7L1 CTDSP2 PARP14 APOL3 SERF2 RPS6 YBX3 DSE DD AH2 COL4A1 F old diff erence 2 1 2 M/F ASD/CTL F/M CTL/ASD a TRAPPC9 THEMIS PPME1
SLC6A15 GFRA2 MAP2K5 PTPRN SEMA3A ADPRHL1 O
TUB1 ABCB9 SLC22A17 AP2A2 ORC5 PHF17 C2CD2L SV2B A TP6V1B2 USP11 LNX1 F8A1 CKMT1B 2 1 2 b Sex-DE ASD-DE F old diff erence M/F ASD/CTL F/M CTL/ASD c –1 0 1 2 –0.5 0 0.5
Log2 fold difference (M/F)
Log 2 f old diff erence (ASD/CTL) r= 0.30 P= 5.7e-09 ASD/CTL FD≥1.2 & P≤0.005 P≤0.01 P≤0.05 P> 0.05 or FD<1.2 Sex-DE ASD-DE
Figure 2 | Sex-differential expression parallels gene expression patterns in ASD brain.Bar plots show FDs by sex and ASD status of sex-DE genes (FDZ1.2 andPo0.05) that also belong to ASD-associated co-expression modules24. (a) Module asdM16V, which is significantly upregulated in ASD and enriched for genes involved in the inflammatory response and immune system functions, and (b) module asdM12V, which is significantly downregulated in ASD and enriched for genes with neuronal and synaptic functions. (c) FDs of sex-DE genes (FDZ1.2,Po0.05, 374 genes) by sex and status. Best-fit line and its 95% confidence interval are shown. CTL, control from ASD expression study; F, female; M, male.
Sex-differential expression in prenatal human cortex. One possible explanation for the lack of enrichment of ASD risk genes among sex-DE genes from adult brain is that ASD risk genes may be acting primarily during fetal brain development30,31. To address this, we next analysed array expression data from 86 neocortex samples from 8 subjects (4 females) between 16–22 post-conception weeks29(Supplementary Table 1). This prenatal epoch follows the mid-gestation peak in testosterone secretion from males’ differentiated testes42,43 and thus captures a stage during which steroid hormones are likely to be exerting organizational effects.
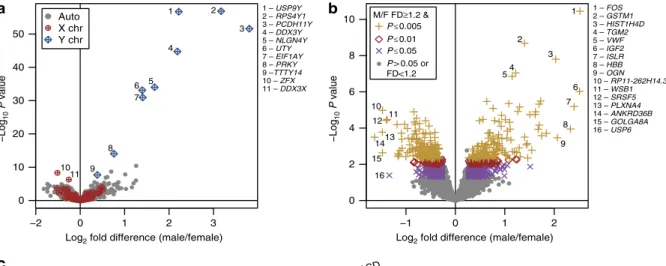
We find 306 sex-DE genes atPo0.005, 440 sex-DE genes at
Po0.01 and 1,037 sex-DE genes atPo0.05, with 96 genes sex-DE at an adjusted Po0.05 (Fig. 4a,b and Supplementary Data 1). Results from over-representation analysis for the gene sets of interest within these prenatally sex-DE genes mirror those in the adult data: there are no significant enrichments for ASD risk gene sets, and FMRP interactors are significantly depleted within male-DE genes (0.33-fold,PFisher_adj¼8.0e-04, Fig. 4c, Supplementary
Data 7).
As in adult brain, genes expressed more highly in prenatal male cortex show robust enrichments for post-mortem cortex ASD-upregulated genes (4.6-fold, PFisher_adj¼3.3e-03, Fig. 4c),
asdM16V genes (4.0-fold, PFisher_adj¼2.6e-09; 67% male-higher,
16% shift, PBinom_adj¼6.2e-05, Fig. 4c), asdM5Ggenes (2.9-fold, PFisher_adj¼5.1e-09; 61% male-higher, 13% shift,PBinom_adj¼4.2
e-07, Fig. 4c,d), microglia markers (Albright et al.25: 2.1-fold,
PFisher_adj¼2.8e-03; 60% male-higher, 11.4% shift, PBinom_adj¼
1.2e-04; Zeisel et al.27: 2.9-fold, PFisher_adj¼0.027, Fig. 4e,f),
endothelial markers (3.7-fold,PFisher_adj¼3.2e-06, Fig. 4e) and a
significant depletion of forebrain neuron marker genes (0.41-fold,
PFisher_adj¼2.3e-05; 58% female-higher, 7% shift, PBinom_adj¼
1.3e-04, Fig. 4e,f). As in adult, T- and B-cell modules show no enrichments or depletions of sex-DE genes, nor any sex-skewed expression shifts (Supplementary Fig. 1c and Supplementary Data 7). Taken together, these findings fail to support the hypothesis that ASD risk genes are differentially expressed by sex in the human cerebral cortex. Rather, we observe that sex-DE genes are enriched among specific classes of changes observed in post-mortem cortex from ASD patients, which is indicative of shared biology between ASD and typical sexual dimorphisms. These patterns of sex-DE enrichment follow what is observed in ASD cortex, with higher expression of microglial and astrocyte genes
(exemplified by asdM16V and asdM5G) in the more susceptible
male population, and higher expression of a cohort of synaptic genes (exemplified by asdM12V), in the more protected, female
population.
Discussion
Autism risk is sexually dimorphic, and genetic studies are most consistent with a female protective effect. To begin to explore potential mechanisms mediating sex-differential genetic risk, we tested the hypothesis that ASD risk genes would show sexually dimorphic expression in the cerebral cortex, a region that plays a major role in complex human cognitive phenotypes, including social behaviour, and where many ASD genes are expressed30,31. We observe both in adult and fetal brain that while some ASD risk genes do show sex-differential expression, overall this is not beyond what would be expected by chance. Furthermore, these sex-neutral expression patterns are evident in the mid-fetal cortex, a spatiotemporal point of convergence for ASD risk genes’ expression30,31.
Instead, we find support for a second hypothesis: that genes whose expression patterns are altered in post-mortem autistic brain, which highlight downstream or interacting pathways, but not ASD risk genes themselves, are differentially expressed by sex. The convergence of male-DE genes with these downstream pathways, but not with risk genes or neuronal markers, is consistent with the evidence presented by Voineagu et al.24: asdM16Vis upregulated in ASD brain and enriched for immune
system function and inflammatory response genes, but not for common ASD susceptibility variants. The asdM16V module is
therefore interpreted as representing a secondary, likely downstream effect of genetically causal perturbations. Whether a secondary effect of genetic variants or a result of independent mechanisms, it may be that expression of this gene set beyond a certain threshold is detrimental to neural development and function. Our findings show that typical males land closer to this putative threshold than females do, potentially implicating these genes expressed at higher levels in the male and ASD cortex in mechanisms driving male-biased ASD risk. Furthermore, to the extent that asdM16V upregulation contributes to ASD
pathophysiology, this module may serve as a useful target for pharmacological treatments that could modulate the effects of heterogeneous risk variants acting upstream.
−3 −2 −1 0 1 −1 −0.5 0 0.5 1 1.5
Log2 fold difference (male/female) BrainSpan b −4 −2 0 2 4 −6 −4 −2 0 2 4 6 Log 2
fold difference (male/female)
replication sample
a
Log2 fold difference (male/female) BrainSpan r= 0.35 P= 5.1e-05 asdM16V module asdM12V module Astrocyte Neuron Autosomal X chromosome Y chromosome Autosomal, FD≥1.2 in replication sample r= 0.57 P= 3.6e-65
Figure 3 | Male-biased expression of astrocyte and asdM16Vmodule genes in an independent sample.(a) FD for all sex-DE genes from the BrainSpan sample also tested in the replication set (BrainSpan FDZ1.2,Po0.05, 733 genes; grey points mark genes with FDo1.2 in the replication sample), and for (b) autosomal sex-DE genes from BrainSpan with FDZ1.2 in the replication sample (129 genes). Best-fit lines and 95% confidence intervals are shown on plots.
0.13 0.19 0.29 0.44 0.66 1 1.5 2.3 3.5 5.3 7.9
Odds ratio for
enrichment
NeuronsOligodendrocytesAstrocytesActivated microgliaCA1 pyramidal neuronsS1 pyramidal neuronsInterneuronsOligodendrocytesAstrocytesMicroglia Endothelial cellsEpendymal cellsMural cells
Cahoy et al. 2008 Zeisel et al. 2015
1.3e-04 1.2e-04 2.3e-05 0.0029 0.027 3.2e-06 0 20 40 60 80 100
% Genes with higher expr.
in males (M/F FD>1) 0 20 40 60 80 100
% Genes with higher
expr. in females (M/F FD <1) e f FD≥1.2 Male-DE FD≥1.2 Female-DE
Genes with protein-disr. RDNVs in ASDGenes with protein-disr., missense RDNVs in ASDFMRP-interacting genesGenes up in ASD (relative to controls)Genes down in ASD (relative to controls)ASD-down co-expression module asdM12 V
ASD-up co-expression module asdM16 V ASD-down co-expression module asdM1
G ASD-up co-expression module asdM6
G ASD-up co-expression module asdM5
G 0.13 0.19 0.29 0.44 0.66 1 1.5 2.3 3.5 5.3 7.9 Odds ratio for
enrichment 0 20 40 60 80 100
% Genes with higher expr.
in males (M/F FD>1)
6.2e-05 0.05
4.2e-07
8e-04 0.0033 2.6e-09 5.1e-09
0 20 40 60 80 100
% Genes with higher
expr. in females (M/F FD <1) c d FD≥1.2 Male-DE P≤0.05 P≤0.05 P≤0.05 P≤0.05 FD≥1.2 Female-DE −1 2 0 10 0 1
Log2 fold difference (male/female)
−Log 10 P value 2 4 6 8 b M/F FD≥1.2 & P≤0.005 P≤0.01 P≤0.05 P> 0.05 or FD<1.2 1 – FOS 2 – GSTM1 3 – HIST1H4D 4 – TGM2 5 – VWF 6 – IGF2 7 – ISLR 8 – HBB 10 – RP11-262H14.3 11 – WSB1 12 – SRSF5 13 – PLXNA4 14 – ANKRD36B 15 – GOLGA8A 16 – USP6 9 – OGN 1 2 3 4 5 6 7 8 9 16 10 11 12 13 14 15 1 – USP9Y 2 – RPS4Y1 3 – PCDH11Y 4 – DDX3Y 5 – NLGN4Y 6 – UTY 7 – EIF1AY 8 – PRKY 10 – ZFX 11 – DDX3X 9 –TTTY14 1 2 3 4 5 6 7 8 9 10 11 −2
Log2 fold difference (male/female)
−Log 10 P value a 0 1 2 3 0 10 20 30 40 50 Auto X chr Y chr Albright and Gonzalez -Scarano 2004
ASD candidate genes
Figure 4 | Microglia and astrocyte markers and genes upregulated in ASD brain tend toward higher expression in prenatal male brain.(a) Volcano plot for all 9,889 transcripts expressed in the prenatal sample (nmale¼43 samples from 4 subjects,nfemale¼43 samples from 4 subjects). (b) Subset of the plot inafor the 9,532 autosomal transcripts. (c) Enrichment for ASD risk genes and ASD-associated gene expression patterns, and (e) neural cell type markers, within male-DE (509 genes) and female-DE (528 genes) gene sets by Fisher’s exact test; circle size and colour indicate the odds ratio of all significant overlaps (Bonferroni-adjustedPvalueo0.05); overlaid text displays the adjustedPvalue for each enrichment. (d) Shifts in the distribution of sex-differential expression direction for genes in each ASD risk or ASD expression sets, and (f) neural cell type markers. Blue and pink bars display the proportions of each gene set that have higher expression in males (FD41) or females (FDo1); whiskers note 95% confidence intervals; horizontal black lines note the proportion of male- and female-higher genes in the corresponding background gene set. Overlaid text displays significant Bonferroni-adjusted Pvalues from the binomial test. chr, chromosome; disr., disrupting; expr., expression; F, female; M, male.
Alternatively or concordantly, it may also be the case that ASD-protective genes are expressed at a higher level in females. Genes in the neuronal- and synapse function-enriched asdM12V
module may represent such a protective gene set, as these genes are downregulated in ASD post-mortem cortex24. Genes belonging to asdM12Vdo show higher expression in adult female
cortex from the BrainSpan sample (Fig. 1c,d), though neither the replication adult sample nor the prenatal sample show this same female skew. Alternatively, the relatively sex-neutral expression of asdM12V genes in contrast to asdM16V may simply reflect the
absence of a particular ASD pathophysiological process in neurotypical samples.
We also observed a correlation in the relative FDs of sex-DE genes and ASD-DE genes that extends beyond the asdM16V
module, such that genes expressed more highly in typical male cortex also tend to be more highly expressed in ASD cortex, while genes more highly expressed in typical female cortex also tend to be expressed at lower levels in ASD cortex24. Again, we emphasize this agreement in fold change direction between sex and ASD status is not likely the result of a male-confounded analysis by Voineagu et al.24 or Gupta et al.23, as cases and controls were sex balanced, and any potential sex effects were also regressed out in those studies. Interestingly, the gene expression patterns we observe fit squarely with hypotheses derived from both the extreme male brain theory and from the concept of female protective factors in ASD: male-DE (ASD-upregulated) genes could act to increase risk, while female-DE (ASD-downregulated) genes could have protective functions. However, we caution that FDs do not indicate the underlying mechanism of gene regulation (that is, active upregulation in males can return the same result as repression in females). We cannot yet conclude that parallel expression differences between the sexes and in ASD are derived from the same regulatory mechanisms, but this work provides a starting point for their study. Additional experiments that include sufficient numbers of cases and controls of both sexes will be necessary to tease apart how sex and ASD status interact to affect gene expression, for example, to determine whether male-DE genes are expressed at even higher levels in ASD cases.
Astrocyte and microglial markers are also reliably enriched among male-DE genes in both adult and prenatal cortex. We recognize two possible explanations for this: (1) a greater proportion of astrocytes and microglia to neurons in male cortex results in higher measured gene expression in males; or (2) males’ cortical astrocytes and microglia are more transcriptionally active than females’. Aside from early, tenuous observations of greater cortical neuron density in males44, sex differences in the cellular composition of human cortex have not been sufficiently characterized to determine if there is a greater number of certain glial subtypes in male cortex. In contrast, there is clear evidence for sexually dimorphic astrocyte morphology in animals, particularly in hypothalamic nuclei, with male astrocytes showing a greater number of longer and more branched processes45–47. In addition, sex steroid hormones may play a role in astrocyte differentiation and regulation, as oestrogen receptors are expressed in hypothalamic and hippocampal astrocytes48,49, and female animals exposed to testosterone neonatally show male-typical astrocyte morphology46. Given the participation of astrocytes in the modulation of neurotransmission50,51 and of microglia and astrocytes in synapse formation and function52–55, it is plausible that sexual dimorphisms in astrocyte and/or micro-glia number or function would lead to sex-differential effects on neuronal connectivity56. It is also interesting to consider that numerous ASD risk genes function at the synapse7,9,57–59, and that as a third synaptic component along with pre- and postsynaptic neurons, sexually dimorphic astrocytes and/or
microglia are well positioned to broadly influence the effects of upstream, heterogeneous risk variants.
We also acknowledge several limitations of our study. First, our analyses utilize gene expression data from the human cerebral cortex, a region that other studies have indicated is a convergent area where many ASD risk genes likely exert their action30,31. However, other brain regions not sampled in our data sets, such as the hypothalamic nuclei, are known to be robustly sexually dimorphic60. It may be that ASD risk genes are differentially expressed by sex in these sexually dimorphic regions, or that it is the connections between these regions and other parts of the brain where the sex-differential risk-modulatory mechanisms act (as opposed to purely within-cortex interaction at the level of molecular pathways and local cell–cell connections). Assessment of additional brain regions, including hypothalamic nuclei and other subcortical structures, in sufficiently powered test and replication sets will be useful for addressing this important question, once such data are available.
The mechanism(s) of the sex-biased expression observed here are not known, but present significant opportunities for understanding ASD’s sex-biased pathogenesis. For example, transcription of sex-DE genes identified here may be regulated by sex-differential factors, such as transcription factors from the sex chromosomes, or by sex steroid receptor binding to hormone response elements upstream from transcription start sites. Chromatin immunoprecipitation experiments in human neural tissue coupled with functional assays in model systems will be needed to thoroughly characterize binding sites for these regulatory elements throughout the genome.
Alternatively, the sex differences we have observed may not result from differential transcription regulation, but instead from sex differences in the proportions of different neural cell types within male and female tissue. The overlap between male-DE genes and astrocyte and microglial marker genes is consistent with this possibility, although the processes that lead to sex differences in cell type proliferation or differentiation are unclear. Quantitative histological studies of male and female human brain will be critical to characterize the extent to which cell type composition differs between the sexes, and neurodevelopmental follow-up will be required to demonstrate how these differences arise.
The extent to which the convergent transcriptional changes previously observed in ASD cortex23,24 represent causal aetio-logies versus consequences of brain dysfunction also remains to be delineated61. In the case of ASD-associated co-expression modules enriched for risk variants, such as asdM12V, enrichment
of genes carrying ASD risk variants provides evidence for a causal, primary role in ASD aetiology. However, ASD-associated co-expression modules that lack enrichment for genetic risk variants, such as asdM16V, may be linked to ASD in one of
several ways: (1) They reflect direct downstream consequences of variants in, or dysregulation of, primary, ‘causal’ genes (for example, asdM12V) that actively participate in the
patho-physiological processes that shape and maintain an autistic-functioning brain; (2) they represent risk pathways that are independent of primary risk genes, for example, consequences of an environmental exposure, that also actively participate in ASD’s aetiology; or (3) they exemplify consequences of living with ASD to the brain, which may modify the presentation of ASD or its comorbidities, but that do not have a role in ASD’s aetiology. For example, the gene expression signature captured by non-variant-enriched, co-expression module asdM16V, which is upregulated
in post-mortem adult autistic cortex, may reflect the impact of chronic social stress experienced across the lifespan. If male and female brains respond differently to stress62, then the concor-dance we observe between these gene expression signatures may
be tangential to ASD’s primary pathophysiology. Though, one would expect that such stress would be cumulative over the lifespan, so that a stress-driven gene expression profile would increase with experience and age. Neither of the ASD-associated co-expression modules is significantly correlated with age23,24, making this explanation less likely. Nevertheless, extensive characterization of animal models of ASD genetic risk variants, including gene expression patterns, may help to determine whether expression signatures like these are purely consequential, or if they are evident during early development and play a role in ASD aetiology.
In any case, the sex-DE patterns that we observe in multiple, independent samples demonstrate that currently identified ASD risk genes are not innately sex-differentially expressed in the developing or adult human cerebral cortex. Instead, it is the molecular, cellular or circuit-level context in which ASD risk genes operate that is likely responsible for modulating ASD liability in a sex-differential manner. This notion fits with the remarkable consistency of the male bias in ASD prevalence, despite ongoing evidence of considerable genetic heterogeneity in ASD. Study of astrocyte–neuronal and microglia–neuronal synapse interactions, and study of the causes and functional consequences of higher expression of astrocyte and microglial genes in male brain and synaptic genes in female brain, are needed to determine how sex-differential functioning of these pathways impact sexually dimorphic risk for a variety of neurodevelopmental disorders, including ASD.
Methods
Adult BrainSpan data set.Developmental RNA-seq data from the BrainSpan project28summarized to Gencode 10 (ref. 41) gene-level reads per kilobase million
mapped reads (RPKM) were used. Data were normalized for GC content, using conditional quantile normalization63, batch-corrected for processing site using ComBat64and log
2-transformed (log2(RPKMþ1)). Samples from regions of the
frontal, temporal and parietal cortex from subjects aged 13–40 years, with RNA integrity number (RIN) of at least 8.0, were retained for this analysis. Non-expressed genes defined as having a log2-transformed RPKM expression level of o1 in more than 50% of all male or female samples were removed. Outlier samples were identified by evaluating inter-sample correlations and hierarchical clustering, first within each sex, and then on the full data set (samples of both sexes considered together); samples with inter-sample correlations42.5 s.d.’s from the mean were removed. The data were then quantile normalized to mitigate the effects of systematic differences in the distribution of expression levels across samples on the differential expression analysis results. After gene filtering and outlier removal, 72 samples (29 from males and 43 from females) and 16,843 expressed genes remained. To balance the male and female sample sets, we then matched a subset of the female samples to the male samples by age and brain region, and again filtered for expressed genes. The final data set consisted of 58 samples from 10 subjects (29 samples from 5 subjects of each sex; Supplementary Table 1) and 16,392 genes (Supplementary Data 1).
Adult replication data set.The adult replication sample comprised seven frontal and temporal cortex samples from five male individuals matched to seven cortical samples from five female individuals with no history of neuropsychiatric or neuro-logical diagnoses. Male and female samples were matched for age, post-mortem interval (PMI) and brain region. These samples were a subset of a larger set acquired from the Harvard Brain and Tissue Bank and the Eunice Kennedy Shriver National Institute for Child Health and Human Development Brain and Tissue Bank for Developmental Disorders following the tissue acquisition policies of the respective brain banks.
Approximately 100 mg of tissue from each sample was dissected on dry ice; RNA isolations were performed using the miRNeasy kit (Qiagen), RNA quality was quantified using the RIN65and ribosomal RNA was depleted using the Ribo-Zero Gold kit (Epicentre). Remaining RNA was then size selected with AMPure XP beads (Beckman Coulter) and re-suspended, and sequencing libraries with indexed adaptors were prepared according to the Illumina TruSeq protocol. Fifty base-pair, paired-end reads were generated on a HiSeq 2000/2500, with 24 samples pooled per lane.
Reads were mapped to the human reference genome (hg19) using Gencode v18 annotations with TopHat2, allowing for up to 10 multiple mappings per read41,66. Output BAM files were filtered to ensure that every read had a valid pair, resulting in only paired-end reads (fragments) being used for downstream analyses. Transcript levels were quantified using Gencode v18 gene models at the union gene
model level using HT-seq Counts67. We normalized these data for GC content biases using the cqn package in R (ref. 63), which resulted in log2(normalized
FPKM) values, and ensured that there were no sample outliers with a summed sample correlationZ-score42 (ref. 68). Genes not expressed in the subset of neurotypical samples selected for these analyses were identified (log2-transformed
FPKM expression levelo1 in more than 50% of all male or female samples) and removed. Outlier samples with inter-sample correlations42.5 s.d.’s from the mean, either within each sex or within the complete sample set, were removed. The expression data for the remaining samples were then quantile normalized. The final filtered data set consisted of 13 samples from 10 subjects (Supplementary Table 1), and 19,354 genes (Supplementary Data 1).
Prenatal data set.Exon array data analysed by Kanget al.29and downloaded
from the Gene Expression Omnibus (GSE25219) were used for the assessment of prenatal gene expression. Only samples from subjects between 16 and 22 post-conception weeks from the frontal, temporal and parietal cortex, and with RIN of 8.0 or greater were used in this stage of analysis.
Probe set IDs from the downloaded data were matched to Ensembl Gene IDs from Gencode 10 using the biomaRt function in R. Non-expressed genes were defined as those genes with a log2-transformed median probe set intensity ofo6 in 480% of male or female samples within the selected sample set, and were removed. Outlier samples were detected by evaluating inter-sample correlations and hierarchical clustering within each sex and within the complete data set, and samples with inter-sample correlation42.5 s.d.’s from the mean were removed. Expression data for the remaining samples were quantile normalized. After these processing steps, 142 samples (43 from males and 99 from females) and 9,985 expressed genes remained. To balance the number of male and female samples for analysis, we then matched a subset of the female samples to the male samples on age and brain region, and again filtered for expressed genes. The final data set consisted of 86 samples from 8 subjects (43 samples from 4 subjects of each sex; Supplementary Table 1), and 9,889 genes (Supplementary Data 1).
Differential expression analysis.Differential expression analyses for all data sets were performed using a linear mixed model and Bayesiant-tests as implemented in LIMMA69, a robust method for analysing small samples. For all analyses, the main
contrast in the regression model was sex, and subject was included as a random effect to account for the non-independence of samples from the same individual brain (that is, different brain regions). Covariates were included, where available, in the model as fixed effects: RIN, age, PMI, cortical lobe and pH for the adult BrainSpan data; RIN, age, PMI and cortical lobe for the replication data; and RIN, age, PMI, cortical lobe and pH for the prenatal data. Per-subject average values were substituted for missing PMI and pH information. Genes with a FD magnitude of 1.2 or greater and an unadjustedPvalue of 0.005, 0.01 or 0.05 were called as differentially expressed by sex (sex-DE; Supplementary Data 1).
Annotation gene sets.ASD candidate genes were selected from the SFARI Gene Autism Database32and filtered to those genes classified as syndromic (category S)
or with evidence levels between 1–4 for a set of 153 genes. To also investigate a risk gene set based on evidence from an unbiased, experimental screen, we used the set of genes with rarede novovariants (RDNVs) in sporadic ASD cases from exome sequencing of families from the Simons Simplex Collection8. All genes with
RDNVs in autistic probands were compiled and classified as protein-disrupting (nonsense, splice site or frameshift mutations), missense or silent variants. Here we use the gene set with protein-disrupting variants (353 genes) and the expanded gene set with either protein-disrupting or missense variants (1,771 genes). We also evaluated the set of transcripts that are binding targets of FMRP, a functionally defined gene set that is enriched for ASD risk genes70. Here we tested the 725
human orthologues of FMRP target genes as characterized in mouse brain33
(Supplementary Data 2).
Seven gene sets with ASD-associated expression patterns in adult human cortex were also tested. From a 2011 study by Voineaguet al.24, we tested genes expressed
at significantly (1) higher (FDZ1.2,q-valueo0.1, 88 genes) or (2) lower levels in ASD than in control cortex (125 genes); (3) ASD-associated, unsigned co-expression modules from weighted gene co-co-expression network analysis, asdM12V
(downregulated in ASD, 414 genes); and (4) asdM16V(upregulated in ASD, 361
genes). From a 2014 study by Gupta and colleagues23that used a larger, but overlapping, sample of individuals as Voineaguet al.24, but which analysed BA19, a
different cortical region, we tested several ASD-associated weighted gene co-expression network analysis modules, including (5) asdM1G(downregulated in
ASD, 1,643 genes), (6) asdM6G(upregulated in ASD, 667 genes) and (7) asdM5G
(upregulated in ASD, 759 genes) (Supplementary Data 2).
Since gene expression patterns in the brain often reflect the transcriptional activity of distinct neural cell types39,40, we also culled gene sets marking different cell types from several studies in the literature. From a microarray study of sorted cell types in mouse forebrain26, we tested markers for neurons (1,489 genes),
oligodendrocytes (1,626 genes) and astrocytes (1,968 genes). From a microarray study of human microglial cells in culture25, we tested genes with at least a twofold
upregulation in activated, microglia-enriched, mixed glial cultures (B60% microglia) (773 genes). From a single-cell RNA-seq study of mouse somatosensory
cortex and hippocampus27, we tested markers for CA1 pyramidal neurons (355 genes), S1 pyramidal neurons (235 genes), interneurons (319 genes),
oligodendrocytes (397 genes), astrocytes
(216 genes), microglia (368 genes), endothelial cells (312 genes), ependymal cells (402 genes) and mural cells (pericytes and vascular smooth muscle cells, 137 genes) (Supplementary Data 4).
Recent evidence has also suggested complementary roles for microglia and immune cells in mediating behaviour in male versus female animals38. To evaluate whether adaptive immune cells contribute to the sex-differential gene expression that we observe in the brain, we tested co-expression modules generated by the Immunological Genome Project from mouse haematopoietic cells that are associated with T- and B-cell lineage regulator genes34: T-cell module 18 (106 genes); gamma delta T-cell module 65 (30 genes); gamma delta, natural killer T and T4 module 56 (58 genes); alpha beta T-cell module 57 (52 genes); B-cell module 33 (125 genes); B-cell module 61 (38 genes); and B-cell module 76 (15 genes; Supplementary Data 5).
For the enrichment analyses, we used the following gene sets as background: for SFARI candidate genes, genes with RDNVs in ASD cases and activated microglial markers, we used expressed genes with a Gencode biotype annotation of ‘protein coding’; for gene sets with ASD-associated expression patterns and for immune cell markers, we used expressed genes also tested in the corresponding source publication23,24,34; and for FMRP target genes33and cell type markers from Cahoyet al.26and Zeiselet al.27, we used the genome-wide set of one-to-one
human–mouse orthologues as background (Supplementary Data 8).
For all background and gene sets of interest, gene identifiers were converted to Ensembl Gene IDs in Gencode using the biomaRt package in R to allow for unambiguous comparisons between genes from different data sources. Gene set membership, background set membership and sex-DE categorization for all expressed genes tested for differential expression in the three data sets are recorded in Supplementary Data 9.
Over-representation analysis.To evaluate the enrichment of gene sets of interest among sex-DE genes, we applied a two-sided Fisher’s exact test separately to sex-DE gene sets expressed more highly in males (male-DE) and in females (female-DE) at threePvalue thresholds (unadjustedPo0.005, 0.01 and 0.05, Supplementary Data 3, 6 and 7) in R.Pvalues from the Fisher’s exact tests run within each data set were adjusted for 62 tests performed against the 31 gene sets of interest (4 ASD risk gene sets, 7 ASD expression gene sets, 13 neural cell type marker sets and 7 adaptive immune cell marker sets) at each of the three sig-nificance levels for the sex-DE input genes.
To further investigate patterns of sexually dimorphic expression within each gene set of interest without applying arbitrary thresholds to define sex-DE genes, we also assessed the distribution of the genes in each set into two mutually exclusive categories: higher expression in males (positive log2(fold difference), at
anyPvalue); or higher expression in females (negative log2(fold difference), at any
Pvalue). We then applied a two-sided binomial test against the distribution of male-higher and female-higher genes in the corresponding background gene set (Supplementary Data 3, 6 and 7).Pvalues from all binomial tests within each data set were Bonferroni-corrected for the 31 gene sets tested.
References
1. American Psychiatric Association.Diagnostic and Statistical Manual of Mental
Disorders5th edn (American Psychiatric Association, 2013).
2. Wingate, M.et al.Prevalence of autism spectrum disorder among children aged 8 years—Autism and Developmental Disabilities Monitoring Network, 11 sites, United States, 2010.MMWR Surveill. Summ.63,1–21 (2014).
3. Hallmayer, J.et al.Genetic heritability and shared environmental factors among twin pairs with autism.Arch. Gen. Psychiatry68,1095–1102 (2011). 4. Constantino, J. N., Zhang, Y., Frazier, T., Abbacchi, A. M. & Law, P. Sibling
recurrence and the genetic epidemiology of autism.Am. J. Psychiatry167,
1349–1356 (2010).
5. Ozonoff, S.et al.Recurrence risk for autism spectrum disorders: a Baby Siblings Research Consortium study.Pediatrics128,e488–e495 (2011).
6. Abrahams, B. S. & Geschwind, D. H. Advances in autism genetics: on the threshold of a new neurobiology.Nat. Rev. Genet.9,341–355 (2008). 7. De Rubeis, S.et al.Synaptic, transcriptional and chromatin genes disrupted in
autism.Nature515,209–215 (2014).
8. Iossifov, I.et al.The contribution of de novo coding mutations to autism spectrum disorder.Nature515,216–221 (2014).
9. Sanders, S. J.et al.Insights into autism spectrum disorder genomic architecture and biology from 71 risk loci.Neuron87,1215–1233 (2015).
10. Sanders, S. J.et al.De novo mutations revealed by whole-exome sequencing are strongly associated with autism.Nature485,237–241 (2012).
11. Fombonne, E. Epidemiology of pervasive developmental disorders.Pediatr. Res.
65,591–598 (2009).
12. Werling, D. M. & Geschwind, D. H. Sex differences in autism spectrum disorders.Curr. Opin. Neurol.26,146–153 (2013).
13. Zhao, X.et al.A unified genetic theory for sporadic and inherited autism.
Proc. Natl Acad. Sci. USA104,12831–12836 (2007).
14. Robinson, E. B., Lichtenstein, P., Anckarsater, H., Happe, F. & Ronald, A. Examining and interpreting the female protective effect against autistic behavior.Proc. Natl Acad. Sci. USA110,5258–5262 (2013).
15. Jacquemont, S.et al.A higher mutational burden in females supports a ‘female protective model’ in neurodevelopmental disorders.Am. J. Hum. Genet.94,
415–425 (2014).
16. Bailey, Jr D. B.et al.Autistic behavior in young boys with fragile X syndrome.
J. Autism Dev. Disord.28,499–508 (1998).
17. Jamain, S.et al.Mutations of the X-linked genes encoding neuroligins NLGN3 and NLGN4 are associated with autism.Nat. Genet.34,27–29 (2003). 18. Stone, J. L.et al.Evidence for sex-specific risk alleles in autism spectrum
disorder.Am. J. Hum. Genet.75,1117–1123 (2004).
19. Werling, D. M., Lowe, J. K., Luo, R., Cantor, R. M. & Geschwind, D. H. Replication of linkage at chromosome 20p13 and identification of suggestive sex-differential risk loci for autism spectrum disorder.Mol. Autism5,13 (2014).
20. Skuse, D. H. Imprinting, the X-chromosome, and the male brain: explaining sex differences in the liability to autism.Pediatr. Res.47,9–16 (2000).
21. Baron-Cohen, S. The extreme male brain theory of autism.Trends Cogn. Sci.6,
248–254 (2002).
22. Baron-Cohen, S.et al.Elevated fetal steroidogenic activity in autism.Mol. Psychiatry20,369–376 (2014).
23. Gupta, S.et al.Transcriptome analysis reveals dysregulation of innate immune response genes and neuronal activity-dependent genes in autism.Nat.
Commun.5,5748 (2014).
24. Voineagu, I.et al.Transcriptomic analysis of autistic brain reveals convergent molecular pathology.Nature474,380–384 (2011).
25. Albright, A. V. & Gonzalez-Scarano, F. Microarray analysis of activated mixed glial (microglia) and monocyte-derived macrophage gene expression.
J. Neuroimmunol.157,27–38 (2004).
26. Cahoy, J. D.et al.A transcriptome database for astrocytes, neurons, and oligodendrocytes: a new resource for understanding brain development and function.J. Neurosci.28,264–278 (2008).
27. Zeisel, A.et al.Brain structure. Cell types in the mouse cortex and hippocampus revealed by single-cell RNA-seq.Science347,1138–1142 (2015). 28. BrainSpan Consortium. BrainSpan: Atlas of the Developing Human Brain.
Available: http://www.brainspan.org (2013) [Accessed 31 October 2013]. 29. Kang, H. J.et al.Spatio-temporal transcriptome of the human brain.Nature
478,483–489 (2011).
30. Parikshak, N. N.et al.Integrative functional genomic analyses implicate specific molecular pathways and circuits in autism.Cell155,1008–1021 (2013). 31. Willsey, A. J.et al.Coexpression networks implicate human midfetal deep
cortical projection neurons in the pathogenesis of autism.Cell155,997–1007 (2013).
32. Basu, S. N., Kollu, R. & Banerjee-Basu, S. AutDB: a gene reference resource for autism research.Nucleic Acids Res.37,D832–D836 (2009).
33. Darnell, J. C.et al.FMRP stalls ribosomal translocation on mRNAs linked to synaptic function and autism.Cell146,247–261 (2011).
34. Jojic, V.et al.Identification of transcriptional regulators in the mouse immune system.Nat. Immunol.14,633–643 (2013).
35. Trabzuni, D.et al.Widespread sex differences in gene expression and splicing in the adult human brain.Nat. Commun.4,2771 (2013).
36. Vawter, M. P.et al.Gender-specific gene expression in post-mortem human brain: localization to sex chromosomes.Neuropsychopharmacology29,373–384 (2004).
37. Yang, X.et al.Tissue-specific expression and regulation of sexually dimorphic genes in mice.Genome Res.16,995–1004 (2006).
38. Sorge, R. E.et al.Different immune cells mediate mechanical pain
hypersensitivity in male and female mice.Nat. Neurosci.18,1081–1083 (2015). 39. Oldham, M. C.et al.Functional organization of the transcriptome in human
brain.Nat. Neurosci.11,1271–1282 (2008).
40. Winden, K. D.et al.The organization of the transcriptional network in specific neuronal classes.Mol. Syst. Biol.5,291 (2009).
41. Harrow, J.et al.GENCODE: producing a reference annotation for ENCODE. Genome Biol.7(Suppl 1): S4 1–S4 9 (2006).
42. Smail, P. J., Reyes, F. I., Winter, J. S. D. & Faiman, C. The fetal hormonal environment and its effect on the morphogenesis of the genital system. In Pediatric AndrologyVol. 7 (eds Kogan, S. J. & Hafez, E. S. E.) 9–19 (Martinus Nijhoff, 1981).
43. Niemi, M., Ikonen, M. & Hervonen, A. inCiba Foundation Symposium— Endocrinology of the Testis (Colloquia on Endocrinology)Vol. 16 (eds Wolstenholme, G. E. W.) 31–55 (Wiley, 1967).
44. Rabinowicz, T., Dean, D. E., Petetot, J. M. & de Courten-Myers, G. M. Gender differences in the human cerebral cortex: more neurons in males; more processes in females.J. Child Neurol.14,98–107 (1999).
45. Mong, J. A., Kurzweil, R. L., Davis, A. M., Rocca, M. S. & McCarthy, M. M. Evidence for sexual differentiation of glia in rat brain.Horm. Behav.30,
46. Mong, J. A. & McCarthy, M. M. Steroid-induced developmental plasticity in hypothalamic astrocytes: implications for synaptic patterning.J. Neurobiol.40,
602–619 (1999).
47. Mong, J. A. & McCarthy, M. M. Ontogeny of sexually dimorphic astrocytes in the neonatal rat arcuate.Dev. Brain Res.139,151–158 (2002).
48. Azcoitia, I., Sierra, A. & Garcia-Segura, L. M. Localization of estrogen receptor beta-immunoreactivity in astrocytes of the adult rat brain.Glia26,260–267 (1999).
49. Sakuma, S., Tokuhara, D., Hattori, H., Matsuoka, O. & Yamano, T. Expression of estrogen receptor alpha and beta in reactive astrocytes at the male rat hippocampus after status epilepticus.Neuropathology29,55–62 (2009). 50. Bezzi, P.et al.Prostaglandins stimulate calcium-dependent glutamate release in
astrocytes.Nature391,281–285 (1998).
51. Perea, G., Navarrete, M. & Araque, A. Tripartite synapses: astrocytes process and control synaptic information.Trends Neurosci.32,421–431 (2009). 52. Haber, M., Zhou, L. & Murai, K. K. Cooperative astrocyte and dendritic spine
dynamics at hippocampal excitatory synapses.J. Neurosci.26,8881–8891 (2006).
53. Hama, H., Hara, C., Yamaguchi, K. & Miyawaki, A. PKC signaling mediates global enhancement of excitatory synaptogenesis in neurons triggered by local contact with astrocytes.Neuron41,405–415 (2004).
54. Muller, C. M. & Best, J. Ocular dominance plasticity in adult cat visual cortex after transplantation of cultured astrocytes.Nature342,427–430 (1989). 55. Schafer, D. P.et al.Microglia sculpt postnatal neural circuits in an activity and
complement-dependent manner.Neuron74,691–705 (2012).
56. McCarthy, M. M., Todd, B. J. & Amateau, S. K. Estradiol modulation of astrocytes and the establishment of sex differences in the brain.Ann. NY Acad. Sci.1007,283–297 (2003).
57. Auerbach, B. D., Osterweil, E. K. & Bear, M. F. Mutations causing syndromic autism define an axis of synaptic pathophysiology.Nature480,63–68 (2011). 58. Gilman, S. R.et al.Rare de novo variants associated with autism implicate a
large functional network of genes involved in formation and function of synapses.Neuron70,898–907 (2011).
59. Sakai, Y.et al.Protein interactome reveals converging molecular pathways among autism disorders.Sci. Transl. Med.3,86ra49 (2011).
60. Allen, L. S., Hines, M., Shryne, J. E. & Gorski, R. A. Two sexually dimorphic cell groups in the human brain.J. Neurosci.9,497–506 (1989).
61. Parikshak, N. N., Gandal, M. J. & Geschwind, D. H. Systems biology and gene networks in neurodevelopmental and neurodegenerative disorders.Nat. Rev.
Genet.16,441–458 (2015).
62. Kirschbaum, C., Kudielka, B. M., Gaab, J., Schommer, N. C. & Hellhammer, D. H. Impact of gender, menstrual cycle phase, and oral contraceptives on the activity of the hypothalamus-pituitary-adrenal axis.Psychosom. Med.61,154–162 (1999). 63. Hansen, K. D., Irizarry, R. A. & Wu, Z. J. Removing technical variability in
RNA-seq data using conditional quantile normalization.Biostatistics13,
204–216 (2012).
64. Johnson, W. E., Li, C. & Rabinovic, A. Adjusting batch effects in micro-array expression data using empirical Bayes methods.Biostatistics8,118–127 (2007).
65. Schroeder, A.et al.The RIN: an RNA integrity number for assigning integrity values to RNA measurements.BMC Mol. Biol.7,3 (2006).
66. Trapnell, C., Pachter, L. & Salzberg, S. L. TopHat: discovering splice junctions with RNA-Seq.Bioinformatics25,1105–1111 (2009).
67. Anders, S., Pyl, P. T. & Huber, W. HTSeq—a Python framework to work with high-throughput sequencing data.Bioinformatics31,166–169 (2014). 68. Oldham, M. C., Langfelder, P. & Horvath, S. Network methods for describing
sample relationships in genomic datasets: application to Huntington’s disease. BMC Syst. Biol.6,63 (2012).
69. Smyth, G. K. inBioinformatics and Computational Biology Solutions Using R and Bioconductor. (eds Gentleman, R., Carey, V., Huber, W., Irizarry, R. & Dudoit, S.) 397–420 (Springer, 2005).
70. Iossifov, I.et al.De novo gene disruptions in children on the autistic spectrum.
Neuron74,285–299 (2012).
Acknowledgements
We acknowledge data resources from the BrainSpan consortium (http://brainspan.org; 5RC2MH089921 to Ed Lein). This work was supported by the US National Institute of Mental Health grants (5R37MH060233 and 5R01MH094714, D.H.G.), an Autism Center for Excellence network grant (9R01MH100027) and NRSA and NIMH training fellow-ships (F31MH093086, D.M.W.; F30MH099886 and T32MH073526, N.N.P.). We also thank members of the Geschwind laboratory as well as Dr Stephan Sanders for helpful discussions and suggestions.
Author contributions
D.M.W. and D.H.G. designed the study and interpreted the results; D.M.W. performed data processing and all differential expression and over-representation analyses; N.N.P. ran the preprocessing for the adult replication data set and contributed code for over-representation analyses; D.M.W. drafted the manuscript with assistance from D.H.G. and input from N.N.P.
Additional information
Accession codes:Gene expression data analysed in this study come from publicly available resources (adult BrainSpan RNA-seq data, www.brainspan.org; prenatal array data, GEO accession GSE25219; and adult replication RNA-seq data, GEO accession GSE76852). Computer code used in this study is available on request.
Supplementary Informationaccompanies this paper at http://www.nature.com/ naturecommunications
Competing financial interests:D.H.G. serves on the scientific advisory board for SynapDx. The remaining authors declare no competing financial interests.
Reprints and permissioninformation is available online at http://npg.nature.com/ reprintsandpermissions/
How to cite this article:Werling, D. M.et al.Gene expression in human brain implicates sexually dimorphic pathways in autism spectrum disorders.Nat. Commun.7:10717 doi: 10.1038/ncomms10717 (2016).
This work is licensed under a Creative Commons Attribution 4.0 International License. The images or other third party material in this article are included in the article’s Creative Commons license, unless indicated otherwise in the credit line; if the material is not included under the Creative Commons license, users will need to obtain permission from the license holder to reproduce the material. To view a copy of this license, visit http://creativecommons.org/licenses/by/4.0/