HIGH RESOLUTION SIMULATION OF LOW LEVEL JETS IN THE EASTERN AMAZONIA
Júlia C. P. Cohen1, Leonardo D. A. Sá 2, 3, Daniele S. Nogueira1, Adilson. W. Gandu4 (1) Departamento de Meteorologia da Universidade Federal do Pará
(2) Centro de Previsão de Tempo e Estudos Climáticos, Instituto Nacional de Pesquisas Espaciais (3) Museu Paraense Emílio Goeldi
(4) Departamento de Ciências Atmosféricas da Universidade de São Paulo 1. INTRODUCTION
A particularly important research domain in the study of the atmospheric boundary layer is referred to the forest-atmosphere interaction (Shuttleworth, 1989), since the flow in the region immediately above the vegetation is complex and has characteristics still not well known. One of these characteristics is the existence, in some situations, of relative maxima in the wind velocity vertical profiles, the “low level jets” (LLJ), in regions less than 1 km distant from the surface (Poulos et al., 2002). They may contribute to intensify the mixture in the surface and in the region where they occur (Mahrt, 1999). It is possible that the presence of such phenomenon introduce additional difficulties in the parameterization of the forest-atmosphere exchange processes. Therefore, it is entirely reasonable the study of LLJs in order to determine the conditions of their occurrence and to investigate the consequences of their existence in the characteristics of the Nocturnal Boundary Layer (NBL) structure near the surface.
Corresponding author address : Julia Cohen, Departamento de Meteorologia, Centro de Geociências, Universidade Federal do Pará. CP 8708, Belém, PA, Brasil CEP 66075-110; e-mail: [email protected]
The first experiments carried out in the Amazon Forest contributed considerably to the comprehension of many important processes that occur in the region’s atmospheric boundary layer (Shuttleworth, 1989; Gash and Nobre, 1997; Silva Dias et al., 2002). Nevertheless, there are aspects referred to NBL processes that still need more investigation, such as the correct fluxes estimate (Howell e Sun, 1999; Von Randow et al., 2002), the influence of gravity waves and low level jets on the surface-atmosphere exchanges and the turbulence structure inside the forest canopy (as proposed by Fitzjarrald e Moore, 1990). These aspects are very important for a precise determination of the CO2 balance in the Amazon Forest.
2. MATERIAL AND METHODOLOGY
The data were collected during the Field Experiment called CiMeLA (Mesoscale Circulations in the Eastern Amazonia), from October 27 to November 17 of 2003, at the ECFP (Ferreira Penna Scientific Station), located northeast from Caxiuanã bay, in the Forest Reserve of Caxiuanã, Pará. The width of this bay is about 2 km and it seems to have an important role in the occurrence of the observed phenomena.
During this Experiment, the measurements were vertical soundings of the
atmosphere with radiosondes VAISALA RS 80, launched at four different times per day (06, 12, 18, 00 UTC), except in the last three days of the Experiment, when there were soundings in every 3 hours (keeping the times above).
2.1. Numerical Experiment Description
Recently, the atmospheric model RAMS (Regional Atmospheric Modeling System) (Cotton et al., 2003) was adapted to the Brazilian characteristics. Thus, it received the denomination of BRAMS (Brazilian developments on the Regional Atmospheric
Modeling System). It includes prognostic equations for temperature, water vapor, liquid water (cloud and rain), the three wind speed components and 5 ice species (Tripoli and Cotton, 1982; Tremback, 1990; Walco et al., 1995). Therefore, BRAMS was used to evaluate the origin of the LLJ.
The numerical simulations presented contained 3 nested grids with a horizontal spacing of 45, 15 and 5 km. The horizontal matrices include 35x35x32 points for grid 1, 38x38x32 points for grid 2 and 44x44x45 for grid 3 (Figure 1).
(a) Grid 1 (b) Grid 2
(c ) Grid 3
Figure 1 – Map of grids 1, 2 and 3, with the modeled region and the main rivers. The point represents the position of Caxiuanã.
The vertical resolution was variable with an initial spacing of 100m in the lowest layer of the model, increasing upward by the factor of 1,2 until the vertical spacing reaches 1000m, which is then maintained to the top of the model (approximately 22 km). In the model, 12 soil layers were defined until the depth of 4m. The vegetation coverage distribution used was produced by CPTEC (Sestini et al., 2002).
The model’s initialization was variable, each 6 hours, with the analysis of CPTEC’s global model, the radiosondes and the available surface data. The integration period was 48 hours, initiating on November, 12, 2003, at 12 UTC. The simulation used the models of surface and vegetation, radiation, cloud microphysics, Grell’s deep convective parameterization (Grell e Dévény, 2002) and shallow convection parameterization (Souza e Silva, 2003).
3. RESULTS AND DISCUSSION
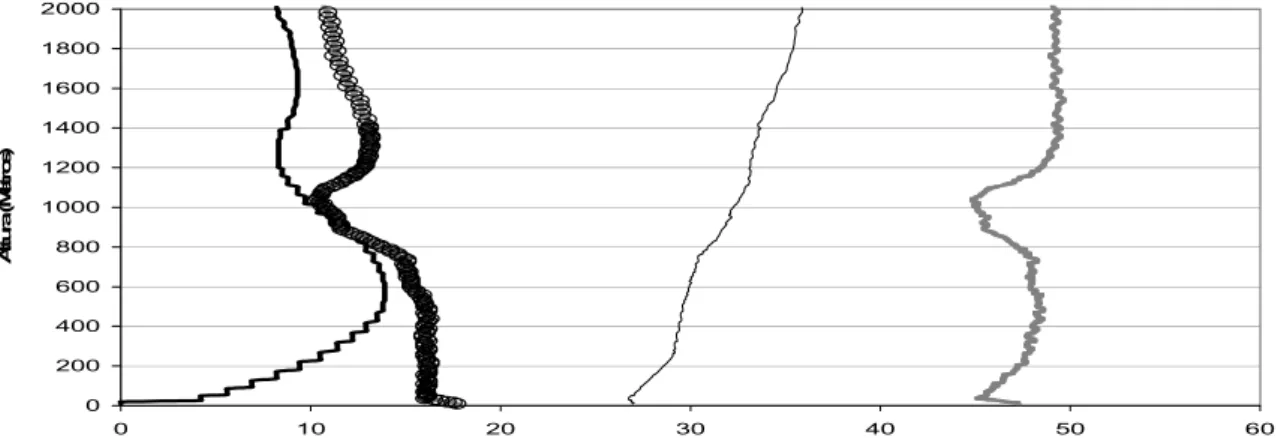
3.1. Observational aspects of the Low Level Jets The vertical profiles of wind, mixing ratio and virtual potential temperature for one of the most intense LLJs events can be observed in
Figure 2. The LLJs show their influence in the mixing ratio profile, in the region below the maximum speed level. However, the virtual potential temperature profile seemed to be less influenced by their presence. Furthermore, it is interesting to emphasize that the jets direction is always northeast. This suggests that the origin of the high humidity concentration observed below the jet may be associated to a water vapor advection from the bay (located in the Northeast from ECFP, Caxiuanã) to the Forest Reserve. Additionally, the jet action would be responsible for a mixture of humidity from the surface to the jet height. As a consequence, there would be a reduction in the radiative loss near the surface, in order to avoid that the lower part of the surface boundary layer increases its nocturnal stability indices.
Another interesting result was that the equivalent potential temperature indicated the arrival of thermodynamically different air possibly associated to the LLJ, because the decrease level of θe coincides with the maximum wind speed. The θe profile is similar to the mixing ratio profile. Both present a decrease in the same level, which indicates the arrival of drier air.
0 200 400 600 800 1000 1200 1400 1600 1800 2000 0 10 20 30 40 50 60 A lt u ra ( M et ro s)
Figure 2 – Vertical profiles (from the left to the right) of the following variables: wind speed (m/s); mixing ratio (g/kg); virtual potential temperature (K); equivalent potential temperature (K) in Caxiuanã on October, 29 of 2003.
3.2. Discussion about BRAMS results
The temporal vertical distribution of the wind speed obtained from the radiosondes launched at each 3 hours in Caxiuanã and that produced by the BRAMS model are presented in Figure 3. The numerical simulation reproduced both LLJs of November 13 and 14 at, 06 UTC.
However, their magnitude was about 2 and 3 m/s lower and their height was higher than what was observed. For the coast of Pará, Souza (2005) observed that BRAMS super estimated the selected LLJ speed in 3%. This was possibly due to superficial instability and roughness problems in the model.
(a) Radiosondes
(b) BRAMS
Figure 3 – (a) Observed wind magnitude and (b) simulated wind magnitude by the model BRAMS, with the presence of LLJs on November 13 and 14 of 2003, at 06 UTC.
The non-exact reproduction of the observed data by the simulations may be due to many factors, such as: the imperfection of the surface processes parameterizations and the imperfection of the clouds parameterizations. This is particularly considerable in the NBL above complex terrain or above regions that present important horizontal heterogeneities. Monti et al. (2002) discussed the problems not still solved related to the turbulent diffusivities parameterizations above complex terrain and they reported that this problem becomes more difficult in nocturnal conditions.
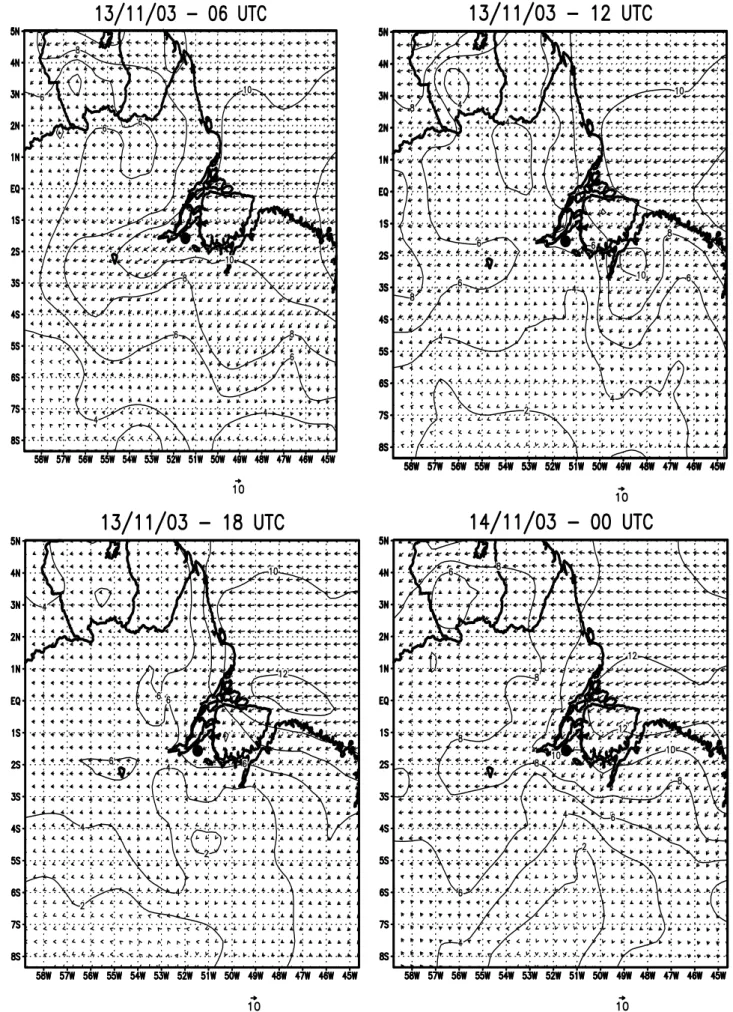
In order to verify the origin of the LLJ, the variability of the wind at the jet level, during the numerical simulation in grid 1, was analyzed. In the afternoon, it was observed the increase in wind speed at the Atlantic Coast associated to sea breeze circulation. Nonetheless, at 00 UTC, this maximum speed center penetrated the continent and reached the region of Caxiuanã. Indeed, this circulation was under a canalization effect due to the rivers distribution. On November 13, the sea breeze formed again. However, the circulation on this day was relatively weak.
Figure 4 – Horizontal wind magnitude temporal evolution generated by BRAMS, at 632 m, near the LLJ level.
4. CONCLUSIONS
The numerical simulations with this high resolution model indicated the occurrence of low level jets. Nevertheless, it did not reproduce in detail some of the observed characteristics of the flow. An important aspect revealed by the simulations with BRAMS was the origin of the jets, which is associated to canalization phenomena of the flow above zones where there are some of the great rivers in the Northeast of Pará.
5. ACKNOWLEDGEMENTS
This research was financed by the Program-PPG7/FINEP/MCT, process nº 64.99.0425.00, by MCT and CNPq/PADCT, through the Instituto do Milênio, with the Projects nº 62.0056/01-0, and nº 620065/01-0 and by FADESP/SECTAM/PRONEX, contract nº 1082. Daniele Nogueira thanks CNPq for the undergraduate research assistantship, process nº 103934/03-0; Leonardo Sá thanks CNPq (for the productivity in research assistantship, process 306769/2004-2 and by the assistance of the Edital Universal, process 481340/2004-1); the authors thank all the participants of the Field Experiment CIMELA, Museu Paraense Emílio Goeldi for the assistance in the Experiment and to the School of Earth, Environmental and Geographical Sciences (SEEGS) – University of Edinburgh for the support to the project. The authors thank Dr. Regina Alvalá that allowed the access to the vegetation files used in this study. 6. REFERENCES
Cotton, W. R.; Pielke, R. A. ; Walko, R.L. ; Liston, G. E. , Tremback, C. J. , Jiang, H. ;
Mcanelly, R. L.; Harrington, J. Y.; Nicholls, M. E.; Carrio, G.G.; Mcfadden J. P., 2003: RAMS2001 : Current status and future directions. Meteo. Atmos. Phy. , 82, 5-29.
Fitzjarrald, D. R. and Moore, K. E., 1990: Mechanisms of Nocturnal Exchange Between the Rain Forest and the Atmosphere. J. Geophys. Res., 95, D10: 16839-16850.
Gash, J.H.C. and Nobre, C. A., 1997: Climatic Effects of Amazonian Deforestation: Some Results from ABRACOS. Bull. Amer. Meteor. Soc., 78, 823-830.
Grell, G.A. and Deveny. A., 2002: A generalized approach to parameterizing convection combining ensemble and data assimilation techniques.
Geophys. Res. Letters., 29, 38.1-38.4.
Howell, J. F., Sun, J., 199: Surface-Layer Fluxes in Stable Conditions, Bound.-Layer Meteor., 90, 495-520.
Mahrt, L, 1999: Stratified Atmospheric Boundary-Layers, Bound.-Layer Meteor., 90, 375-396. Monti. P.., Fernando H. J. S., Princevac M., Chan W. C., Kowalewski T. A. and Pardyjak, E. R., 2002 : Observations of Flow and Turbulence in the Nocturnal Boundary Layer over a Slope,
Jour. Atmos. Sc. 59, 2513-2534.
Poulos, G.S., Blumen, W., Fritts, D.C., Lundquist, J.K, Sun, J., Burns, S.P, Nappo, C., Banta, R., Newsom, R., Cuxart, J., Terradellas, E., Balsley, B. E Jensen, M., 2002 : CASES-99: A comprehensive investigation of the stable nocturnal boundary layer. Bull. Amer. Meteor. Soc., 83, 4: 555-581.
Sestini M. F., Alvalá R. C. S., Mello E. M. K., Valeriano D. M., Chan C. S., Nobre C.A., Paiva J. A. C and Reimwe E. S., 2002 : Vegetation maps development for use in meteorological and hydrological models. INPE-8972-PQ/730. Shuttleworth, W., J., 1989 : Micrometeorology of temperate and tropical forest", Philosop. Transac. Roy. Soc. London, series B, 324, 1223: 299-334.
Silva Dias, M. A. F. S., Rutledge S., Kabat, P., Silva Dias, P., Nobre, C. A., Fisch, G., Dolman, H., Zipser, E., Garstang, M., Manzi, A., Fuentes, J., Rocha, H. , Marengo,J., Plana-Fattori, A., Sá, L. D. A., Alvalá R. C. S., Andreae, M., Artaxo, P., Gielow, R. and Gatti, L., 2002: Clouds and rain processes in a biosphere atmosphere interaction context in the Amazon Region, Jour. Geophys. Res. 107, D20: 46.1-46.23.
Sousa, P. E., Silva, E. M., 2003: Impacto da Implementação de uma parametrização de convecção rasa em um modelo de mesoescala. Descrição e teste de sensibilidade do esquema. Rev. Bras Meteor. 18, 33-42.
Sousa, A. M. L., 2005: Estudo Observacional de Jatos de Baixos Níveis no Litoral Norte e Nordeste do Pará Durante o Período Chuvoso e Seco. Master Dissertation, University Federal of Pelotas, 140pp.
Tremback, C. J., 1990 : Numerical simulation of a mesoscale convective Complex: model development and numerical results. Ph.D dissertation, Atmospheric Science, Colorado sate University, 247 pp.
Tripoli, G. J., Cotton W. R., 1982 : The Colorado State University three-dimensional cloud/mesoscale model - 1982. Part I: General theoretical framework and sensitivity experiments. J. Rech. Atmos., 16, 185-219, 1982.
Von Randow, C., Sá, L. D. A., Prasad, G. S. S. D., Manzi, A. O., Arlino, P. R. A. and Kruijt, B., 2002: Scale Variability of Atmospheric Surface Layer Fluxes of Energy and Carbon over a Tropical Rain Forest in Southwest Amazonia. I. Diurnal Conditions, Jour. Geophys. Res., 107, D20: 29.1-29.12, 4.
Walko R. L., Cotton W. R., Meyers M. P., Harrington J.H., 1995: New RAMS cloud microphysics parameterization, Part I: the single-moment scheme. Atmos. Res 38:29-62.