Volume 2019
Article 37
6-2019
Integration of Building Energy Modeling (BEM)
and Building Information Modeling (BIM):
Workflows and Case Study
Mahsa Farid Mohajer
University of Massachusetts Amherst
, [email protected]
Ajla Aksamija
University of Massachusetts - Amherst
, [email protected]
Follow this and additional works at:
https://scholarworks.umass.edu/btes
Part of the
Architectural Technology Commons
This Paper is brought to you for free and open access by ScholarWorks@UMass Amherst. It has been accepted for inclusion in Building Technology Educator's Society by an authorized editor of ScholarWorks@UMass Amherst. For more information, please [email protected].
Recommended Citation
Farid Mohajer, Mahsa and Aksamija, Ajla (2019) "Integration of Building Energy Modeling (BEM) and Building Information Modeling (BIM): Workflows and Case Study,"Building Technology Educator's Society: Vol. 2019 , Article 37.
DOI: https://doi.org/10.7275/bn9j-e183
Integration of Building Energy Modeling (BEM) and Building
Information Modeling (BIM): Workflows and Case Study
Mahsa Farid Mohajer, Ajla Aksamija
University of Massachusetts, Amherst, MA, United States
Abstract
Building Energy Modeling (BEM) intends to quantify buildings’ energy performance to help designers and architects better understand the environmental impacts of their decisions. Building Information Modeling (BIM) refers to a digital, model-based representation, where information about building design can be shared among different stakeholders and used during all stages of buildings’ lifecycle. The purpose of this research was to investigate integration of BEM and BIM, using one modeling and two analysis tools. Green Building Studio (GBS) and Sefaira are two performance analysis software programs, which can be used both in the form of BIM plug-in/built-in tools, as well as web applications to analyze and quantify energy performance of buildings. To capture their level of integration with BIM, an existing Campus Recreation Building on UMass Amherst campus was used as a case study to evaluate modeling processes, requirements, and workflows. Comparative analysis between modeled and actual energy consumption data was also performed to analyze accuracy of the different simulation programs. This paper discusses each tool capabilities and drawbacks in providing accurate energy analysis procedures and results.
Introduction
Understanding buildings’ energy performance and the environmental impact has been a central theme in building technology research, education and professional work over the past two decades. However, integration of
Building Information Modeling (BIM) and Building Energy Modeling (BEM) is a new concept, requiring significant research and development (Augenbroe et al. 2004; Senave and Boeykens 2015). BIM process creates a digital prototype of a building in 3D format, including integrated information about the design, materials, specifications and construction methods. BIM offers significant advantages throughout every step of buildings’ lifecycle. Design issues can be addressed and improved earlier in the design phases. Its 3D modeling capabilities allow improvement in construction planning, and easy access for facility managers to detailed information about building systems, thus supporting building operation and maintenance. BEM, on the other hand, is a process of creating buildings’ energy models in order to capture and evaluate their energy performance and to quantify the impacts of design decisions on energy consumption. Integration of BIM and BEM tools has the potential to streamline design, documentation, and building performance analysis. However, integration not only requires streamlined incorporation of BIM and BEM tools, accuracy of analysis results is also crucial.
Literature Review
Energy consumption analysis and simulations are necessary for various building sustainability rating systems, such as Leadership in Energy and Environmental Design (LEED), developed by the U.S. Green Building Council (USGBC) (Kim and Anderson 2013). BIM-BEM integration from the early stages of architectural design is a crucial step towards energy
conservation and high-performance buildings (Aksamija 2013). With the integration of parametric design capabilities and BEM, multiple design scenarios can be rapidly and cohesively tested. BEM and parametric design have been integrated in a study to design a building facade (Aksamija 2018). This research investigated the workflow between Rhino as a 3D modeling tool, Grasshopper plugin as a parametric design program, Honeybee and Ladybug plugins as parametric performance simulation tools. Ladybug connects Grasshopper to the EnergyPlus engine and Honeybee connects with different performance simulation engines: EnergyPlus, Radiance, and Daysim. Various geometry and performance parameters were tested, which allowed for numerous analyses and result comparisons (Aksamija 2018). In another study, energy performance simulation results from two BEM tools (Green Building Studio and EnergyPlus) were compared against the results of a proposed framework (Kim and Anderson 2013). The framework included: 1) BIM creation in ArchiCAD, 2) extracting geometrical and spatial data through IFC file format, 3) 3D remodeling for a quick visual check using Google SketchUp, which has built-in Ruby programming language and can read the IFC input files, and 4) running DOE-2.2 simulation engine to compare results from this framework and results from GBS and EnergyPlus simulations. The results were comparable, considering various energy simulation engines, and also geometry/spatial information being reconstructed for the proposed framework (Kim and Anderson 2013). Therefore, interoperability capabilities of the tools, as well as ability to comprehensively represent buildings in a way that they really exist or will be built are paramount.
BEM Engines and Tools
Accuracy of BEM tools and their level of integration with BIM varies depending on their capabilities in providing an array of input options (Kim and Anderson 2013). There has been ongoing research on BEM tools and engines
aiming to develop and enhance more comprehensive simulation programs. DOE and EnergyPlus are the two widely used energy simulation engines. DOE was first developed by the U.S. Department of Energy in 1976, and the commonly used version of it, DOE-2.2, was last released in 2009 (Maile et al. 2007; Birdsall et al. 1990). EnergyPlus, the U.S. Department of Energy successor to DOE-2, was developed in 2001 aiming to incorporate DOE-2 features and heat transfer calculation capabilities (Kim and Anderson 2013).
Some of the predominant BEM tools are RIUSKA, GBS, eQuest, and DesignBuilder (Kim and Anderson 2013). RIUSKA was first developed in 1996 as a Graphical User Interface (GUI) for DOE-2.1 (Maile et al. 2007). GBS was first launched in 2004, and it later became an Autodesk-affiliated program that runs on DOE-2 engine (Autodesk n.d.). eQuest was developed by James J. Hirsch in 2005, and DOE-2.2 has been its analysis engine. However, recently, DOE-2.3 simulation engine has been introduced as the latest version, which will be a full replacement to DOE-2.2 in the future (Hirsch n.d.). This tool only supports DWG and gbXML input files, which each has its own limitations. DWG inputs enable importing of building’s footprint into eQuest, however, various floors cannot be distinguished. In addition, gbXML input files for complex geometries may result in simulation errors and issues (Maile et al. 2007). DesignBuilder, on the other hand, is an interface for EnergyPlus engine that allows for gbXML input files and was first introduced in 2005 (Thermal Energy System Specialists n.d.).
BIM-BEM Data Exchange Methods
Data exchange between BIM and BEM applications is not a seamless task and usually requires manual intervention and data transformation. The two predominant data exchange options are; Industry Foundation Class Extensible Markup Language (ifcXML) and green building Extensible Markup Language (gbXML), both supported by major BIM software developers.
Nevertheless, because of the interoperability shortages and energy analysis procedure being time-consuming, designers often leave it to electrical and mechanical engineers later in the design process. This results in less energy conscious and non-optimized designs (Kim and Anderson 2013; BuildingSMART n.d.).
Research Objectives and Methods
The purpose of this research was to investigate integration of BEM and BIM tools, specifically Green Building Studio (GBS) and Sefaira, as two different BEM programs that are compatible with Revit as a BIM application. The following objectives were addressed: 1. To investigate the two tested BEM tools by
comparing their modeling and simulation procedures and results.
2. To investigate GBS as a Revit built-in and as a web application.
3. To investigate Sefaira as a Revit plug-in and as a web application.
4. To investigate Revit in assigning thermal properties to its BIM model.
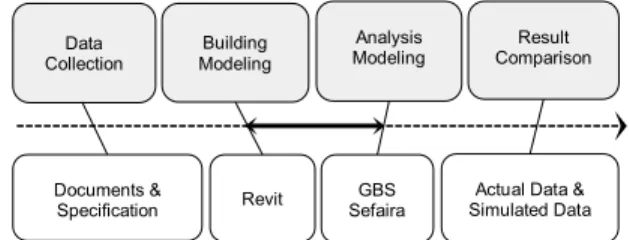
The research methods included data collection, modeling, simulations and comparative analysis of results. Research workflow is shown in Figure 1.
Case Study Introduction
For the purpose of this research, Campus Recreation Building on UMASS Amherst campus was selected as an existing case study building. Monthly electricity and steam consumption data was collected for a year-round
operation cycle in the year 2017. Results from each analysis software program were then compared to the
actual energy consumption data, used as the baseline
.
Inorder to provide a valid data comparison, all units were converted to kBtu. And, given the building area, Energy Usage Intensity (EUI) of the building was calculated. Building Information Modeling (BIM)-Autodesk Revit The original construction documentation for the case study building was collected and reviewed in order to create a 3D model in Autodesk Revit (as a BIM application), as shown in Figure 2.
Fig. 2. Case study building BIM model created in Revit. Following the building specifications, glazing types were assigned to windows and curtain walls as shown in Table 1.
In order to properly define building envelope thermal properties in Revit, thermal conductivity (λ) of some of the materials were extracted from ASHRAE Handbook
Table 1. Case study building glazing types used in the BIM model.
Glazing Type VT (Btu/h.ftU-Value 2.°F) SHGC
Double Glazing Low-E
Clear Glass 0.7 0.3 0.38 Double Glazing Low-E
Fritted Glass 0.39 0.3 0.24
Fig. 1. Research workflow.
Building Modeling
Analysis
Modeling ComparisonResult Data
Collection
Documents &
(ASHRAE 2013b). For other materials, based on their thicknesses (from the collected documents) and/or their R-values (from ASHRAE 90.1, and collected documents), thermal conductivity was determined as shown in Table 2 (ASHRAE 2016).
Table 2. Material thermal conductivity used in the BIM model.
λ1: Thermal conductivity applied in Revit
λ2: Thermal conductivity extracted form ASHRAE Handbook (ASHRAE 2013b)
Building envelope R-values in BIM was automatically calculated based on materials’ thermal conductivity and thickness inputs. These R-values were different from the add-up of layers’ R-values, which were calculated based on the following equation:
Equation 1. R-value calculation equation.
𝑅𝑅 − 𝑣𝑣𝑣𝑣𝑣𝑣𝑣𝑣𝑣𝑣=𝑇𝑇ℎ𝑣𝑣𝑒𝑒𝑣𝑣𝑣𝑣𝑇𝑇ℎ𝑖𝑖𝑖𝑖𝑖𝑖𝑖𝑖𝑣𝑣𝑖𝑖𝑖𝑖𝐶𝐶𝐶𝐶𝑖𝑖𝐶𝐶𝑣𝑣𝑖𝑖𝐶𝐶𝑖𝑖𝑣𝑣𝑖𝑖𝐶𝐶𝐶𝐶
This discrepancy between Revit-calculated/assigned R-values and add-up R-R-values for the building envelope is shown in Table 3. It is one of the BIM drawbacks since R-values are automatically assigned without providing the opportunity for users to edit values.
Building Energy Modeling (BEM) Tools-GBS and Sefaira
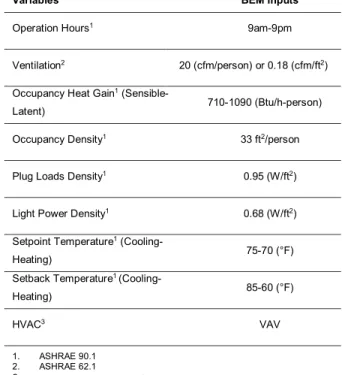
The focus of this research was on the application of two BEM tools: Green Building Studio (GBS) and Sefaira. GBS is a Revit built-in whole building energy analysis tool that runs on DOE.2 engine. Sefaira, on the other hand, runs on EnergyPlus analysis engine, and it is a plug-in program that needs to be installed within the BIM environment. Inputs for the BEM tools were collected from documents and building standard codes, as shown in Table 4 (ASHRAE 2016, 2013b, 2013a).
Table 4. BEM inputs taken from the building standard codes.
Building Envelope Add-up R-value(h.ft2.°F/Btu) Revit R-value (h.ft2.°F/Btu)
Brick Cavity Wall on Metal
Stud Framing 19.66 17.96 Metal Deck Roof 18.84 18.06
Material Btu/h.ft.°F λ 1 λ 2 Btu.in/h.ft2°F Thickness (inch) R-value h.ft2.°F/Btu GWB 0.09 1.12 0.63 0.56 EPS 0.02 0.20 2 10 Metal Plate 0.02 0.20 0.37 1.82 Cast in Place Concrete 0.64 7.69 6 0.78 Batt Insulation 0.03 0.32 6 19 Semi-rigid Fiberglass 0.02 0.24 4 17 Steel Deck 16 192 4 0.02 Grout 1.73 20.76 2 0.10
Variables BEM Inputs
Operation Hours1 9am-9pm
Ventilation2 20 (cfm/person) or 0.18 (cfm/ft2)
Occupancy Heat Gain1
(Sensible-Latent) 710-1090 (Btu/h-person) Occupancy Density1 33 ft2/person
Plug Loads Density1 0.95 (W/ft2)
Light Power Density1 0.68 (W/ft2)
Setpoint Temperature1
(Cooling-Heating) 75-70 (°F) Setback Temperature1
(Cooling-Heating) 85-60 (°F)
HVAC3 VAV
1. ASHRAE 90.1 2. ASHRAE 62.1
3. Building documents/specification
Table 3. Building envelope Revit-calculated and add-up R-values.
Simulation and Analysis Results
GBS as a built-in application in BIM allows for energy analysis within Revit without a need for data transferring. It is necessary to define energy settings and create an energy model directly in BIM, as shown in Figure 3, in order to run GBS analysis.
Figure 3. Green Building Studio (GBS) energy model created in Revit.
However, this built-in tool does not allow to assign detailed BEM inputs as indicated in Table 4. In addition, although the building typology was selected to be gymnasium in Revit’s energy setting, built-in GBS assigned it as an office. This indicated that the built-in GBS could not properly read data presented in BIM, which affected monthly/annual energy consumption data and EUI of the building.
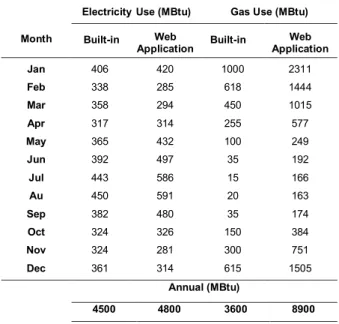
In order to assign necessary BEM inputs and to select the right building typology, BIM model had to be exported in gbXML file format from Revit, and imported into GBS web application. Results and comparison between the two energy analyses are shown in Table 5. As shown in the table, electricity usage did not change dramatically. However, gas consumption was significantly higher when simulated in GBS web application.
The case study building’s heating system used district steam, provided from the Central Heating Plant (CHP) distributed to various buildings on campus. Considering that CHP gas consumption data for the steam production
Table 5. Energy consumption comparison between GBS Revit built-in and GBS web-application.
purposes was not available, simulated-gas was compared against actual-steam consumption in this research. This steam vs. gas comparison is one of the deficiencies of the BEM tools since they do not provide a variety of possible heating sources and systems. Since energy efficiency of district steam-based HVAC systems is higher than the local gas-based system, it was expected that simulated monthly and annual gas consumption data to be higher than the actual steam usage (Rezaie and Rosen 2012). However, in the built-in GBS analysis, gas consumption was either close or lower than the steam usage, as shown in Table 6.
This confirmed that the built-in tool did not provide valid simulation results. As shown in Table 6, the overall monthly and annual gas consumption in GBS web application was higher than the actual steam usage. Given that the web application allowed for building typology selection, BEM inputs procedure, and it provided more precise gas consumption data, it was concluded that GBS web-based simulation is more valid than the built-in version.
Month
ElectricityUse (MBtu) Gas Use (MBtu) Built-in Web
Application Built-in ApplicationWeb Jan 406 420 1000 2311 Feb 338 285 618 1444 Mar 358 294 450 1015 Apr 317 314 255 577 May 365 432 100 249 Jun 392 497 35 192 Jul 443 586 15 166 Au 450 591 20 163 Sep 382 480 35 174 Oct 324 326 150 384 Nov 324 281 300 751 Dec 361 314 615 1505 Annual (MBtu) 4500 4800 3600 8900
Table 6. Actual steam usage vs. gas consumption data from GBS (built-in and web application).
Similarly, for Sefaira as a Revit plug-in application, input
data can only be adjusted through the Real Time Analysis
slider rather than assigning certain numbers. However, with Sefaira web-based application, exact input values can be inserted. For the purpose of this research and to apply certain BEM inputs, Sefaira was used in the form of web application. One other drawback of Sefaira was that it only presented a limited list of building typologies (for both the plug-in and web application), which did not include gymnasium or recreational building type. And, school was the closest option to choose for the purpose of energy consumption simulation. This was one of the major drawbacks of Sefaira analysis tool since building typology has a significant impact on energy consumption data due to various scheduling, occupancy, lighting, and equipment requirements.
BEM tools create their analysis models based on Rooms
assigned in 3D BIM model. They create an analysis model comprising of spaces and surfaces, which eventually affect building area calculations. In this research, even though the exact same BIM model was used to create BEM analysis models in GBS and Sefaira,
they both read it differently. This different BIM model treating impacted the calculation of building areas in BEM programs. For instance, in Sefaira, areas with less than
43 ft2 were ignored since they could crash EnergyPlus
analysis if included in the BEM model.
In Table 7, simulated monthly and annual energy (electricity and gas) consumption in GBS and Sefaira web applications are shown against the actual consumption data. GBS’s monthly and annual electricity consumption was close to the actual electricity usage data. Its gas consumption was higher than the actual steam usage. In contrast to GBS, Sefaira monthly and annual energy (electricity and gas) consumption was much lower than the actual data. Therefore, the calculated EUI was very low. However, GBS EUI was almost double of the actual EUI, which was due to gas vs. steam comparison, as well as different building area calculations.
Table 7. Energy simulation results (Sefaira and GBS) vs. actual energy usage in the case study building.
Month
Monthly Steam/Gas Use (MBtu) Actual
(Steam) Built-in (Gas) Web Application (Gas) Jan 967 1000 2311 Feb 663 618 1444 Mar 821 450 1015 Apr 465 255 577 May 386 100 249 Jun 236 35 192 Jul 163 15 166 Aug 160 20 163 Sep 333 35 174 Oct 430 150 384 Nov 502 300 751 Dec 869 615 1505 Annual (MBtu) 6000 3600 8900 Monthly Electricity
Usage (MBtu) Monthly Gas/Steam Usage (MBtu) Actual GBS Sef. Actual GBS Sef. Jan 360 420 164 967 2311 335 Feb 334 285 150 663 1444 284 Mar 335 294 174 821 1015 227 Apr 364 314 159 465 577 108 May 510 432 198 386 249 24 Jun 389 497 236 236 192 2 Jul 450 586 260 163 166 0.3 Aug 493 591 248 160 163 0.8 Sep 562 480 198 333 174 12 Oct 425 326 183 430 384 48 Nov 332 281 168 502 751 149 Dec 344 314 148 869 1505 247
Annual Usage (MBtu)
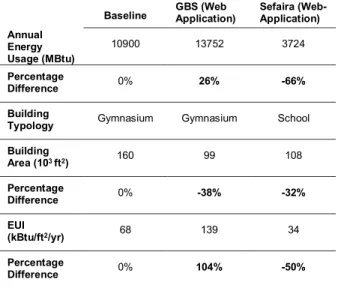
In Table 8, total annual energy consumption, building areas and types, EUI, and percentage differences are shown. Since the case study building was an existing building, its energy consumption data was used as a benchmark for the percentage differences calculations. Table 8. Baseline (actual) and simulations data comparison.
Discussion and Conclusion
Considering each BEM tool simulation procedure, and inability to properly define analysis models, it was concluded that neither of the investigated BEM tools was able to completely streamline design and analysis. They both were analysis tools within BIM Revit, which made their application easier, but not really integrated with this BIM application. Although GBS provided results that were closer to the actual data, it did not provide as detailed/precise BEM inputs as needed. For instance, district steam-based heating HVAC system was not an available input option for the analysis run. Comparison of GBS built-in results with that of web application did not indicate any gbXML data exchange/interoperability shortages since web results were closer to the actual energy performance. However, the BIM model was relatively a non-complicated 3D model. Research on more complicated models needs to be done to capture and investigate gbXML interoperability capabilities
between GBS and Revit. In addition, another important step toward more integrated and accurate energy analysis is that BEM tools provide users with the ability to assign multiple spaces within the same building. In this research, building typology of the case study was gymnasium, but it had several other room/space applications such as offices, restrooms, and even unconditioned spaces. Different space applications result in various energy consumptions in the same building, which eventually affects the overall energy consumption. Sefaira provided the option to assign multiple spaces, including conditioned and unconditioned for the simulation. However, the ending results were not accurate since building typology could not be assigned as it really was in reality. It indicated that building occupancy type had a more significant impact on energy performance aspects comparing to assigning multiple space applications. Therefore, selection of BEM tools depends on a variety of variables such as interoperability capabilities, accuracy of results, workflows and the ability to integrate with BIM. BIM-BEM integration main objective is to incorporate energy performance analysis in the early steps of architectural design. However, it is not yet possible for investigated BEM tools to seamlessly work well with BIM. It is necessary to manually manipulate energy models created from BIM, assign and override input data, and properly define design parameters.
Further research is needed to investigate various BEM applications and evaluate their integration capabilities
with BIM to improvethe current state of knowledge about
the BIM-BEM process. Results and findings of that research will provide a deeper understating of various tools, which can be used by a software developer company to develop a new tool that can improve interoperability, modeling capabilities and selection of inputs, as well as accuracy of results.
References:
1 Aksamija, Ajla. 2013. “Building Simulations and
High-Baseline GBS (Web Application) Sefaira (Web-Application) Annual Energy Usage (MBtu) 10900 13752 3724 Percentage Difference 0% 26% -66% Building
Typology Gymnasium Gymnasium School Building Area (103 ft2) 160 99 108 Percentage Difference 0% -38% -32% EUI (kBtu/ft2/yr) 68 139 34 Percentage Difference 0% 104% -50%
Performance Buildings Research: Use of Building Information Modeling (BIM) for Integrated Design and Analysis.” Perkins+Will Research Journal 05 (1): 19–38. 2 Aksamija, Ajla. 2018. “Methods for Integrating Parametric
Design with Building Performance Analysis.” ARCC Conference Repository, September.
https://doi.org/10.17831/rep:arcc%y459. 3 American Society of Heating, Refrigerating and
Air-Conditioning Engineers (ASHRAE). 2013a.
ANSI/ASHRAE Standard 62.1 Ventilation for Acceptable Indoor Air Quality. Atlanta: ASHRAE.
4 American Society of Heating, Refrigerating and Air-Conditioning Engineers (ASHRAE). 2013b. ASHRAE Handbook Fundamentals. Atlanta: ASHRAE. 5 American Society of Heating, Refrigerating and
Air-Conditioning Engineers (ASHRAE). 2016.
ANSI/ASHRAE Standard 90.1 Energy Standard for Buildings Except Low-Rise Residential Buildings. Atlanta: ASHRAE.
6 Augenbroe, Godfried, Pieter De Wilde, Hyeun Jun Moon, and Ali Malkawi. 2004. “An Interoperability Workbench for Design Analysis Integration.” Energy and Buildings 36 (8): 737–48.
https://doi.org/10.1016/j.enbuild.2004.01.049. 7 Autodesk. n.d. “Green Building Studio Features.” Green
Building Studio. Accessed January 20, 2019. https://gbs.autodesk.com/GBS/.
8 Birdsall, Bruce, Walter Buhl, Kathy Ellington, and Ahmet Erdem. 1990. “Overview of the DOE-2 Building Energy Analysis Program Version 2.1D.” Berkeley, CA. 9 BuildingSMART. n.d. “IFC Overview Summary.” International
Home of OpenBIM. Accessed January 20, 2019.
http://www.buildingsmart-tech.org/specifications/ifc-overview.
10 Hirsch, James J. n.d. “Building Energy Use and Cost Analysis Tool.” DOE-2. Accessed January 20, 2019. http://doe2.com/equest/index.html.
11 Kim, Hyunjoo, and Kyle Anderson. 2013. “Energy Modeling System Using Building Information Modeling Open Standards.” Journal of Computing in Civil Engineering
27 (3): 203–11. https://doi.org/10.1061/(ASCE)CP.1943-5487.0000215.
12 Maile, Tobias, Martin Fischer, and Vladimir Bazjanac. 2007. “Building Energy Performance Simulation Tools - a Life-Cycle and Interoperable Perspective.” Center for Integrated Facility Engineering. Stanford, CA. cife.stanford.edu/sites/default/files/WP107.pdf. 13 Rezaie, Behnaz, and Marc A Rosen. 2012. “District Heating
and Cooling : Review of Technology and Potential
Enhancements.” Applied Energy 93: 2–10. https://doi.org/10.1016/j.apenergy.2011.04.020. 14 Senave, Marieline, and Stefan Boeykens. 2015. “Link
between BIM and Energy Simulation.” Building
Information Modelling (BIM) in Design, Construction and Operations 149: 341–52.
https://doi.org/10.2495/BIM150291.
15 Thermal Energy System Specialists. n.d. “Designbuilder Software Product Overview.” DesignBuilder. Accessed January 20, 2019.
https://www.designbuilder.com/software/product-overview.