Microarray Gene Expression Data Mining
using High End Clustering Algorithm
based on Attraction-Repulsion Technique
Muhammad Rukunuddin Ghalib #1, D.K.Ghosh *2
#
School of Computing Science and Engineering, VIT University Vellore, Tamil Nadu, India
1
Karur, Tamil Nadu, India
Department of Mathematics, VSB Engineering College 2
Abstract—Microarray Gene expression data analysis is one of the key domains in the modern cellular
and molecular biology system design and analysis; shortly we called it computational simulation of genome-wide expression from DNA hybridization. We present here a high end clustering algorithm basically a technique following the inspiration led by natural attraction and the repulsion processes. It groups the similarly expressed genes in same clusters, co-expressed and differently expressed ones in different clusters. Most importantly, it takes into account of the outliers in an efficient manner by not allowing them to interfere with the similarly expressed gene clusters on the fly. In the first clustering process, it calculates the distances of all the genes in a proximity range set in prior, henceforth attracting all the least distant genes from the seed gene. Varying the proximity range in the subsequent run, repulse the maximally distant genes from the same cluster, thereby achieving a near to perfect cluster formation at the end. We include cluster validity testing using Hubert’s statistics technique, which shows a very optimal clusters validity result.
Keyword-Microarray data, Gene Expression Data, Clustering Algorithm, Cluster validity, Hubert’s Statistics
I. INTRODUCTION
The cut-throat advancement in genome-scale data analysis and sequencing has motivated high end development of different technology to exploit this information by paving a new face to the modern biology or in in a refined way, to the modern cellular and modern biology. The need for knowledge of every gene in a genome has enhanced the development of every technology in solving various medical issues, relating to genes and its functional outcomes in the human body [2][ 3][ 4][7]. Although the study were confined to yeast Saccharomyces cerevisiae in earlier days, but studies have found the similar tendency exist human also. Gene expression microarrays are one of the forerunners in today’s molecular simulation and DNA technology research [1]. As rightly pointed in [5] that “The burgeoning field of genomics, and in particular DNA microarray experiments, has revived interest in cluster analysis by raising new methodological and computational challenges”. DNA Microarray clustering experiments are widely carried out in medical research for various studies in functional and structural gene characteristics responsible for various tumors and cancers. Microarray experiments may lead to a finer and complete classification of genes responsible for cancers. The new challenges facing the recent microarray gene expression clustering experiments revolves around validity of the cluster, in short quality of the clusters formed, efficiency of the algorithm or the technique used to cluster or classify the genes, and the memory requirements in its computational environment constrained by various parameters, one of which is the era of big data analysis[22][20] We promote here a compact and near to maximum a novel complete clustering method motivated by the nature in terms of attraction and repulsions activities applicable to all events.
Cluster Analysis:
Cluster analysis is a different approach to well known data mining technologies like associations and classifications by producing the final clusters which has never a dependence relationship between the data points, and never use any prior cluster information in forming the target clusters except in unsupervised clustering[23][25]. The data points in given data space is clustered in such a way that the similarity between the data points in a cluster is maximum and minimum between different clusters. Here a random data object from the data space is selected in most of the technique and a similarity matrix is generated for all the data points from this seed datum by deploying a proximity measures like Euclidean distance, Manhattan distance, Spearman correlation, Jacknife correlation etc.[6][14][26]. So the clusters formed are the data groups from which we can
hierarchy formations of species. Clustering can be broadly divided into two categories, namely supervised and unsupervised clustering. In an unsupervised clustering, the number of clusters to be formed is unknown in prior. Supervised takes into account of a prior knowledge of the number clusters to be formed. Our approach tends towards unsupervised way of clustering [21][19].
II. RELATED WORK
Lot of work has been done on different proximity measurement techniques and cluster validity testing by few researchers in the past such as [15], [16], [17] and [18]. The distance measurement technique and the cluster validity measurement used here is a correlation based technique and Hubert’s Statistics as used in [16]. From this paper, its definition is given as follows:
Let X = [X (i,j)]and Y = [Y(i,j)] be two n x n proximity matrices on the same n genes. From the viewpoint of correlation coefficient, X (i ,j) indicates the observed correlation coefficient of genes i and j, and Y(i ,j) is defined in eqn (1):
1 if genes i and j areclustered in the same cluster ( , )
0 otherwise
Y i j =
(1)
The Hubert’s, Г statistic as in eqn (2) compute the correlation between the matrices X and Y, and it is defined as follows when the two matrices are symmetric:
1 1 1
1
n n( , )
( , )
i j i X YX i j
X
Y i j
X
M
σ
σ
− = = +
−
−
Γ =
∑ ∑
(2) Where, M = n(n-1)/2 is the number of entries in the double sum, and σ X and σ YIII. MATERIALS AND METHODS
denote the sample standard deviations, while X and Y denote the sample means of the entries of matrices X and Y.
The Experimental data we used are collected from the website of PNAS web site at (www.pnas.org) or at http://rana.stanford.edu/clustering. Data used here are formed on spotted DNA microarrays, for which the gene expression were studied during the diauxic shift[8][9] of budding yeast Saccharomyces cerevisiae [10]. We also used the data from Kim lab, Stanford university for our research purpose which is available in http://cmgm.stanford.edu/~kimlab/, [11].
Similarity Metric:
The similarity metric generated for clustering the genes is based on correlation coefficient. As given in [Eisen et al,1998]. Let Gi 1, 2 1, 1 ( , ) (3) , ( ) (4) i offset i offset i n A B i offset G i n A A B B S A B n where G G n = = − − = Ψ Ψ − Ψ =
∑
∑
be the log transformed primary data for gene G in condition i. For any two genes X and Y observed over a series of N conditions, a similarity score can be computed as given in eqn (3) and eqn (4):
When Goffset is set to the mean of observations on G, then G becomes the standard deviation of G, and S (A,B) is exactly equal to the Pearson correlation coefficient[14] of the observations of X and Y. Values of Goffset which are not the average over observations on G are used when there is an assumed unchanged or reference state represented by the value of Goffset
Methods:
, against which changes are to be analyzed. The software implementation of the above is found from the authors at http://rana.stanford.eduyclustering.
We apply the standard approach as in eqn (5) that is global analysis used in [12] to all the genes: 0
(
gj)
j ij ij(5)
i ME A
β
β
R
∈=
+
∑
where Agj is gene g’s observed expression level under condition j with j = 1; . . . ; J, E(Agj) represents Agj’s expected or average value, Rig is the binding ratio of TF i to (the control region of) gene g, and M is the set of TFs to be considered; 0j and ijs are unknown parameters (called regression coefficients) that are of interest
and to be estimated; ij gives the additive effects of TF i’s binding on each gene’s expression level under condition j. Note that ij
Gao et al., 2004[13] defined
is the same across all of the genes.
i = (i1, i2, . . . iJ )’ as the activity of TF i and the coupling strength between TF i and gene g as given in eqn (6):
1 2 2 1 1
(
)(
)
( , )
(
,
)
(6)
(
)
(
)
J ij i gj g j ij gj J J ij i gj g j jA
A
C i g
corr
A
A
A
β
β
β
β
β
= = =−
−
=
=
−
−
∑
∑
∑
Where,
β
i=
∑
Jj=1β
ijJ
andA
g=
∑
Jj=1A
gjJ
.An estimate of C (i, g) is obtained by plugging in any estimates of ijIV. EXPERIMENTAL DESIGN AND SETUP s.
We implemented the clustering algorithm, proposed here in MATLAB. The algorithm is designed in two phase. First phase works as the repulsive nature as given in[15] and the second phase continue with the attraction phase in tandem thereby making the gene cluster formation a highly inter related within the clusters and shows high degree of contrast across the clusters. This two phase design also enhances the easy segregation of outliers. In the first phase we use two legends as seed gene, Sg which is the initial cluster center. From this Sg, distances are calculated for all the Gij
We present here the two legends used in the first phase as follows: where i=0 to n and j=0 to m.
• Seed Gene (Sg) – This is the initial gene centre in the given gene space GijUg
• Lead Cluster(C
. The constraint here is that we set only one seed gene in a given point of time. Seed gene is dynamically changed as the iteration increases.
i)—We set a range, say [p,q] for the similarity matrix calculated for each genes, if a gene is near proximity of the Sg , the gene is attracted towards the Ci , and the distance the beyond the range set is repulsed to from the seed gene. The process continues till it forms the final clusters, Cfk, where k is the number of final clusters formed.
The algorithm is fed with two inputs namely, S(i,j) , the similarity matrix of n X n dimensions generated from the data set and a weight threshold, to determine the attraction and repulsion phenomena. We formulate a Max_Sim function to enhance the quality of the cluster by re clustering the final clusters formed if Max_Sim
in the same cluster. The time complexity of the algorithm is O (N2
Attraction and Repulsive Clustering algorithm:
). The pseudo code of both the phases of the algorithm is given below.
Input: (i) Similarity matrix S(i,j) which is of n X n dimensions. (ii) Weight threshold, to determine the attraction and repulsion phenomena.
Initialization: Lead Cluster (Ci
C(.) 0 // intial cluster is always zero
) 1 // initial cluster designation
GijUg // set of all gene data points
Seed Gene (Sg) //This is the initial gene centre in the given gene space
GijU
Begin:
g
Calculate distance from Sg to each gene data points, Gij
if S(G
where i=0 to n
and j=0 to m
i,j
Repulsion phase:
) , //distance comparison to threshold
S(Gi,j) , move the Gi,j to Cr
if S(G
//cluster formed by repulsion
Ci Cr Ck // move away from Cr
Increase the G
to form a different cluster
i,j
Continue // iteration
till i,j // where i=0 to n and j=0 to m
ReturnCr
Attraction Phase: // this is to improve the quality of the clusters formed in
attraction phase
//intermediate cluster result after repulsion phase
E Cr, // all the genes in the C
Calculate , Max_Sim // for reclustering phase
r
if Max_Sim,
then
Cnew
else
Cr // allows formation of new cluster
CFinal Cnew +C
Return C
r
End
Final
V. RESULT AND DISCUSSION
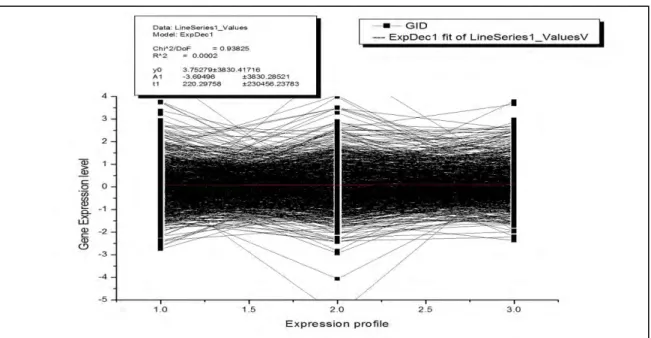
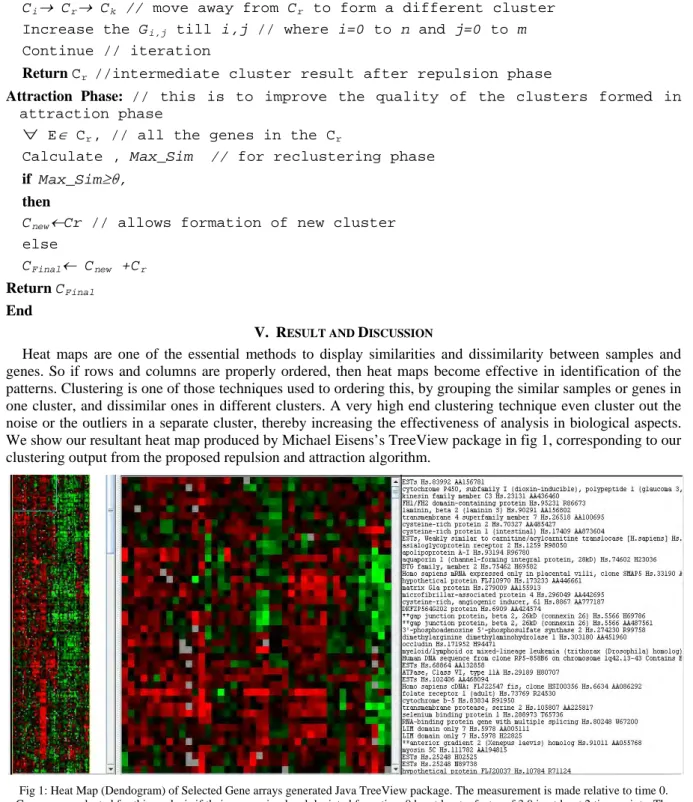
Heat maps are one of the essential methods to display similarities and dissimilarity between samples and genes. So if rows and columns are properly ordered, then heat maps become effective in identification of the patterns. Clustering is one of those techniques used to ordering this, by grouping the similar samples or genes in one cluster, and dissimilar ones in different clusters. A very high end clustering technique even cluster out the noise or the outliers in a separate cluster, thereby increasing the effectiveness of analysis in biological aspects. We show our resultant heat map produced by Michael Eisens’s TreeView package in fig 1, corresponding to our clustering output from the proposed repulsion and attraction algorithm.
Fig 1: Heat Map (Dendogram) of Selected Gene arrays generated Java TreeView package. The measurement is made relative to time 0. Genes were selected for this analysis if their expression level deviated from time 0 by at least a factor of 3.0 in at least 2 time points. The dendrogram and colored image were produced by using Java TreeView package; the color scale ranges from saturated green for log ratios 2.75279 and below to saturated red for log ratios 3.69496 and above. Each gene is represented by a single row of colored boxes; each time
point is represented by a single column. Gene data of budding yeast Saccharomyces cerevisiae collected from http://rana.stanford.edu/clustering is used.
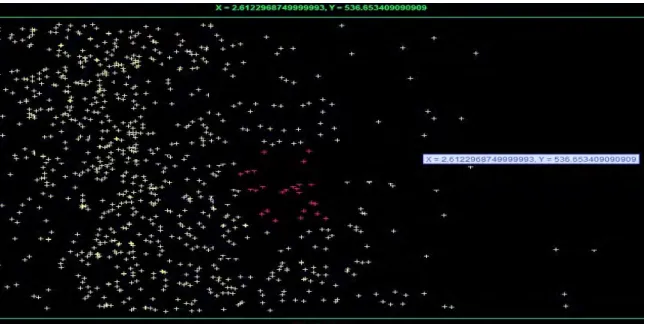
Similarly, the scatterplot of plot G_INDEX in X axis and 181_96 Adeno Gene Array in Y axis is also shown in fig 2 with controlled condition as Min X= -1.89, Min Y=0.0,Max X=3.9, Max Y=72.0 for the gene data we used in fig 1.
Fig. 2: Scatter plot G_INDEX in X axis and 181_96 Adeno Gene Array in Y axis
To ensure the quality of the clusters, we have use Hubert’s statistic technique for cluster validity checking and found its average Hubert’s statistic value as 0.7744483, in 29 clusters found. As its nearing to 1, it is considered good. We also carried out some comparisons between the validity measures like jaccard’s coefficient, simple matching technique and FOM (Figure of Merit) to clusters we found. The comparative graph of all the above techniques is shown in fig 3.
Fig 3: Cluster quality achieved for the different validity measurement techniques to the 28 clusters formed by attraction and repulsion algorithm.
It is noticed that jaccard coefficient works well with k-means clustering technique as variation of k is undetermined, but Hubert’s statistics work well with dynamic type of clustering like our attraction and repulsion algorithm. The same efficiency is also proved by the work of [16]. Simple matching technique has sharp uneven peaks for as much as 13 clusters, thereby local minima and global minima values get distorted. Hubert statistic values ranges from 0.39 to 0.94 in 28 cluster formed, averaging to 0.774, which is a good value for determination of quality in clusters formed. Function of Merit (FOM) also does well comparatively to Hubert statistics, except it ranges from 0.1 to 0.78 in all the clusters and lowering its average score to 0.53.
Additionally, our algorithm is also compared with one of the most dynamic clustering algorithms CST from [16] in terms of number of cluster formation. CST generated 38 clusters from the same gene expression data we used, which is shown in fig 4. Our attraction and repulsion based clustering algorithm generated 28 clusters, with 10 outlier’s cluster which is shown in fig 5.
Fig 4: Visual representation of cluster formed by CST [Vincent S. Tseng, Ching-Pin Kao, 2005] where 38 clusters are formed in our experimental data we have taken
Fig 5: Visual representation of cluster formed by and attraction and repulsion method where 28 clusters were formed in the same data used for generating the fig 4.
Table I shows the Log ratio and error function values for y0, A1, t1 parameters. Considering this table we show our cluster result in fig 6 which is plotted on log ratio and shift log ratio values.
Table I: Log ratio and Error table for y0, A1, t1 parameters
Parameter Log Ratio Error
y0 3.75279 3830.4172 A1 -3.69496 3830.2852
t1
220.29758 230456.24Like in most of the biological data, missing data are quite common in microarray gene expression data too. Two most common way of dealing with missing data are simply bringing some variation in our clustering algorithms to deal with or by generating the missed values by any of the missing value computational technique while in pre-processing phase, before the data is been fed to the clustering algorithm. As formulated in table I the error capabilities in our approach is considered for our experiment and the resultant clustering output is shown in figure 6.
Fig 6: A cluster result plotted on log ratio and shift-log ratio on the result of Repulsion and attraction based clustering algorithm. Data used here is from Kim Lab collected from http://cmgm.stanford.edu/~kimlab/.
VI. CONCLUSION
In this paper, we proposed a dynamic clustering algorithm for clustering gene expression data with in-built cluster validity technique for clustering gene expression data from budding yeast Saccharomyces cerevisiae. As anticipated, it resulted in optimal cluster formation with good quality cluster formation by achieving a Hubert’s statistic value of 0.77, comparatively to CST and K-Means algorithms. Although it compromised little bit in complexity function of the algorithm, nevertheless, it optimized the overall cluster formation and separating the outliers in different clusters.
We could improve in future this work by improvising the missing value calculation technique in a very formal way. We could also bring a variation by adopting various distance measurement techniques or by hybridizing them in some way. We seriously think of introducing rough and fuzzy set concepts for high dimensional clustering and optimized solutions to data fuzziness and missing values too.
ACKNOWLEDGMENT
The above work is supported by a young scientist grant from The Manipur Public Hospital and Research Institute (MPHRI/YSG/2011-RG.No.23) under the Principal Investigator of Dr.D.K.Ghosh. We thank Dr.Debi Prasanna Acharjya, SCSE-VIT University for his kind suggestions in improving the quality of this paper especially in the mathematical formulation part.
REFERENCES
[1] Brown, P. O. & Botstein, D. (1999). Exploring the new world of the genome with DNA microarrays. Nature Genetics 21, pages 33-37. [2] Schena, M., Shalon, D., Davis, R. W. & Brown, P. O. (1995) Science 270, Pages 467–470
[3] Velculescu, V. E., Zhang, L., Vogelstein, B. & Kinzler, K. W. (1995) Science 270, Pages 484–487.
[4] Lockhart, D. J., Dong, H., Byrne, M. C., Follettie, M. T., Gallo, M. V., Chee, M. S., Mittmann, M., Wang, C., Kobayashi, M., Horton, H., et al. (1996) Nat. Biotechnol. 14, Pages1675–1680.
[5] Sandrine, Fridlyand, (2002) “A prediction-based resampling method for estimating the number of clusters in datasets”, Genomebiology, 3(7), Research 0036. 1-0036.21.
[6] D. Jiang, C. Tang and A. Zhang, (2003)”Cluster Analysis for Gene Expression Data: A Survey”,dept. of CSE, State University of New York at Buffalo.
[7] Schena, M., Shalon, D., Heller, R., Chai, A., Brown, P. O. & Davis, R. W. (1996) Proc. Natl. Acad. Sci. USA 93, 10614–10619. [8] Shalon, D., Smith, S. J. & Brown, P. O. (1996) Genome Res. 6, Pages 639–645.
[9] DeRisi, J. L., Iyer, V. R. & Brown, P. O. (1997) Science 278, Pages 680–686
[10] Michael B. Eisen, Paul T. Spellman, Patrick O. Brown†,David Botstein(1998), Genetics Proc. Natl. Acad. Sci. USA, Vol. 95, pp. 14863–14868.
[11] S.Kim, Department of Developmental Biology, Stanford university, http://cmgm.stanford.edu/~kimlab/
[12] Peng Wei, Wei Pan, (2008)IEEE/ACM Transactions On Computational Biology And Bioinformatics, Vol. 5, No. 3, pages 401-405 [13] F. Gao, B.C. Foat, and H.J. Bussemaker,(2004) “Defining Transcriptional Networks through Integrative Modeling of mRNA
Expression and Transcription Factor Binding Data,” BMC Bioinformatics, vol. 5, pages. 31.
[15] Chyun-Shin Cheng , Shiuan-Sz Wang ,(2003), “A Repulsive Clustering Algorithm for Gene Expression Data”Proceedings of the Third IEEE Symposium on BioInformatics and BioEngineering (BIBE’03) 0-7695-1907-5/03
[16] Vincent S. Tseng and Ching-Pin Kao, (2005)” Efficiently Mining Gene Expression Data via a Novel Parameterless Clustering Method”, IEEE/ACM TCBB, Vol.2.No.4, PP355-365
[17] Ankur Mazumdar, Muhammad Rukunuddin Ghalib,(2011)“Qualitative and Quantitative metrics based analysis of Gene Expression Data Clustering Algorithms”,Intl. J. of Computer Information Systems, Vol II, Issue IV, Pages 44-48
[18] Muhammad Rukunuddin Ghalib, Ritwika Ghosh, Priti Saswal, Udisha Pande,(2013), “Microarray Gene Expression Analysis using Enhanced k-means Clustering Algorithm”, Intl. J of Advances in Engineering and Technology, Vol V, Issue II, Pages 373-380 [19] N. S. Holter, A. Maritan, M. Cieplak, N. V. Fedoroff, and J. R. Banavar,( 2001) “Dynamic modeling of gene expression data,” in Proc.
Nat. Acad. Sci., USA,, vol. 98, pp. 1693–1698.
[20] Muhammad Rukunuddin Ghalib, D.K.Ghosh (2010), “CSTuEPM:An Efficient Clustering Algorithm for Microarray Gene Expression Data”,Intl. J. of Advanced Research in Computer Science, Vol I, Issue IV, Pages 370-377.
[21] S. Huang, (1999)“Gene expression profiling, genetic networks, and cellular states: An integrating concept for tumorigenesis and drug discovery,” J. Molecular Med., vol. 77, pp. 469–480.
[22] K. Jain, M. N. Murty, and P. J. Flynn,(1999) “Data clustering: A review,” ACM Comput. Surveys, vol. 31, no. 3, pp. 264–323. [23] P. Kellam, X. Liu, N. Martin, C. Orengo, S. Swift, and A. Tucker, (2002)“A framework for modelling virus gene expression data,”
Intell. Data Anal., vol. 6, pp. 265–279.
[24] T. B. Kepler and T. C. Elston,(2001) “Stochasticity in transcriptional regulation: Origins, consequences, and mathematical representations,” Biophys. J., vol. 81, no. 6, pp. 3116–3136.
[25] S. Liang, S. Fuhrman, and R. Somogyi,(1998) “REVEAL: A general reverse engineering algorithm for inference of genetic network architectures,” in Proc. Pacific Symp. Biocomput., vol. 3, pp. 18–29.
[26] T. Liu, W. Sung, and A. Mittal,(2002) “Model gene network by semi-fixed Bayesian network,” Expert Syst. Appl., vol. 30, no. 1, pp. 42–49,
![Fig 4: Visual representation of cluster formed by CST [Vincent S. Tseng, Ching-Pin Kao, 2005] where 38 clusters are formed in our experimental data we have taken](https://thumb-us.123doks.com/thumbv2/123dok_us/11079903.2994374/6.892.128.768.107.418/visual-representation-cluster-formed-vincent-tseng-clusters-experimental.webp)