Peak Power Control for a QoS Capable On-Chip Network
Yuho Jin
1, Eun Jung Kim
1, Ki Hwan Yum
21
Texas A&M University
2University of Texas at San Antonio
{yuho,ejkim}@cs.tamu.edu [email protected]
Abstract
In recent years integrating multiprocessors in a single chip is emerging for supporting various scientific and commercial applications, with diverse demands to the underlying on-chip networks. Communication traffic of these applications makes routers greedy to acquire more power such that the total consumed power of the network may exceed the supplied power and cause reliability problems. To ensure high performance and power constraint satisfaction, the on-chip network must have a peak power control mechanism. In this paper, we propose a credit-based peak power control scheme to assure power consumption to be under the given peak power constraint, without performance degradation. The peak power control scheme efficiently regulates each flow’s injection rate at the sender to minimize performance penalty. We have two different throttling schemes for real-time traffic and best-effort traffic; a rate-based throttling and an energy-budget based throttling, respectively. The simulation results on mesh networks show that the credit-based peak power control effectively prevents performance degradation and meets the peak power constraint.
1. Introduction
Integrating multiple components in a single chip by the help of the network leverages modular design, layered protocols, and high performance, instead of global dedicated wiring between processing components [1]. As the number of components increases, the simple broadcast bus-based network is not favored any more, since it lacks performance, energy efficiency, and scalability [2]. For example, one request in bus-based interconnects monopolizes the ownership and induces high latency due to the centralized arbitration. Moreover, broadcast data transmission incurs unnecessary energy consumption at every receiver and the sharing of a bus limits the connectivity. However, a switch-based network can overcome these problems, structure components into tiles, and borrow many efficient techniques used in the interconnection network connecting multiple chips.
It is definitely true that the on-chip network has area and power constraints, since it must incorporate many processing components in a single chip. Planarity of a chip prefers 2-dimensional network topology. The reduced on-chip network area for switches and wires makes room for more transistors of processing components. The satisfaction of peak power consumption in a single chip is essential to maintaining supply voltage levels, to supporting reliability, to limiting capacity of heat sinks and to meeting affordable packaging costs [3]. Since the total power supplied to a chip is distributed to all the units of a chip, each unit should keep its power consumption below a preset upper limit. With the increasing demand for interconnect bandwidth, an on-chip network becomes the major power consumer in a chip. The power model of on-chip networks, Orion [5, 6], showed the significant power dissipation on the on-chip networks of two chip multiprocessors (CMPs): MIT Raw [7] and UT Austin TRIPS [8].
Multimedia applications on a System-on-Chip (SoC) are extensively being studied for bandwidth requirements over heterogeneous components of the network [10]. However, we are focusing on the QoS environment in the homogenous network such as chip multiprocessors. An on-chip network must support guarantee for the delivery of multimedia data (real-time traffic) as well as the normal message-oriented communication (best-effort traffic).
One of the approaches that provide QoS support in a communication network is to supply admission and congestion control to regulate the number of active connections and the number of injected packets in those connections [4]. Admission control determines the acceptance of a new connection in the network, based on the requirement of the new connection and the current resource capacity. If the acceptance of the new connection jeopardizes QoS guarantees of already established connections, admission control denies the new connection setup. Congestion control typically monitors the network load and intervenes when the network load reaches a certain threshold value indicating network congestion. A congestion control mechanism regulates traffic injection into a network to avoid network saturation, which may lead to performance degradation.
In this paper, we propose a credit-based peak power control to meet pre-specified power constraints while maintaining the service quality, by regulating injection of packets. We take different approaches for different traffic types. For real-time traffic, instead of throttling the injection of packets of already established connections, our scheme works by determining the acceptance of a new connection based on the requirement of the consumed power and the available power budget as in the case of admission control. We also show how to calculate the expected power consumption of a connection from its bandwidth requirement. For best-effort traffic, we calculate the required power of a packet based on the distance from its source to the destination. If the expected power consumption exceeds the power budget, we throttle the injection of the packet such as the congestion control. We compare our scheme with the existing peak power control scheme (PowerHerd [21]). Our evaluation on mesh networks shows that, even though PowerHerd is very efficient to satisfy peak power constraints, it incurs significant performance degradation in all ranges of workload. We also show that the proposed credit-based peak power control outperforms PowerHerd in terms of the average packet latency, while it satisfies peak power constraints as PowerHerd does.
This paper is organized as follows. In the next section, a brief review of the related work is presented. Section 3 explains the basic architectures of an on-chip network including routers and Injection Throttle Logic (ITL), and also the power models are discussed. The proposed credit-based peak power control technique is discussed in Section 4. Experimental results are shown in Section 5, while the last section summarizes the conclusions of the paper.
2. Related Work
Due to the pivotal role of the on-chip networks in both CMPs and SoCs, several power models have been proposed to analyze the behavior of power consumption. Patel, et al. first proposed the analytical power model for interconnection networks based on transistor counts [16]. Orion model presented a micro-architectural power model to estimate the average and the maximum power of on-chip networks [5]. Dynamic power consumption model with bit-level accuracy was explored in different switch fabrics in [17]. A common observation in the related research literature is that the buffers in a router are the main power consumers followed by the links.
Energy management and low power design on an on-chip network is still an ongoing research area. Recent techniques for energy efficiency in SoCs are summarized in [18]. The application-specific constrained design is
another direction in SoCs. Mapping components onto a network and structuring interconnects are explored in terms of energy efficiency [19], bandwidth requirement [10], and high resource utilization [20].
However, since it seems difficult to adapt chip multiprocessor design for a specific application, reconfiguration or control mechanism are required to overcome constraints. Recently, PowerHerd is proposed to dynamically regulate each router’s power consumption by throttling packet flow through a flow distribution mechanism to satisfy the given peak power constraint in the network [21]. In this scheme, each router estimates its power consumption, predicts the future demand, and shares its power budget with neighboring routers. In the MIT Raw chip targeting seamless integration of 1024 processors, each tile has one static router and two dynamic routers for different application traffic demands and properties [7].
3. System Architecture
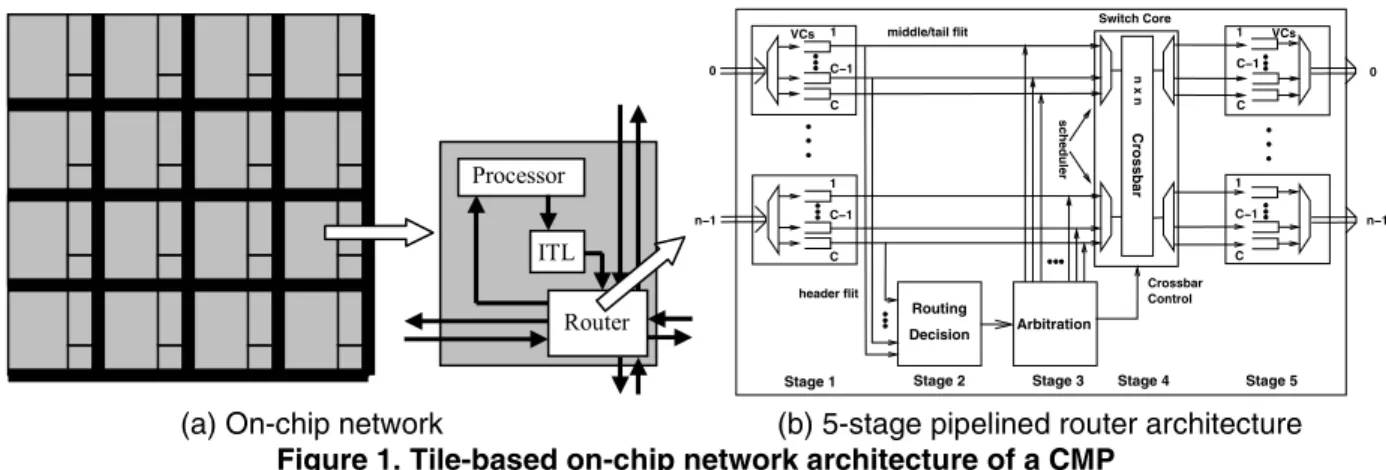
In this section we describe the on-chip network that includes the QoS capable wormhole router architecture and the Injection Throttle Logic (ITL) regulating the traffic pushed into the injection channel in Figure 1. The router is connected to neighbor routers through 4 physical links, to ITL through an injection link, and to the processor core through an ejection link on the mesh network architecture of a CMP. The energy model implemented in the on-chip network is also described.
3.1. QoS Capable Router Architecture
The fundamental function of a router is to receive flits through links from its attached hosts or neighboring routers and to forward the received flits to the adjacent routers according to the routing information stored in the header flits [14]. In Figure 1(b), Stage 1 synchronizes the incoming flits and demultiplexes them so that they can go to the proper Virtual Channel (VC) buffer to be subsequently decoded. For a header flit, routing decision and arbitration for the correct crossbar output is executed in the Stages 2 and 3. On the other hand, both middle and tail flits bypass these two stages. Flits get routed to the correct crossbar output in Stage 4. Finally, Stage 5 does buffering for flits flowing out of the crossbar, multiplexes the physical channel bandwidth amongst multiple VCs. Unlike traditional routers that use a FIFO scheduler, the QoS capable router used in this paper has a WRR (Weighted Round Robin) scheduler at the input ports of the crossbar in Figure 1(b) [11-14]. This 5-stage pipelined router outperforms the traditional routers especially when handling different types of traffic.
0 n−1 0 n−1 n x n Crossbar Switch Core middle/tail flit scheduler VCs 1 1 VCs Crossbar Control 1 C−1 C C−1 C C−1 C 1 C−1 C header flit Routing Decision Arbitration Stage 4 Stage 5 Stage 2 Stage 3 Stage 1
(a) On-chip network (b) 5-stage pipelined router architecture Figure 1. Tile-based on-chip network architecture of a CMP
It is noted that the buffer size in wormhole switching does not affect the performance severely. Thus we can exploit small buffers in the router to reduce power dissipation.
3.2. Injection Throttle Logic
The Injection Throttle Logic (ITL) regulates the injection rate of each traffic type, attached to each core (the processor), in order to meet the peak power constraint in Figure 1(a). To provide the separate regulation of two kinds of traffic, the ITL has the power budget register and the router has the bandwidth register. In addition, the unit of control is different for each type of traffic. First, the maximum power budget of the best-effort traffic for each router is initially stored to the budget register in the ITL. The ITL allows a best-effort traffic packet to enter into the network only when its power budget register has sufficient power. On the other hand, the bandwidth register of the router has the maximum bandwidth corresponding to the sustainable power of the real-time traffic. The ITL checks the bandwidth registers of the routers along the path at the connection establishment stage. Only does the ITL permit a new connection (instead of a unit of packet) if all of the relevant routers agree to make a room for it in their bandwidth budgets. In other words, ITL monitors its power budget register for best-effort traffic, while checking the routers’ bandwidth budget registers on the delivery path for real-time traffic.
3.3. Energy Model
The main components of the router are FIFO buffers, routing logic, crossbar and output port arbiter. We obtained the energy parameters of the router components from the HSPICE simulation in 180 nm technology under a supply voltage 1.8V. Each router has 16 VCs of 10-flit buffers for each input/output port and one flit is 256 bits long. In wormhole switching, the buffer size can be smaller than the packet size and, thus, the wormhole
router can have the smaller power requirement than the packet switching router. We assume that the link operates with 1GHz clock and its power consumption follows the model proposed in [23]. The main energy parameters are summarized in Table 1. In addition, the leakage power of both the router and the link is fairly smaller than the switching power.
Table 1. Energy parameters of router and link
Component Status Energy (pJ)
Read 76.41 Input/Output Buffer Write 79.62 Arbitration Active 6.10 Routing Active 310.00 Crossbar Active 83.00
Link (per bit) Active 5.52
4. Credit-Based Peak Power Control
In this section, we propose a credit-based peak power control that regulates the injection of packets in the router and the ITL. Fundamentally, before sending a packet or establishing a connection, we check the power budget availability (power credit) for the packet or the connection. Only packets/connections that earn power credits can enter the network.
The peak power constraint is given to the network, when the system designer divides the total power budget for each part of the system to keep away from the detrimental thermal impact. It is required for the reliable communication between the routers to operate safely. Since the routers try to consume more power to maximize their performance, the router circuit can get burned or have malfunctions without the peak power control [21].
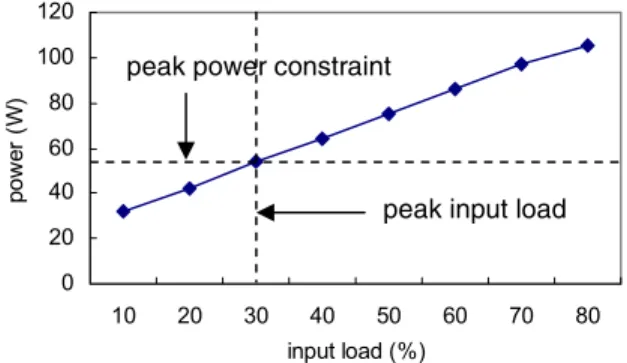
Therefore, in order to maintain power consumption of the on-chip network under the specified power limit, we regulate the injection rate in the ITL. As shown in Figure 2, we can observe that the power consumption is proportional to the network load, which is, in turn, determined by the integral input load among all routers. Note that, if we successfully control the peak input load
Router Processor
that corresponds to the peak power, the network can be sustained without any malfunctions.
0 20 40 60 80 100 120 10 20 30 40 50 60 70 80 input load (%) po w er (W )
Figure 2. Relationship of input load and peak power (simulation on a 4x4 mesh network using a mixed traffic workload)
Our goal is to maintain the service quality while controlling the peak power consumption. We can categorize network traffic into two classes; connection-based (real-time traffic) and connectionless (best-effort traffic). Connection-based traffic usually requires QoS guarantees, which means that once a connection is established, we need to provide a certain service level. On the other hand, connectionless traffic does not have such a strict demand of performance. Thus, we should take different approaches to handle each traffic type. To apply different schemes for each traffic type, the total power budget (Ptotal) is divided and distributed to each traffic
class by its ratio.
Ptotal = PRT + PBE ≤Ppeak
where PRT is power consumption for real-time traffic and PBE is power consumption for best-effort traffic.
Real-time traffic control: Since each flow of real-time traffic has its bandwidth requirement and the requirement should be guaranteed, we cannot throttle packet injection of the admitted connection to control power consumption. Thus we can only restrict the number of connections/flows to be admitted in the network so as to meet the peak power constraint. This scheme can be regarded as an extension of admission control. For admission control, we only check the bandwidth availability. In the credit-based peak power control, we check the power budget as well as bandwidth availability.
Before a new connection is established in the network, the probe message checks whether the routers on the path from the source to the destination have both sufficient bandwidth and sufficient power budget for this new connection to guarantee QoS and to meet the power constraints, respectively. If all the routers have both sufficient bandwidth and sufficient power budget, this connection can be established in the network. Otherwise, it gets rejected.
The bandwidth of the connection determines the power required for that connection. The real-time traffic, whose
bandwidth is r bps, injects r/f flits per second, where f is the flit size in bits. The energy consumed for a single flit in a router (Erouter), is obtained from our power model of
the router. So a flit consumes Erouter × r/f Watts at each
router. The power budget of each router on the path of the connection is recalculated by subtracting the consumed power from the former power budget of the router. It can be denoted by the following formula. For each router i in the set of the routers on the path, the budget changes by the following equation:
PRT(i) = PRT(i) – Erouter×r / f
where PRT(i) is the power budget for router i. The
bandwidth of router i, having the updated power budget, becomes equivalent to the available bandwidth that can be assigned to a new real-time connection in the router.
When we set the peak input load to k (which is equal to the peak power constraint), the allocated power budget of the router i for real-time traffic is designated as Erouter× k(R/f), where R is the maximum bandwidth. The sum of all routers’ power budgets is equal to the total power budget of real-time traffic (PRT).
Best-effort traffic control: Since best-effort traffic has no bandwidth requirement and no connection setup, it is impossible to satisfy the peak power constraint by controlling the admission of connections. So our method estimates the consumed energy for a best-effort packet and its traversal time in the network, and regulates the injection of the packet in the ITL. The ITL updates its energy estimate register at both the packet departure and the expected arrival by subtracting and adding the packet’s energy value. If the ITL does not have enough energy budget for a new packet to inject, the packet will be throttled. To achieve this, we need to convert the power budget (PBE) into the energy budget (EBE). The
power budget is converted into the energy budget for every short period of time, T (Note that EBE = PBE·T ) [21].
The total amount of best-effort power budget (PBE) is
equally divided and assigned to each ITL.
We need to estimate how much energy and time are required for a single packet delivery on a certain path. The wormhole switching requires the switching energy (Epacket) and the time (Tpacket) to send a packet from a
given source to a destination as shown in the following formulae assuming one packet consists of N flits:
Epacket = [Erouter·D + Elink·(D+1)]·N , Tpacket = [D·Crouter + (D+1)·Clink + N ]·Tcycle+ WITL
where Erouter and Elink are energy values consumed by
routers and links, respectively. D is the distance between source and destination or the number of routers traversed by a packet through the network. A packet traverses (1 + the number of routers) links, taking into account injection and ejection links. Crouter and Clink is the number of cycles
for router and link to handle one flit. Tcycle is the clock
cycle time. WITL denotes the average waiting time in the
peak power constraint
ITL that models the network contention and it is estimated from the queue operations. However, when we consider the micro-architecture of a router, the routing and arbitration activities are necessary only for head flits and the expected energy consumption of a single packet can be expressed in the following detailed formula:
Epacket = [(2Erd + 2Ewr + Exb) · D + Elink · (D+1)] · N +
(Eroute + Earb) · D
where Erd, Ewr, Exb, Eroute, and Earb are energy
consumption parameters for reading from the buffer, writing to the buffer, traversing the crossbar, routing, and arbitration, respectively.
Before a packet departs from the ITL, the estimate of
Epacket is subtracted from the energy budget of the ITL if it
has a sufficient energy budget. After Tpacket time, the
estimated energy is restored to the budget register of the ITL. Since the ITL does not inject a best-effort packet when it has insufficient energy budget, the sum of all energy budgets in the ITLs is less than or equal to PBE.
Therefore, the total allocated energy budget for best-effort traffic can be satisfied by monitoring the energy budget and regulating the injection rate inside the ITL.
5. Experimental Results
5.1. Simulation Platform
For our experiment, we used a 4x4 mesh network with 6-port routers as a base configuration. The router has four links for interconnecting neighboring routers, one for an injection link, and one for an ejection link. Each router has 16 VCs and 10-flit buffers for wormhole switching. The flit size is 256 bits and each packet has 40 flits except control packets, which are 10-flit long. To avoid the initial warm-up effect of the simulation, we measure the consumed power and the latency after injecting 10,000 packets.
Network traffic consists of real-time traffic, best-effort traffic, and control traffic as proposed in [4]. We used ON/OFF real-time traffic by producing a stream of messages according to the given injection rate. Best-effort traffic is generated from the Poisson distribution, whereas the destination of each packet is determined by a uniform distribution. Control traffic is typically used for network configuration, congestion control, and transfer of other information. It has the highest priority, but it consumes only a very small portion of the total bandwidth. Therefore, we don’t have any power control scheme for control traffic.
5.2. Peak Power Control Results
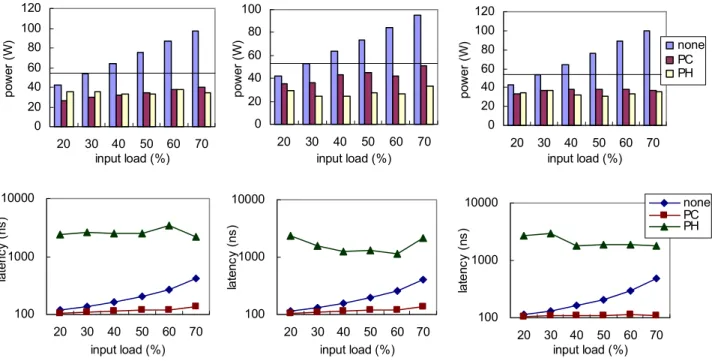
We compare our credit-based peak power control with the dynamic peak power controller (PowerHerd [21]) in terms of power consumption and performance. The same peak power value is used for comparison between our method and PowerHerd. The different mixed ratios of real-time traffic and best-effort traffic are used to show peak power satisfaction of two types of traffic. Figure 3 shows the consumed power and the latency in three kinds of workloads: 50% real-time and 50% best-effort traffic (mixed workload), 100% best-effort traffic, and 100% real-time traffic. The basic QoS router, the QoS router with the credit-based peak power control, and PowerHerd are indicated by none, PC, and PH. To set a power constraint for an on-chip network, we use the average consumed power at 30% input load in these workloads. The peak power values are 53.9W (mixed workload), 52.8W (100% best-effort workload), and 53.6W (100% real-time workload). Although the system designer can choose other values, the peak input load associated with the peak power constraint should not incur saturation of the network.
We observe that power consumption in the basic QoS router configuration exceeds the peak power constraint over 30% input load of each workload, since the input load is related with power consumption. Beyond the peak power constraint, the dissipated heat can overrun the cooling capacity and induces the electronic failures. This harmful phenomenon that threatens reliability and safety of the on-chip network can be prevented with the peak power control. Moreover, the power constraint can prevent the over-provisioned design and the remaining power can be supplied to computation components.
The credit-based peak power control and PowerHerd satisfy the peak power constraint for all three workloads. For example, Figure 3(a) shows that 60% input load consumes 69.7% of the total power budget with the peak power control in the mixed traffic workload. In case of single type workloads, we can observe that each mechanism is effective to control of each traffic type to meet the constraint as shown in Figure 3(b) and 3(c). Moreover, the best-effort traffic control uses, on the average, 84% of the total power budget, utilizing its budget better than the real-time traffic control (70% of the total budget), since it controls the unit of a packet rather than a flow.
The latency graphs in Figure 3 show that the credit-based peak power control has graceful performance slowdown as the input load increases, although this latency increase is hard to notice because the latency is represented exponentially. It implies that the additional effect of the peak power control is preventing the network congestion since it throttles the traffic injection into the
0 20 40 60 80 100 120 20 30 40 50 60 70 input load (%) po w er (W ) 0 20 40 60 80 100 20 30 40 50 60 70 input load (%) po w er (W ) 0 20 40 60 80 100 120 20 30 40 50 60 70 input load (%) po w er (W ) none PC PH 100 1000 10000 20 30 40 50 60 70 input load (%) la te nc y ( ns ) 100 1000 10000 20 30 40 50 60 70 input load (%) la te nc y ( ns) 100 1000 10000 20 30 40 50 60 70 input load (%) la te nc y ( ns ) none PC PH
(a) Mixed workload (b) 100% best-effort workload (c) 100% real-time workload Figure 3. Power consumption and packet delivery latency in a 4x4 mesh network for various workloads network. As expected, PowerHerd shows very high
latency over all the ranges of the input load since it controls the flow in the middle of network to satisfy the router’s local power budget. In other words, the dynamic flow control in PowerHerd, adaptively finding less power-hungry routers in the path, incurs significant performance degradation. Another reason for the big difference is that the small buffer size in wormhole switching aggravates the latency problem. Therefore, the peak power control in PowerHerd does not avert congestion and it even worsens the latency due to the throttling logic of the crossbar inside the router.
In the mixed workload, two types of traffic compete with each other for the shared resources such as physical channels, buffer schedulers, and crossbars. The increasing rate of the latency in best-effort traffic without the peak power control is greater than that of real-time traffic at the high input loads, since real-time traffic has higher priority to be transferred than best-effort traffic in the QoS router. It suggests that controlling the injection rate of best-effort traffic is difficult in the mixed workload.
Next, we measure the average power consumption every 500 cycles (500 ns) to show the validity of runtime peak power satisfaction, since one of the needs for the peak power control is the thermal management. The period is assumed to be much smaller than the thermal RC constant (product of thermal resistance and thermal capacitance driven from the duality between heat transfer and electrical phenomena) to localize the heatsink temporally [22]. Figure 4 shows power consumption of
each period under the peak power constraint (53.9 W) in the mixed workload. Power consumption is fluctuating below the peak power along the time and may not cause any harmful thermal effect.
20 30 40 50 60 113 130 148 165 183 200 218 235 253 270 288 305 time (microsec) pow er ( W )
Figure 4. Runtime power consumption for 70% input load of mixed traffic in a 4x4 mesh network
5.3. Effectiveness of Credit-Based Peak Power
Control
Theoretically, the credit-based peak power control should scale well with other workloads that are different from the test workload, since the scheme has the ability to manage each kind of traffic independently and divide the total power budget into each budget of traffic type with respect to its ratio in the workload. Furthermore, it does not suffer from the latency problem like PowerHerd, and has a property of congestion avoidance by regulating the injection rate for high input load.
By observing the behavior of power consumption without any peak power control (none) in Figure 3, we
can tell that power consumption of each workload shows a similar pattern. It implies that it has little relationships with the mixed ratio of each traffic type, but it has close relationships with the input load, assuming that both of them try to make use of the network. The next experiments are conducted for different percentages of two traffic types (best-effort: 10% ~ 90%, real-time: 90% ~ 10%) with the same peak power constraint (53.9W) of 50% best-effort and 50% real-time traffic. Figure 5 shows power consumption of two cases (50% and 70% input loads) in a 4x4 mesh network with the credit-based peak power control. Note that each traffic type has its own power budget that is the product of its ratio of workload and the total power budget. The results in Figure 5 illustrate that the given power constraint is satisfied in all the cases except 40% best-effort traffic workload of 70% input load with the credit-based peak power control.
0 10 20 30 40 50 60 70 0.1 0.2 0.3 0.4 0.5 0.6 0.7 0.8 0.9 pow er ( W ) 50% 70% Figure 5. Effectiveness to various mixed ratio of traffic in a 4x4 mesh network (The ratio of real-time traffic decreases 0.9 to 0.1 on x-axis.)
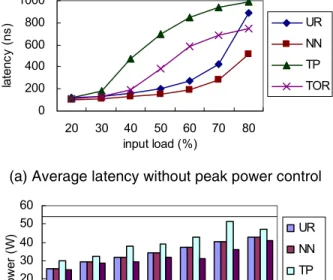
Next, we experiment the effectiveness of the credit-based peak power control with 4 different traffic patterns, which are usually used to show performance of the adaptive routing algorithms in [15]. Two traffic patterns, NN (nearest neighbor) and UR (uniformly distributed), are benign, since they have the load balancing and good throughput properties. Next two patterns, TP (transpose) and TOR (tornado), are adversarial ones that cause load imbalance and make hot spots. The peak power constraint of the UR pattern in the equally mixed workload is used to assess the effectiveness of peak power control in other traffic patterns.
In the QoS capable network without a peak power constraint, the latency graph tends to be convex in benign patterns, while the adversarial patterns draw the concave graph as shown in Figure 6(a). Load imbalance patterns cause network saturation for a relatively low input load and show the highly increasing rate of the latency over benign patterns. Figure 6(b) shows satisfaction of peak power constraint in hot spot traffic patterns as well as a benign pattern of NN, and TOR pattern shows less power consumption than others since it does not use vertical links. 0 200 400 600 800 1000 20 30 40 50 60 70 80 input load (%) la te ncy ( n s) UR NN TP TOR
(a) Average latency without peak power control
0 10 20 30 40 50 60 20 30 40 50 60 70 80 input load (%) po w er (W ) UR NN TP TOR
(b) Power consumption with peak power control Figure 6. Comparison of peak power control for various traffic patterns in a 4x4 mesh network
Finally, we conduct the experiments for the different network size. Figure 7 shows power consumption for the different size of networks using a uniform distribution for message destinations. The behavior of controlling power and satisfaction of peak power constraint of larger network is similar to that of 4x4 mesh network. The used peak power constraints are power consumption for 30% input load of each network. These values are 93.2W (5x5), 146.7W (6x6), 216.3W (7x7), and 306.7W (8x8). The gap between the peak constraint and the consumed power increases as the network size grows.
20 30 40 50 60 5x5 8x8 0 50 100 150 200 250 pow er ( W ) input load (%) size 5x5 6x6 7x7 8x8
Figure 7. Effectiveness of various network size
6. Conclusions
The proposed credit-based peak power control aims for the management of peak power consumption in the QoS capable on-chip networks. It turns out that the credit-based peak power control outperforms the prior
best-effort traffic ratio in workload
technique, PowerHerd, in terms of packet latency, while avoiding the network congestion by controlling injection rates. The experiments with different mixed ratio of traffic and different mesh networks show that the proposed peak power control in a specific workload can be applied to other types of workload with a small variation.
We proposed two different control mechanisms for two types of traffic in a QoS capable on-chip network. For real-time traffic, the peak power control administers the admission of a new real-time traffic connection by considering the sustainable bandwidth that can be convertible to the power budget assigned to each router, when a new connection setup request arrives. This mechanism is similar to admission control. For best-effort traffic, it computes the expected energy dissipation of a packet and estimates its traversal time. The packet is allowed to enter the network only when the available energy budget of the ITL is large enough to accommodate the packet transfer. Otherwise, the packet injection is throttled. This feature resembles congestion control.
References
[1] W. Dally and B. Towles, “Route Packets, Not Wires: On-chip Interconnection Networks”, Design Automation Conference, pp. 684-689, 2001.
[2] L. Benini and G. De Micheli., “Networks on Chips: A New SoC Paradigm”, IEEE Micro, pp. 70-77, 2002.
[3] D. Singh, J. M. Rabaey, M. Pedram, F. Catthoor, S. Rajgopal, N.Sehgal, and T.J.Mozdan, “Power conscious cad tools and methodologies: A perspective” Proceedings of the IEEE, 83(4):570-594, Apr. 1995.
[4] K. H. Yum, E. J. Kim, C. R. Das, M. Yousif, and J. Duato “Integrated Admission and Congestion Control for QoS Support in Clusters,” International Conference on Cluster Computing, pp. 325-332, 2002.
[5] H.-S. Wang, X. Zhu, L.-S. Peh, and S. Malik, “Orion: A Power-Performance Simulator for Interconnection Networks,” International Symposium on Microarchitecture, pp. 294-305, 2002.
[6] H.-S. Wang, L.-S. Peh, and S. Malik, “Power-driven Design of Router Microarchitectures in On-chip Networks,” International Symposium on Microarchitecture, pp. 105-116, 2003.
[7] M. B. Taylor, J. Kim, J. Miller, D. Wentzlaff, F. Ghodrat, B. Greenwald, H. Hoffmann, P. Johnson, J.-W. Lee, W. Lee, A. Ma, A. Saraf, M. Seneski, N. Shnidman, V. Strumpen, M. Frank, S. Amarasinghe and A. Agarwal, “The Raw Microprocessor: A computational fabrics for software circuits and general-purpose programs”, IEEE Micro, 22(2):25-35, 2002.
[8] K. Sankaralingam, R. Nagarajan, H. Liu, C. Kim, J. Huh, D. Burger, S. W. Keckler, and C. R. Moore, “Exploiting ILP, TLP, and DLP with the polymorphous TRIPS architecture”, International Symposium on Computer Architecture, pp. 422-433, 2003.
[9] E. J. Kim, K. H. Yum, G. M. Link, N. Vijaykrishnan, M. Kandemir, M. J. Irwin, M. Yousif, and C. R. Das, “Energy Optimization Techniques in Cluster Interconnects," International Symposium on Low Power Electronics and Design, pp. 459-464, 2003.
[10] S. Murali and G. De Micheli, “Bandwidth-Constrained Mapping of Cores onto NoC Architectures”, Design, Automation and Test in Europe, pp. 896-903, 2004.
[11] J. H. Kim and A. A. Chien, “Rotating Combined Queuing (RCQ): Bandwidth and Latency Guarantees in Low-Cost, High-Performance Networks,” International Symposium on Computer Architecture, pp. 226-236, May 1996.
[12] J.-P. Li and M. Mutka, “Priority Based Real-Time Communication for Large Scale Wormhole Networks,” International Parallel Processing Symposium, pp. 433-438, May 1994.
[13] J. Duato, S. Yalamanchili, M. B. Caminero, D. Love, and F. J. Quiles, “MMR: A High-Performance Multimedia Router Architecture and Design Tradeoffs,” International Symposium on High Performance Computer Architecture, pp. 300-309, Jan. 1999.
[14] K. H. Yum, E. J. Kim, C. R. Das, and A. S. Vaidya, “MediaWorm: A QoS Capable Router Architecture for Cluster,” IEEE Transactions on Parallel and Distributed Systems, 13(12):1261-1274, Dec. 2002.
[15] A. Singh, W. Dally, A. Gupta, and B. Towles, “GOAL: A Load-Balanced Adaptive Routing Algorithms for Torus Networks”, International Symposium on Computer Architecture, pp. 194-205, Jun. 2003.
[16] C. S. Patel, S. M. Chai, S. Yalamanchili, and D. E. Schimmel, “Power Constrained Design of Multiprocessor Interconnection Networks,” International Conference on Computer Design, pp. 408-416, 1997.
[17] T. T. Ye, L. Benini, and G. De Micheli, “Analysis of Power Consumption on Switch Fabrics in Network Routers,” Design Automation Conference, pp. 524-529, 2002.
[18] V. Raghunathan, M. B. Srivastava, and R. K. Gupta, “A Survey of Techniques for Energy Efficient On-chip Communication”, Design Automation Conference, pp. 900-905, 2003.
[19] J. Hu, and R. Marculescu, “Exploiting the Routing Flexibility for Energy/Performance Aware Mapping of Regular NoC Architectures”, Design, Automation and Test in Europe, pp. 10688-10693, 2003.
[20] W. H. Ho, and T. M. Pinkston, “A Methodology for Designing Efficient On-Chip Interconnects on Well-Behaved Communication Patterns”, International Symposium on High Performance Computer Architecture, pp. 377-, 2003.
[21] L. Shang, L.-S. Peh, and N. K. Jha, “PowerHerd: Dynamic Satisfaction of Peak Power Constraints in Interconnection Networks,” International Conference on Supercomputing, pp. 98-108, 2003.
[22] K. Skadron, T. Abdelzaher, and M. R. Stan, “Control-theoretic techniques and thermal-RC modeling for accurate and localized dynamic thermal management”, International Symposium on High Performance Computer Architecture, pp. 17–28, Feb. 2002.
[23] X. Chen and L.-S. Peh, “Leakage Power Modeling and Optimization in Interconnection Networks”, International Symposium on Low Power Electronics and Design, 2003.