2014
On empirical likelihood methods for irregularly
located spatial data
Matthew Van Hala
Iowa State UniversityFollow this and additional works at:
https://lib.dr.iastate.edu/etd
Part of the
Statistics and Probability Commons
This Dissertation is brought to you for free and open access by the Iowa State University Capstones, Theses and Dissertations at Iowa State University Digital Repository. It has been accepted for inclusion in Graduate Theses and Dissertations by an authorized administrator of Iowa State University Digital Repository. For more information, please [email protected].
Recommended Citation
Van Hala, Matthew, "On empirical likelihood methods for irregularly located spatial data" (2014).Graduate Theses and Dissertations. 13905.
by
Matthew Mark Van Hala
A thesis submitted to the graduate faculty
in partial fulfillment of the requirements for the degree of DOCTOR OF PHILOSOPHY
Major: Statistics
Program of Study Committee: Daniel J. Nordman, Major Professor
Petrut¸a C. Caragea Mark S. Kaiser
Huaiqing Wu Zhengyuan Zhu
Iowa State University Ames, Iowa
2014
DEDICATION
I would like to dedicate this thesis to my fianc´ee Sarah. She has been unwavering in her support and encouragement.
TABLE OF CONTENTS
LIST OF TABLES . . . vi
LIST OF FIGURES . . . .xxxiii
ACKNOWLEDGEMENTS . . . .xxxiv
ABSTRACT . . . .xxxv
CHAPTER 1. INTRODUCTION . . . 1
References . . . 3
CHAPTER 2. AN EMPIRICAL LIKELIHOOD METHOD FOR IRREG-ULARLY LOCATED SPATIAL DATA . . . 5
2.1 Introduction . . . 5
2.2 Spatial Data and Sampling Design . . . 8
2.3 Spatial Blockwise Empirical Likelihood (SBEL) . . . 9
2.3.1 General Estimating Functions . . . 9
2.3.2 Data Blocking and SBEL Ratio . . . 12
2.4 Main Results . . . 14
2.4.1 Conditions . . . 14
2.4.2 Basic Wilks Result for the Spatial EL Method . . . 15
2.4.3 Maximum Spatial EL Estimation and Hypothesis Testing . . . 16
2.5 Simulation Results . . . 18
2.5.1 Confidence Intervals . . . 18
2.5.2 Goodness-of-Fit Tests . . . 22
2.6 Data Illustration . . . 24
2.8 Proofs of Main Results . . . 30
2.8.1 Proof of Theorem2.1 . . . 30
2.8.2 Proof of Theorem2.2 . . . 36
References . . . 43
CHAPTER 3. A FREQUENCY DOMAIN EMPIRICAL LIKELIHOOD FOR ESTIMATION AND TESTING OF SPATIAL COVARIANCE STRUC-TURE . . . 46
3.1 Introduction . . . 47
3.2 Spatial Sampling Framework and its Properties . . . 51
3.2.1 Spatial sampling design . . . 51
3.2.2 Spatial asymptotic structures . . . 52
3.2.3 Properties of DFTs for Irregularly Located Spatial Data . . . 53
3.3 Spatial Frequency Domain Empirical Likelihood (SFDEL) Method . . . 54
3.4 Estimating Function Examples . . . 56
3.4.1 Estimating Functions for Testing Isotropy inR2 . . . 57
3.4.2 Functions for Testing Covariance Separability inR2 . . . 57
3.4.3 Variogram Model Estimation . . . 58
3.5 Main Results . . . 59
3.5.1 Regularity Conditions . . . 59
3.5.2 Distributional Results for SFDEL Test Statistics . . . 63
3.6 Simulation Results . . . 66
3.6.1 Testing for Isotropy . . . 67
3.6.2 Testing for Covariance Separability . . . 69
3.6.3 Variogram Model Fitting . . . 75
3.7 Conclusion . . . 82
CHAPTER 4. SUPPLEMENTARY MATERIAL FOR A FREQUENCY DO-MAIN EMPIRICAL LIKELIHOOD FOR ESTIMATION AND
TEST-ING OF SPATIAL COVARIANCE STRUCTURE . . . 90
4.1 Proofs of Main Results . . . 90
4.1.1 Introduction . . . 90
4.1.2 Notation . . . 90
4.1.3 Preliminary Results . . . 91
4.1.4 Proof of the Main Results . . . 109
4.1.5 Results for the Maximum SFDEL estimator . . . 109
4.1.6 Proofs for Main Theorems3.2- 3.5 . . . 116
4.2 Tables of Simulation Results . . . 120
4.2.1 Introduction . . . 120
4.2.2 Testing for Isotropy . . . 123
4.2.3 Testing for Covariance Separability . . . 192
4.2.4 Variogram Model Fitting . . . 293
References . . . 319
LIST OF TABLES
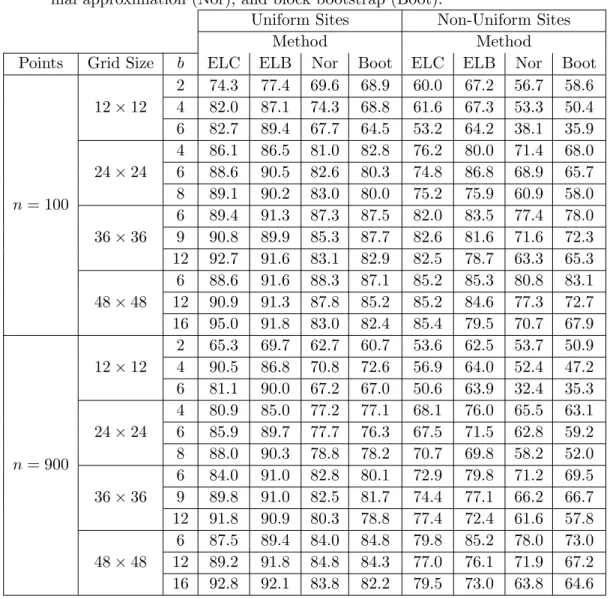
2.1 Empirical coverage of 90% intervals for the mean for various methods: SBEL with chi-square calibration (ELC), SBEL with bootstrap-based calibration (ELB), normal approximation (Nor), and block bootstrap (Boot). . . 21
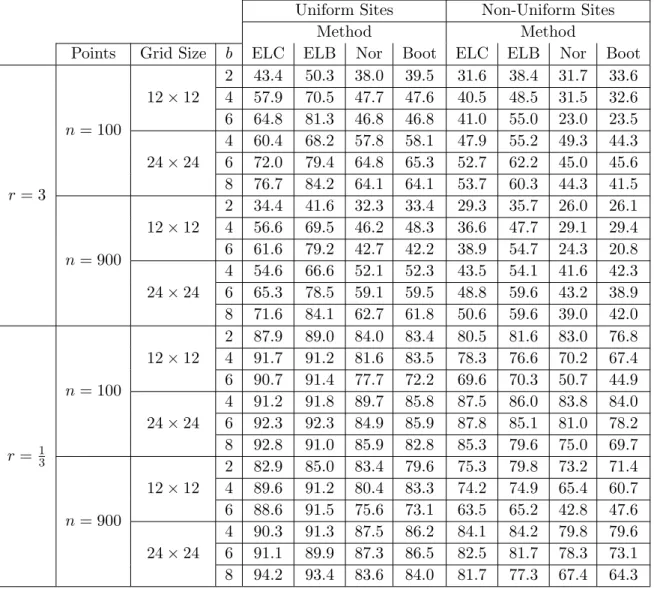
2.2 Empirical coverage of 90% intervals for the mean over spatial depen-dence values r = 1/3,3 and various methods: SBEL with chi-square calibration (ELC), SBEL with bootstrap-based calibration (ELB), nor-mal approximation (Nor), and block bootstrap (Boot) . . . 23
2.3 90% intervals for spatial regression parameters based on multiple regres-sion (independence assumption), parametric Gaussian maximum likeli-hood, and the SBEL method (b= 27) . . . 29
2.4 Estimated spatial regression parameters based on multiple regression (independence assumption), parametric Gaussian maximum likelihood, and the SBEL method (b= 27) . . . 29
3.1 Different sets of vectors used for testing isotropy . . . 68
3.2 Empirical size for testing for isotropy based on the spectral distribution function: uniform sites; exponential covariance; vector sets B1, B2, B3, and B4; nominal size 0.1; based on 1000 runs . . . 70
3.3 Adjusted empirical power for testing for isotropy based on the spectral distribution function: uniform sites; directional covariance; vector sets B1, B2, B3, and B4; nominal size 0.1; based on 1000 runs . . . 71
3.4 Empirical size for testing for isotropy based on the spectral distribution function: mixture of uniform and normal sites; exponential covariance; vector sets B1, B2, B3, and B4; nominal size 0.1; based on 1000 runs . 72
3.5 Adjusted empirical power for testing for isotropy based on the spectral distribution function: mixture of uniform and normal sites; directional covariance; vector sets B1, B2, B3, and B4; nominal size 0.1; based on 1000 runs . . . 73
3.6 Empirical size for testing for isotropy based on [MS]: exponential co-variance; lag sets A1, A2, A3, and A4; nominal size 0.1; based on 1000 runs . . . 74
3.7 Adjusted empirical power for testing for isotropy based on [MS]: direc-tional covariance; lag sets A1, A2, A3, and A4; nominal size 0.1; based on 1000 runs . . . 74
3.8 Different sets of vectors used for different types of estimating equations (i.e., given in equations (3.2)-(3.4) of Section3.4.2) to test for covariance separability . . . 74
3.9 Empirical size for testing for covariance separability based on the spec-tral distribution function: estimating function Type 1; separable co-variance functionC(h) = exp(−2h1) exp(−h2); vector sets D1 and D2;
nominal size 0.1; based on 1000 runs . . . 76
3.10 Adjusted empirical power for testing for covariance separability based on the spectral distribution function: estimating function Type 1; non-separable exponential covariance; vector sets D1 and D2; nominal size 0.1; based on 1000 runs . . . 77
3.11 Empirical size for testing for covariance separability based on the spec-tral distribution function: estimating function Type 2; separable co-variance function C(h) = exp(−2h1) exp(−h2); vector sets E1 and E2;
3.12 Adjusted empirical power for testing for covariance separability based on the spectral distribution function: estimating function Type 2; non-separable exponential covariance; vector sets E1 and E2; nominal size 0.1; based on 1000 runs . . . 79
3.13 Empirical size for testing for covariance separability based on the spec-tral distribution function: estimating function Type 3; separable co-variance function C(h) = exp(−2h1) exp(−h2); vector sets F1 and F2;
nominal size 0.1; based on 1000 runs . . . 80
3.14 Adjusted empirical power for testing for covariance separability based on the spectral distribution function: estimating function Type 3; non-separable exponential covariance; vector sets F1 and F2; nominal size 0.1; based on 1000 runs . . . 81
3.15 Coverage probability for 90% confidence regions: Mat´ern covariance (ν = 1, ρ= 1.5); uniform sites; lag sets G1 and G2; method A based on (3.7) (no maximum EL estimation), method B based on (3.6) (maximum EL estimation) . . . 83
3.16 Coverage probability for 90% confidence regions: Mat´ern covariance (ν = 1, ρ= 1.5); mixture of uniform and normal sites; lag sets G1 and G2; method A based on (3.7) (no maximum EL estimation), method B based on (3.6) (maximum EL estimation) . . . 84
4.1 Empirical size for testing for isotropy based on covariances: uniform sites; exponential covariance; lag sets A1, A2, and A3; nominal size 0.1; based on 1000 runs . . . 129
4.2 Empirical size for testing for isotropy based on covariances: uniform sites; exponential covariance; lag sets A4, A5, and A6; nominal size 0.1; based on 1000 runs . . . 130
4.3 Empirical size for testing for isotropy based on covariances: uniform sites; exponential covariance; lag sets A7 and A8; nominal size 0.1; based on 1000 runs . . . 131
4.4 Empirical size for testing for isotropy based on covariances: mixture of uniform and normal sites; exponential covariance; lag sets A1, A2, and A3; nominal size 0.1; based on 1000 runs . . . 132
4.5 Empirical size for testing for isotropy based on covariances: mixture of uniform and normal sites; exponential covariance; lag sets A4, A5, and A6; nominal size 0.1; based on 1000 runs . . . 133
4.6 Empirical size for testing for isotropy based on covariances: mixture of uniform and normal sites; exponential covariance; lag sets A7 and A8; nominal size 0.1; based on 1000 runs . . . 134
4.7 Empirical size for testing for isotropy based on covariances: mixture of uniform and double exponential sites; exponential covariance; lag sets A1, A2, and A3; nominal size 0.1; based on 1000 runs . . . 135
4.8 Empirical size for testing for isotropy based on covariances: mixture of uniform and double exponential sites; exponential covariance; lag sets A4, A5, and A6; nominal size 0.1; based on 1000 runs . . . 136
4.9 Empirical size for testing for isotropy based on covariances: mixture of uniform and double exponential sites; exponential covariance; lag sets A7 and A8; nominal size 0.1; based on 1000 runs . . . 137
4.10 Empirical size for testing for isotropy based on covariances: mixture of normal sites; exponential covariance; lag sets A1, A2, and A3; nominal size 0.1; based on 1000 runs . . . 138
4.11 Empirical size for testing for isotropy based on covariances: mixture of normal sites; exponential covariance; lag sets A4, A5, and A6; nominal size 0.1; based on 1000 runs . . . 139
4.12 Empirical size for testing for isotropy based on covariances: mixture of normal sites; exponential covariance; lag sets A7 and A8; nominal size 0.1; based on 1000 runs . . . 140
4.13 Empirical power for testing for isotropy based on covariances: uniform sites; directional covariance; lag sets A1, A2, and A3; nominal size 0.1; based on 1000 runs . . . 141
4.14 Empirical power for testing for isotropy based on covariances: uniform sites; directional covariance; lag sets A4, A5, and A6; nominal size 0.1; based on 1000 runs . . . 142
4.15 Empirical power for testing for isotropy based on covariances: uniform sites; directional covariance; lag sets A7 and A8; nominal size 0.1; based on 1000 runs . . . 143
4.16 Empirical power for testing for isotropy based on covariances: mixture of uniform and normal sites; directional covariance; lag sets A1, A2, and A3; nominal size 0.1; based on 1000 runs . . . 144
4.17 Empirical power for testing for isotropy based on covariances: mixture of uniform and normal sites; directional covariance; lag sets A4, A5, and A6; nominal size 0.1; based on 1000 runs . . . 145
4.18 Empirical power for testing for isotropy based on covariances: mixture of uniform and normal sites; directional covariance; lag sets A7 and A8; nominal size 0.1; based on 1000 runs . . . 146
4.19 Empirical power for testing for isotropy based on covariances: mixture of uniform and double exponential sites; directional covariance; lag sets A1, A2, and A3; nominal size 0.1; based on 1000 runs . . . 147
4.20 Empirical power for testing for isotropy based on covariances: mixture of uniform and double exponential sites; directional covariance; lag sets A4, A5, and A6; nominal size 0.1; based on 1000 runs . . . 148
4.21 Empirical power for testing for isotropy based on covariances: mixture of uniform and double exponential sites; directional covariance; lag sets A7 and A8; nominal size 0.1; based on 1000 runs . . . 149
4.22 Empirical power for testing for isotropy based on covariances: mixture of normal sites; directional covariance; lag sets A1, A2, and A3; nominal size 0.1; based on 1000 runs . . . 150
4.23 Empirical power for testing for isotropy based on covariances: mixture of normal sites; directional covariance; lag sets A4, A5, and A6; nominal size 0.1; based on 1000 runs . . . 151
4.24 Empirical power for testing for isotropy based on covariances: mixture of normal sites; directional covariance; lag sets A7 and A8; nominal size 0.1; based on 1000 runs . . . 152
4.25 Adjusted empirical power for testing for isotropy based on covariances:, uniform sites; directional covariance; lag sets A1, A2, and A3; nominal size 0.1; based on 1000 runs . . . 153
4.26 Adjusted empirical power for testing for isotropy based on covariances:, uniform sites; directional covariance; lag sets A4, A5, and A6; nominal size 0.1; based on 1000 runs . . . 154
4.27 Adjusted empirical power for testing for isotropy based on covariances:, uniform sites; directional covariance; lag sets A7 and A8; nominal size 0.1; based on 1000 runs . . . 155
4.28 Adjusted empirical power for testing for isotropy based on covariances:, mixture of uniform and normal sites; directional covariance; lag sets A1, A2, and A3; nominal size 0.1; based on 1000 runs . . . 156
4.29 Adjusted empirical power for testing for isotropy based on covariances:, mixture of uniform and normal sites; directional covariance; lag sets A4, A5, and A6; nominal size 0.1; based on 1000 runs . . . 157
4.30 Adjusted empirical power for testing for isotropy based on covariances:, mixture of uniform and normal sites; directional covariance; lag sets A7 and A8; nominal size 0.1; based on 1000 runs . . . 158
4.31 Adjusted empirical power for testing for isotropy based on covariances:, mixture of uniform and double exponential sites; directional covariance; lag sets A1, A2, and A3; nominal size 0.1; based on 1000 runs . . . 159
4.32 Adjusted empirical power for testing for isotropy based on covariances:, mixture of uniform and double exponential sites; directional covariance; lag sets A4, A5, and A6; nominal size 0.1; based on 1000 runs . . . 160
4.33 Adjusted empirical power for testing for isotropy based on covariances:, mixture of uniform and double exponential sites; directional covariance; lag sets A7 and A8; nominal size 0.1; based on 1000 runs . . . 161
4.34 Adjusted empirical power for testing for isotropy based on covariances:, mixture of normal sites; directional covariance; lag sets A1, A2, and A3; nominal size 0.1; based on 1000 runs . . . 162
4.35 Adjusted empirical power for testing for isotropy based on covariances:, mixture of normal sites; directional covariance; lag sets A4, A5, and A6; nominal size 0.1; based on 1000 runs . . . 163
4.36 Adjusted empirical power for testing for isotropy based on covariances:, mixture of normal sites; directional covariance; lag sets A7 and A8; nominal size 0.1; based on 1000 runs . . . 164
4.37 Empirical size for testing for isotropy based on [MS]: exponential co-variance;n= 600 points; lag sets A1, A2, A3, and A4; nominal size 0.1; based on 1000 runs . . . 165
4.38 Empirical size for testing for isotropy based on [MS]: exponential co-variance;n= 600 points; lag sets A5, A6, A7, and A8; nominal size 0.1; based on 1000 runs . . . 165
4.39 Empirical power for testing for isotropy based on [MS]: directional co-variance;n= 600 points; lag sets A1, A2, A3, and A4; nominal size 0.1; based on 1000 runs . . . 166
4.40 Empirical power for testing for isotropy based on [MS]: directional co-variance;n= 600 points; lag sets A5, A6, A7, and A8; nominal size 0.1; based on 1000 runs . . . 166
4.41 Adjusted empirical power for testing for isotropy based on [MS]: direc-tional covariance;n= 600 points; lag sets A1, A2, A3, and A4; nominal size 0.1; based on 1000 runs . . . 167
4.42 Adjusted empirical power for testing for isotropy based on [MS]: direc-tional covariance;n= 600 points; lag sets A5, A6, A7, and A8; nominal size 0.1; based on 1000 runs . . . 167
4.43 Empirical size for testing for isotropy based on the spectral distribution function: uniform sites; exponential covariance; vector sets B1 and B2; nominal size 0.1; based on 1000 runs . . . 168
4.44 Empirical size for testing for isotropy based on the spectral distribution function: uniform sites; exponential covariance; vector sets B3 and B4; nominal size 0.1; based on 1000 runs . . . 169
4.45 Empirical size for testing for isotropy based on the spectral distribution function: uniform sites; exponential covariance; vector sets B5 and B6; nominal size 0.1; based on 1000 runs . . . 170
4.46 Empirical size for testing for isotropy based on the spectral distribution function: uniform sites; exponential covariance; vector set B7; nominal size 0.1; based on 1000 runs . . . 171
4.47 Empirical size for testing for isotropy based on the spectral distribution function: mixture of uniform and normal sites; exponential covariance; vector sets B1 and B2; nominal size 0.1; based on 1000 runs . . . 172
4.48 Empirical size for testing for isotropy based on the spectral distribution function: mixture of uniform and normal sites; exponential covariance; vector sets B3 and B4; nominal size 0.1; based on 1000 runs . . . 173
4.49 Empirical size for testing for isotropy based on the spectral distribution function: mixture of uniform and normal sites; exponential covariance; vector sets B5 and B6; nominal size 0.1; based on 1000 runs . . . 174
4.50 Empirical size for testing for isotropy based on the spectral distribution function: mixture of uniform and normal sites; exponential covariance; vector set B7; nominal size 0.1; based on 1000 runs . . . 175
4.51 Empirical power for testing for isotropy based on the spectral distribu-tion funcdistribu-tion: uniform sites; direcdistribu-tional covariance; vector sets B1 and B2; nominal size 0.1; based on 1000 runs . . . 176
4.52 Empirical power for testing for isotropy based on the spectral distribu-tion funcdistribu-tion: uniform sites; direcdistribu-tional covariance; vector sets B3 and B4; nominal size 0.1; based on 1000 runs . . . 177
4.53 Empirical power for testing for isotropy based on the spectral distribu-tion funcdistribu-tion: uniform sites; direcdistribu-tional covariance; vector sets B5 and B6; nominal size 0.1; based on 1000 runs . . . 178
4.54 Empirical power for testing for isotropy based on the spectral distri-bution function: uniform sites; directional covariance; vector set B7; nominal size 0.1; based on 1000 runs . . . 179
4.55 Empirical power for testing for isotropy based on the spectral distribu-tion funcdistribu-tion: mixture of uniform and normal sites; direcdistribu-tional covari-ance; vector sets B1 and B2; nominal size 0.1; based on 1000 runs . . . 180
4.56 Empirical power for testing for isotropy based on the spectral distribu-tion funcdistribu-tion: mixture of uniform and normal sites; direcdistribu-tional covari-ance; vector sets B3 and B4; nominal size 0.1; based on 1000 runs . . . 181
4.57 Empirical power for testing for isotropy based on the spectral distribu-tion funcdistribu-tion: mixture of uniform and normal sites; direcdistribu-tional covari-ance; vector sets B5 and B6; nominal size 0.1; based on 1000 runs . . . 182
4.58 Empirical power for testing for isotropy based on the spectral distribu-tion funcdistribu-tion: mixture of uniform and normal sites; direcdistribu-tional covari-ance; vector set B7; nominal size 0.1; based on 1000 runs . . . 183
4.59 Adjusted empirical power for testing for isotropy based on the spectral distribution function: uniform sites; directional covariance; vector sets B1 and B2; nominal size 0.1; based on 1000 runs . . . 184
4.60 Adjusted empirical power for testing for isotropy based on the spectral distribution function: uniform sites; directional covariance; vector sets B3 and B4; nominal size 0.1; based on 1000 runs . . . 185
4.61 Adjusted empirical power for testing for isotropy based on the spectral distribution function: uniform sites; directional covariance; vector sets B5 and B6; nominal size 0.1; based on 1000 runs . . . 186
4.62 Adjusted empirical power for testing for isotropy based on the spectral distribution function: uniform sites; directional covariance; vector set B7; nominal size 0.1; based on 1000 runs . . . 187
4.63 Adjusted empirical power for testing for isotropy based on the spectral distribution function: mixture of uniform and normal sites; directional covariance; sets B1 and B2; nominal size 0.1; based on 1000 runs . . . 188
4.64 Adjusted empirical power for testing for isotropy based on the spectral distribution function: mixture of uniform and normal sites; directional covariance; sets B3 and B4; nominal size 0.1; based on 1000 runs . . . 189
4.65 Adjusted empirical power for testing for isotropy based on the spectral distribution function: mixture of uniform and normal sites; directional covariance; sets B5 and B6; nominal size 0.1; based on 1000 runs . . . 190
4.66 Adjusted empirical power for testing for isotropy based on the spectral distribution function: mixture of uniform and normal sites; directional covariance; vector set B7; nominal size 0.1; based on 1000 runs . . . . 191
4.67 Empirical size for testing for covariance separability based on covari-ances: uniform sites; C(h) = e−2h1e−h2; lag sets C1 and C2; nominal size 0.1; based on 1000 runs . . . 197
4.68 Empirical size for testing for covariance separability based on covari-ances: uniform sites; C(h) = e−2h1e−h2; lag sets C3 and C4; nominal size 0.1; based on 1000 runs . . . 198
4.69 Empirical size for testing for covariance separability based on covari-ances: mixture of uniform and normal sites;C(h) =e−2h1e−h2; lag sets C1 and C2; nominal size 0.1; based on 1000 runs . . . 199
4.70 Empirical size for testing for covariance separability based on covari-ances: mixture of uniform and normal sites;C(h) =e−2h1e−h2; lag sets C3 and C4; nominal size 0.1; based on 1000 runs . . . 200
4.71 Empirical power for testing for covariance separability based on covari-ances: uniform sites; exponential covariance; lag sets C1 and C2; nomi-nal size 0.1; based on 1000 runs . . . 201
4.72 Empirical power for testing for covariance separability based on covari-ances: uniform sites; exponential covariance; lag sets C3 and C4; nomi-nal size 0.1; based on 1000 runs . . . 202
4.73 Empirical power for testing for covariance separability based on covari-ances: mixture of uniform and normal sites; exponential covariance; lag sets C1 and C2; nominal size 0.1; based on 1000 runs . . . 203
4.74 Empirical power for testing for covariance separability based on covari-ances: mixture of uniform and normal sites; exponential covariance; lag sets C3 and C4; nominal size 0.1; based on 1000 runs . . . 204
4.75 Empirical power for testing for covariance separability based on covari-ances: uniform sites; non-separable Mat´ern covariance; lag sets C1 and C2; nominal size 0.1; based on 1000 runs . . . 205
4.76 Empirical power for testing for covariance separability based on covari-ances: uniform sites; non-separable Mat´ern covariance; lag sets C3 and C4; nominal size 0.1; based on 1000 runs . . . 206
4.77 Empirical power for testing for covariance separability based on covari-ances: mixture of uniform and normal sites; non-separable Mat´ern co-variance; lag sets C1 and C2; nominal size 0.1; based on 1000 runs . . 207
4.78 Empirical power for testing for covariance separability based on covari-ances: mixture of uniform and normal sites; non-separable Mat´ern co-variance; lag sets C3 and C4; nominal size 0.1; based on 1000 runs . . 208
4.79 Adjusted empirical power for testing for covariance separability based on covariances: uniform sites; exponential covariance; lag sets C1 and C2; nominal size 0.1; based on 1000 runs . . . 209
4.80 Adjusted empirical power for testing for covariance separability based on covariances: uniform sites; exponential covariance; lag sets C3 and C4; nominal size 0.1; based on 1000 runs . . . 210
4.81 Adjusted empirical power for testing for covariance separability based on covariances: mixture of uniform and normal sites; exponential co-variance; lag sets C1 and C2; nominal size 0.1; based on 1000 runs . . 211
4.82 Adjusted empirical power for testing for covariance separability based on covariances: mixture of uniform and normal sites; exponential co-variance; lag sets C3 and C4; nominal size 0.1; based on 1000 runs . . 212
4.83 Adjusted empirical power for testing for covariance separability based on covariances: uniform sites; non-separable Mat´ern covariance; lag sets C1 and C2; nominal size 0.1; based on 1000 runs . . . 213
4.84 Adjusted empirical power for testing for covariance separability based on covariances: uniform sites; non-separable Mat´ern covariance; lag sets C3 and C4; nominal size 0.1; based on 1000 runs . . . 214
4.85 Adjusted empirical power for testing for covariance separability based on covariances: mixture of uniform and normal sites; non-separable Mat´ern covariance; lag sets C1 and C2; nominal size 0.1; based on 1000 runs . 215
4.86 Adjusted empirical power for testing for covariance separability based on covariances: mixture of uniform and normal sites; non-separable Mat´ern covariance; lag sets C3 and C4; nominal size 0.1; based on 1000 runs . 216
4.87 Empirical size for testing for covariance separability based on covari-ances: larger values of κ; uniform sites; C(h) = e−2h1e−h2; lag sets C1 and C2; nominal size 0.1; based on 1000 runs . . . 217
4.88 Empirical size for testing for covariance separability based on covari-ances: larger values of κ; uniform sites; C(h) = e−2h1e−h2; lag sets C3 and C4; nominal size 0.1; based on 1000 runs . . . 218
4.89 Empirical size for testing for covariance separability based on covari-ances: larger values ofκ; mixture of uniform and normal sites;C(h) = e−2h1e−h2; lag sets C1 and C2; nominal size 0.1; based on 1000 runs . . 219 4.90 Empirical size for testing for covariance separability based on
covari-ances: larger values ofκ; mixture of uniform and normal sites;C(h) = e−2h1e−h2; lag sets C3 and C4; nominal size 0.1; based on 1000 runs . . 220 4.91 Empirical power for testing for covariance separability based on
covari-ances: larger values ofκ; uniform sites; exponential covariance; lag sets C1 and C2; nominal size 0.1; based on 1000 runs . . . 221
4.92 Empirical power for testing for covariance separability based on covari-ances: larger values ofκ; uniform sites; exponential covariance; lag sets C3 and C4; nominal size 0.1; based on 1000 runs . . . 222
4.93 Empirical power for testing for covariance separability based on covari-ances: larger values of κ; mixture of uniform and normal sites; expo-nential covariance; lag sets C1 and C2; nominal size 0.1; based on 1000 runs . . . 223
4.94 Empirical power for testing for covariance separability based on covari-ances: larger values of κ; mixture of uniform and normal sites; expo-nential covariance; lag sets C3 and C4; nominal size 0.1; based on 1000 runs . . . 224
4.95 Adjusted empirical power for testing for covariance separability based on covariances: larger values ofκ; uniform sites; exponential covariance; lag sets C1 and C2; nominal size 0.1; based on 1000 runs . . . 225
4.96 Adjusted empirical power for testing for covariance separability based on covariances: larger values ofκ; uniform sites; exponential covariance; lag sets C3 and C4; nominal size 0.1; based on 1000 runs . . . 226
4.97 Adjusted empirical power for testing for covariance separability based on covariances: larger values ofκ; mixture of uniform and normal sites; exponential covariance; lag sets C1 and C2; nominal size 0.1; based on 1000 runs . . . 227
4.98 Adjusted empirical power for testing for covariance separability based on covariances: larger values ofκ; mixture of uniform and normal sites; exponential covariance; lag sets C3 and C4; nominal size 0.1; based on 1000 runs . . . 228
4.99 Empirical size for testing for covariance separability based on the spec-tral distribution function: estimating function Type 1; uniform sites; C(h) = e−2h1e−h2; vector sets D1 and D2; nominal size 0.1; based on 1000 runs . . . 229
4.100 Empirical size for testing for covariance separability based on the spec-tral distribution function: estimating function Type 1; uniform sites; C(h) = e−2h1e−h2; vector sets D3 and D4; nominal size 0.1; based on 1000 runs . . . 230
4.101 Empirical size for testing for covariance separability based on the spec-tral distribution function: estimating function Type 1; uniform sites; C(h) = e−2h1e−h2; vector sets D5 and D6; nominal size 0.1; based on 1000 runs . . . 231
4.102 Empirical size for testing for covariance separability based on the spec-tral distribution function: estimating function Type 1; mixture of uni-form and normal sites;C(h) =e−2h1e−h2; vector sets D1 and D2; nom-inal size 0.1; based on 1000 runs . . . 232
4.103 Empirical size for testing for covariance separability based on the spec-tral distribution function: estimating function Type 1; mixture of uni-form and normal sites;C(h) =e−2h1e−h2; vector sets D3 and D4; nom-inal size 0.1; based on 1000 runs . . . 233
4.104 Empirical size for testing for covariance separability based on the spec-tral distribution function: estimating function Type 1; mixture of uni-form and normal sites;C(h) =e−2h1e−h2; vector sets D5 and D6; nom-inal size 0.1; based on 1000 runs . . . 234
4.105 Empirical power for testing for covariance separability based on the spec-tral distribution function: estimating function Type 1; uniform sites; non-separable exponential covariance; vector sets D1 and D2; nominal size 0.1; based on 1000 runs . . . 235
4.106 Empirical power for testing for covariance separability based on the spec-tral distribution function: estimating function Type 1; uniform sites; non-separable exponential covariance; vector sets D3 and D4; nominal size 0.1; based on 1000 runs . . . 236
4.107 Empirical power for testing for covariance separability based on the spec-tral distribution function: estimating function Type 1; uniform sites; non-separable exponential covariance; vector sets D5 and D6; nominal size 0.1; based on 1000 runs . . . 237
4.108 Empirical power for testing for covariance separability based on the spectral distribution function: estimating function Type 1; mixture of uniform and normal sites; non-separable exponential covariance; vector sets D1 and D2; nominal size 0.1; based on 1000 runs . . . 238
4.109 Empirical power for testing for covariance separability based on the spectral distribution function: estimating function Type 1; mixture of uniform and normal sites; non-separable exponential covariance; vector sets D3 and D4; nominal size 0.1; based on 1000 runs . . . 239
4.110 Empirical power for testing for covariance separability based on the spectral distribution function: estimating function Type 1; mixture of uniform and normal sites; non-separable exponential covariance; vector sets D5 and D6; nominal size 0.1; based on 1000 runs . . . 240
4.111 Empirical power for testing for covariance separability based on the spec-tral distribution function: estimating function Type 1; uniform sites; non-separable Mat´ern covariance; vector sets D1 and D2; nominal size 0.1; based on 1000 runs . . . 241
4.112 Empirical power for testing for covariance separability based on the spec-tral distribution function: estimating function Type 1; uniform sites; non-separable Mat´ern covariance; vector sets D3 and D4; nominal size 0.1; based on 1000 runs . . . 242
4.113 Empirical power for testing for covariance separability based on the spec-tral distribution function: estimating function Type 1; uniform sites; non-separable Mat´ern covariance; vector sets D5 and D6; nominal size 0.1; based on 1000 runs . . . 243
4.114 Empirical power for testing for covariance separability based on the spectral distribution function: estimating function Type 1; mixture of uniform and normal sites; non-separable Mat´ern covariance; vector sets D1 and D2; nominal size 0.1; based on 1000 runs . . . 244
4.115 Empirical power for testing for covariance separability based on the spectral distribution function: estimating function Type 1; mixture of uniform and normal sites; non-separable Mat´ern covariance; vector sets D3 and D4; nominal size 0.1; based on 1000 runs . . . 245
4.116 Empirical power for testing for covariance separability based on the spectral distribution function: estimating function Type 1; mixture of uniform and normal sites; non-separable Mat´ern covariance; vector sets D5 and D6; nominal size 0.1; based on 1000 runs . . . 246
4.117 Adjusted empirical power for testing for covariance separability based on the spectral distribution function: estimating function Type 1; uni-form sites; non-separable exponential covariance; vector sets D1 and D2; nominal size 0.1; based on 1000 runs . . . 247
4.118 Adjusted empirical power for testing for covariance separability based on the spectral distribution function: estimating function Type 1; uni-form sites; non-separable exponential covariance; vector sets D3 and D4; nominal size 0.1; based on 1000 runs . . . 248
4.119 Adjusted empirical power for testing for covariance separability based on the spectral distribution function: estimating function Type 1; uni-form sites; non-separable exponential covariance; vector sets D5 and D6; nominal size 0.1; based on 1000 runs . . . 249
4.120 Adjusted empirical power for testing for covariance separability based on the spectral distribution function: estimating function Type 1; mix-ture of uniform and normal sites; non-separable exponential covariance; vector sets D1 and D2; nominal size 0.1; based on 1000 runs . . . 250
4.121 Adjusted empirical power for testing for covariance separability based on the spectral distribution function: estimating function Type 1; mix-ture of uniform and normal sites; non-separable exponential covariance; vector sets D3 and D4; nominal size 0.1; based on 1000 runs . . . 251
4.122 Adjusted empirical power for testing for covariance separability based on the spectral distribution function: estimating function Type 1; mix-ture of uniform and normal sites; non-separable exponential covariance; vector sets D5 and D6; nominal size 0.1; based on 1000 runs . . . 252
4.123 Adjusted empirical power for testing for covariance separability based on the spectral distribution function: estimating function Type 1; uniform sites; non-separable Mat´ern covariance; vector sets D1 and D2; nominal size 0.1; based on 1000 runs . . . 253
4.124 Adjusted empirical power for testing for covariance separability based on the spectral distribution function: estimating function Type 1; uniform sites; non-separable Mat´ern covariance; vector sets D3 and D4; nominal size 0.1; based on 1000 runs . . . 254
4.125 Adjusted empirical power for testing for covariance separability based on the spectral distribution function: estimating function Type 1; uniform sites; non-separable Mat´ern covariance; vector sets D5 and D6; nominal size 0.1; based on 1000 runs . . . 255
4.126 Adjusted empirical power for testing for covariance separability based on the spectral distribution function: estimating function Type 1; mixture of uniform and normal sites; non-separable Mat´ern covariance; vector sets D1 and D2; nominal size 0.1; based on 1000 runs . . . 256
4.127 Adjusted empirical power for testing for covariance separability based on the spectral distribution function: estimating function Type 1; mixture of uniform and normal sites; non-separable Mat´ern covariance; vector sets D3 and D4; nominal size 0.1; based on 1000 runs . . . 257
4.128 Adjusted empirical power for testing for covariance separability based on the spectral distribution function: estimating function Type 1; mixture of uniform and normal sites; non-separable Mat´ern covariance; vector sets D5 and D6; nominal size 0.1; based on 1000 runs . . . 258
4.129 Empirical size for testing for covariance separability based on the spec-tral distribution function: larger values ofCfor smaller grid sizeλn= 12;
estimating function Type 1; uniform sites; C(h) = e−2h1e−h2; vector sets D1 - D6; nominal size 0.1; based on 1000 runs . . . 259
4.130 Empirical size for testing for covariance separability based on the spec-tral distribution function: larger values of C for smaller grid size λn =
12; estimating function Type 1; mixture of uniform and normal sites; C(h) =e−2h1e−h2; vector sets D1 - D6; nominal size 0.1; based on 1000 runs . . . 260
4.131 Empirical power for testing for covariance separability based on the spectral distribution function: larger values of C for smaller grid size λn = 12; estimating function Type 1; uniform sites; non-separable
ex-ponential covariance; vector sets D1 - D6; nominal size 0.1; based on 1000 runs . . . 261
4.132 Empirical power for testing for covariance separability based on the spectral distribution function: larger values of C for smaller grid size λn = 12; estimating function Type 1; mixture of uniform and normal
sites; non-separable exponential covariance; vector sets D1 - D6; nominal size 0.1; based on 1000 runs . . . 262
4.133 Empirical power for testing for covariance separability based on the spec-tral distribution function: larger values ofCfor smaller grid sizeλn= 12;
estimating function Type 1; uniform sites; non-separable Mat´ern covari-ance; vector sets D1 - D6; nominal size 0.1; based on 1000 runs . . . . 263
4.134 Empirical power for testing for covariance separability based on the spectral distribution function: larger values of C for smaller grid size λn = 12; estimating function Type 1; mixture of uniform and normal
sites; non-separable Mat´ern covariance; vector sets D1 - D6; nominal size 0.1; based on 1000 runs . . . 264
4.135 Adjusted empirical power for testing for covariance separability based on the spectral distribution function: larger values ofC for smaller grid sizeλn= 12; estimating function Type 1; uniform sites; non-separable
exponential covariance; vector sets D1 - D6; nominal size 0.1; based on 1000 runs . . . 265
4.136 Adjusted empirical power for testing for covariance separability based on the spectral distribution function: larger values ofCfor smaller grid size λn = 12; estimating function Type 1; mixture of uniform and normal
sites; non-separable exponential covariance; vector sets D1 - D6; nominal size 0.1; based on 1000 runs . . . 266
4.137 Adjusted empirical power for testing for covariance separability based on the spectral distribution function: larger values ofC for smaller grid sizeλn= 12; estimating function Type 1; uniform sites; non-separable
Mat´ern covariance; vector sets D1 - D6; nominal size 0.1; based on 1000 runs . . . 267
4.138 Adjusted empirical power for testing for covariance separability based on the spectral distribution function: larger values ofCfor smaller grid size λn = 12; estimating function Type 1; mixture of uniform and normal
sites; non-separable Mat´ern covariance; vector sets D1 - D6; nominal size 0.1; based on 1000 runs . . . 268
4.139 Empirical size for testing for covariance separability based on the spec-tral distribution function: estimating function Type 2; uniform sites; C(h) = e−2h1e−h2; vector sets E1 and E2; nominal size 0.1; based on 1000 runs . . . 269
4.140 Empirical size for testing for covariance separability based on the spec-tral distribution function: estimating function Type 2; uniform sites; C(h) = e−2h1e−h2; vector sets E3 and E4; nominal size 0.1; based on 1000 runs . . . 270
4.141 Empirical size for testing for covariance separability based on the spec-tral distribution function: estimating function Type 2; mixture of uni-form and normal sites;C(h) =e−2h1e−h2; vector sets E1 and E2; nom-inal size 0.1; based on 1000 runs . . . 271
4.142 Empirical size for testing for covariance separability based on the spec-tral distribution function: estimating function Type 2; mixture of uni-form and normal sites;C(h) =e−2h1e−h2; vector sets E3 and E4; nom-inal size 0.1; based on 1000 runs . . . 272
4.143 Empirical power for testing for covariance separability based on the spec-tral distribution function: estimating function Type 2; uniform sites; non-separable exponential covariance; vector sets E1 and E2; nominal size 0.1; based on 1000 runs . . . 273
4.144 Empirical power for testing for covariance separability based on the spec-tral distribution function: estimating function Type 2; uniform sites; non-separable exponential covariance; vector sets E3 and E4; nominal size 0.1; based on 1000 runs . . . 274
4.145 Empirical power for testing for covariance separability based on the spectral distribution function: estimating function Type 2; mixture of uniform and normal sites; non-separable exponential covariance; vector sets E1 and E2; nominal size 0.1; based on 1000 runs . . . 275
4.146 Empirical power for testing for covariance separability based on the spectral distribution function: estimating function Type 2; mixture of uniform and normal sites; non-separable exponential covariance; vector sets E3 and E4; nominal size 0.1; based on 1000 runs . . . 276
4.147 Adjusted empirical power for testing for covariance separability based on the spectral distribution function: estimating function Type 2; uni-form sites; non-separable exponential covariance; vector sets E1 and E2; nominal size 0.1; based on 1000 runs . . . 277
4.148 Adjusted empirical power for testing for covariance separability based on the spectral distribution function: estimating function Type 2; uni-form sites; non-separable exponential covariance; vector sets E3 and E4; nominal size 0.1; based on 1000 runs . . . 278
4.149 Adjusted empirical power for testing for covariance separability based on the spectral distribution function: estimating function Type 2; mix-ture of uniform and normal sites; non-separable exponential covariance; vector sets E1 and E2; nominal size 0.1; based on 1000 runs . . . 279
4.150 Adjusted empirical power for testing for covariance separability based on the spectral distribution function: estimating function Type 2; mix-ture of uniform and normal sites; non-separable exponential covariance; vector sets E3 and E4; nominal size 0.1; based on 1000 runs . . . 280
4.151 Empirical size for testing for covariance separability based on the spec-tral distribution function: estimating function Type 3; uniform sites; C(h) = e−2h1e−h2; vector sets F1 and F2; nominal size 0.1; based on 1000 runs . . . 281
4.152 Empirical size for testing for covariance separability based on the spec-tral distribution function: estimating function Type 3; uniform sites; C(h) = e−2h1e−h2; vector sets F3 and F4; nominal size 0.1; based on 1000 runs . . . 282
4.153 Empirical size for testing for covariance separability based on the spec-tral distribution function: estimating function Type 3; mixture of uni-form and normal sites;C(h) =e−2h1e−h2; vector sets F1 and F2; nom-inal size 0.1; based on 1000 runs . . . 283
4.154 Empirical size for testing for covariance separability based on the spec-tral distribution function: estimating function Type 3; mixture of uni-form and normal sites;C(h) =e−2h1e−h2; vector sets F3 and F4; nom-inal size 0.1; based on 1000 runs . . . 284
4.155 Empirical power for testing for covariance separability based on the spec-tral distribution function: estimating function Type 3; uniform sites; non-separable exponential covariance; vector sets F1 and F2; nominal size 0.1; based on 1000 runs . . . 285
4.156 Empirical power for testing for covariance separability based on the spec-tral distribution function: estimating function Type 3; uniform sites; non-separable exponential covariance; vector sets F3 and F4; nominal size 0.1; based on 1000 runs . . . 286
4.157 Empirical power for testing for covariance separability based on the spectral distribution function: estimating function Type 3; mixture of uniform and normal sites; non-separable exponential covariance; vector sets F1 and F2; nominal size 0.1; based on 1000 runs . . . 287
4.158 Empirical power for testing for covariance separability based on the spectral distribution function: estimating function Type 3; mixture of uniform and normal sites; non-separable exponential covariance; vector sets F3 and F4; nominal size 0.1; based on 1000 runs . . . 288
4.159 Adjusted empirical power for testing for covariance separability based on the spectral distribution function: estimating function Type 3; uni-form sites; non-separable exponential covariance; vector sets F1 and F2; nominal size 0.1; based on 1000 runs . . . 289
4.160 Adjusted empirical power for testing for covariance separability based on the spectral distribution function: estimating function Type 3; uni-form sites; non-separable exponential covariance; vector sets F3 and F4; nominal size 0.1; based on 1000 runs . . . 290
4.161 Adjusted empirical power for testing for covariance separability based on the spectral distribution function: estimating function Type 3; mix-ture of uniform and normal sites; non-separable exponential covariance; vector sets F1 and F2; nominal size 0.1; based on 1000 runs . . . 291
4.162 Adjusted empirical power for testing for covariance separability based on the spectral distribution function: estimating function Type 3; mix-ture of uniform and normal sites; non-separable exponential covariance; vector sets F3 and F4; nominal size 0.1; based on 1000 runs . . . 292
4.163 Coverage probability for 90% confidence regions: Mat´ern covariance; uniform sites; lag set G1; method A based on (4.47) (no maximum EL estimation), method B based on (4.46) (maximum EL estimation); nominal size 0.1; based on 1000 runs . . . 295
4.164 Coverage probability for 90% confidence regions: Mat´ern covariance; uniform sites; lag set G2; method A based on (4.47) (no maximum EL estimation), method B based on (4.46) (maximum EL estimation); nominal size 0.1; based on 1000 runs . . . 296
4.165 Coverage probability for 90% confidence regions: Mat´ern covariance; uniform sites; lag set G3; method A based on (4.47) (no maximum EL estimation), method B based on (4.46) (maximum EL estimation); nominal size 0.1; based on 1000 runs . . . 297
4.166 Coverage probability for 90% confidence regions: Mat´ern covariance; uniform sites; lag set G4; method A based on (4.47) (no maximum EL estimation), method B based on (4.46) (maximum EL estimation); nominal size 0.1; based on 1000 runs . . . 298
4.167 Coverage probability for 90% confidence regions: Mat´ern covariance; uniform sites; lag set G5; method A based on (4.47) (no maximum EL estimation), method B based on (4.46) (maximum EL estimation); nominal size 0.1; based on 1000 runs . . . 299
4.168 Coverage probability for 90% confidence regions: Mat´ern covariance; mixture of uniform and normal sites; lag set G1; method A based on (4.47) (no maximum EL estimation), method B based on (4.46) (maxi-mum EL estimation); nominal size 0.1; based on 1000 runs . . . 300
4.169 Coverage probability for 90% confidence regions: Mat´ern covariance; mixture of uniform and normal sites; lag set G2; method A based on (4.47) (no maximum EL estimation), method B based on (4.46) (maxi-mum EL estimation); nominal size 0.1; based on 1000 runs . . . 301
4.170 Coverage probability for 90% confidence regions: Mat´ern covariance; mixture of uniform and normal sites; lag set G3; method A based on (4.47) (no maximum EL estimation), method B based on (4.46) (maxi-mum EL estimation); nominal size 0.1; based on 1000 runs . . . 302
4.171 Coverage probability for 90% confidence regions: Mat´ern covariance; mixture of uniform and normal sites; lag set G4; method A based on (4.47) (no maximum EL estimation), method B based on (4.46) (maxi-mum EL estimation); nominal size 0.1; based on 1000 runs . . . 303
4.172 Coverage probability for 90% confidence regions: Mat´ern covariance; mixture of uniform and normal sites; lag set G5; method A based on (4.47) (no maximum EL estimation), method B based on (4.46) (maxi-mum EL estimation); nominal size 0.1; based on 1000 runs . . . 304
4.173 Coverage probability for 90% confidence intervals: exponential covari-ance; uniform sites; lag set H1; method A based on (4.47) (no maximum EL estimation), method B based on (4.46) (maximum EL estimation); nominal size 0.1; based on 1000 runs . . . 305
4.174 Coverage probability for 90% confidence intervals: exponential covari-ance; uniform sites; lag set H2; method A based on (4.47) (no maximum EL estimation), method B based on (4.46) (maximum EL estimation); nominal size 0.1; based on 1000 runs . . . 306
4.175 Coverage probability for 90% confidence intervals: exponential covari-ance; uniform sites; lag set H3; method A based on (4.47) (no maximum EL estimation), method B based on (4.46) (maximum EL estimation); nominal size 0.1; based on 1000 runs . . . 307
4.176 Coverage probability for 90% confidence intervals: exponential covari-ance; uniform sites; lag set H4; method A based on (4.47) (no maximum EL estimation), method B based on (4.46) (maximum EL estimation); nominal size 0.1; based on 1000 runs . . . 308
4.177 Coverage probability for 90% confidence intervals: exponential covari-ance; uniform sites; lag set H5; method A based on (4.47) (no maximum EL estimation), method B based on (4.46) (maximum EL estimation); nominal size 0.1; based on 1000 runs . . . 309
4.178 Coverage probability for 90% confidence intervals: exponential covari-ance; uniform sites; lag set H6; method A based on (4.47) (no maximum EL estimation), method B based on (4.46) (maximum EL estimation); nominal size 0.1; based on 1000 runs . . . 310
4.179 Coverage probability for 90% confidence intervals: exponential covari-ance; uniform sites; lag set H7; method A based on (4.47) (no maximum EL estimation), method B based on (4.46) (maximum EL estimation); nominal size 0.1; based on 1000 runs . . . 311
4.180 Coverage probability for 90% confidence intervals: exponential covari-ance; mixture of uniform and normal sites; lag set H1; method A based on (4.47) (no maximum EL estimation), method B based on (4.46) (max-imum EL estimation); nominal size 0.1; based on 1000 runs . . . 312
4.181 Coverage probability for 90% confidence intervals: exponential covari-ance; mixture of uniform and normal sites; lag set H2; method A based on (4.47) (no maximum EL estimation), method B based on (4.46) (max-imum EL estimation); nominal size 0.1; based on 1000 runs . . . 313
4.182 Coverage probability for 90% confidence intervals: exponential covari-ance; mixture of uniform and normal sites; lag set H3; method A based on (4.47) (no maximum EL estimation), method B based on (4.46) (max-imum EL estimation); nominal size 0.1; based on 1000 runs . . . 314
4.183 Coverage probability for 90% confidence intervals: exponential covari-ance; mixture of uniform and normal sites; lag set H4; method A based on (4.47) (no maximum EL estimation), method B based on (4.46) (max-imum EL estimation); nominal size 0.1; based on 1000 runs . . . 315
4.184 Coverage probability for 90% confidence intervals: exponential covari-ance; mixture of uniform and normal sites; lag set H5; method A based on (4.47) (no maximum EL estimation), method B based on (4.46) (max-imum EL estimation); nominal size 0.1; based on 1000 runs . . . 316
4.185 Coverage probability for 90% confidence intervals: exponential covari-ance; mixture of uniform and normal sites; lag set H6; method A based on (4.47) (no maximum EL estimation), method B based on (4.46) (max-imum EL estimation); nominal size 0.1; based on 1000 runs . . . 317
4.186 Coverage probability for 90% confidence intervals: exponential covari-ance; mixture of uniform and normal sites; lag set H7; method A based on (4.47) (no maximum EL estimation), method B based on (4.46) (max-imum EL estimation); nominal size 0.1; based on 1000 runs . . . 318
LIST OF FIGURES
2.1 An example of the blocking scheme, showing irregularly located spatial data in a 12×12 sampling region in R2, along with a superimposed
integer grid and overlapping rectangular data blocks (b= 3). . . 13
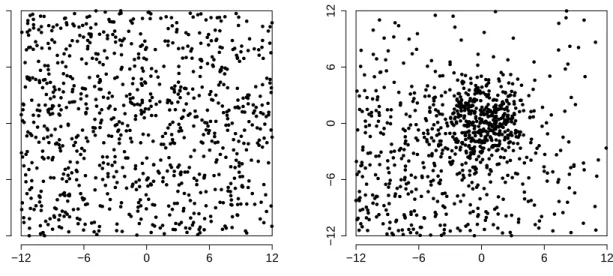
2.2 Example of uniform (left) and non-uniform (right) locations on a 24×24 grid with n= 900 points . . . 20
2.3 Empirical power functions for SBEL goodness-of-fit tests of normality using three sets of estimating functions and block sizes b= 2, 4, and 6 on a 12×12 region, sample sizen= 100, and uniform and non-uniform locations; data are marginally normal, log-normal,t2,t20,χ21, and χ220. 25
2.4 Empirical power functions for SBEL goodness-of-fit tests of normality using three sets of estimating functions and block sizes b= 4, 6, and 8 on a 24×24 region, sample sizen= 100, and uniform and non-uniform locations; data are marginally normal, log-normal,t2,t20,χ21, and χ220. 26
2.5 Region for average January temperature data . . . 27
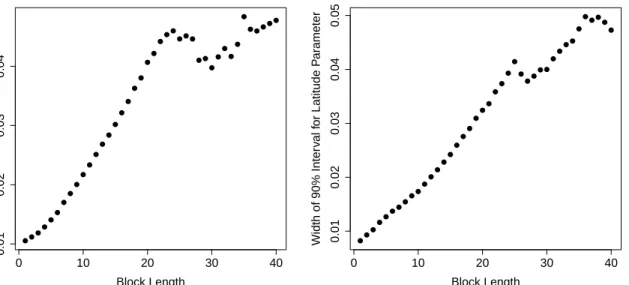
2.6 Lengths of 90% CIs by block size for longitude (left) and latitude (right) regression parameters . . . 28
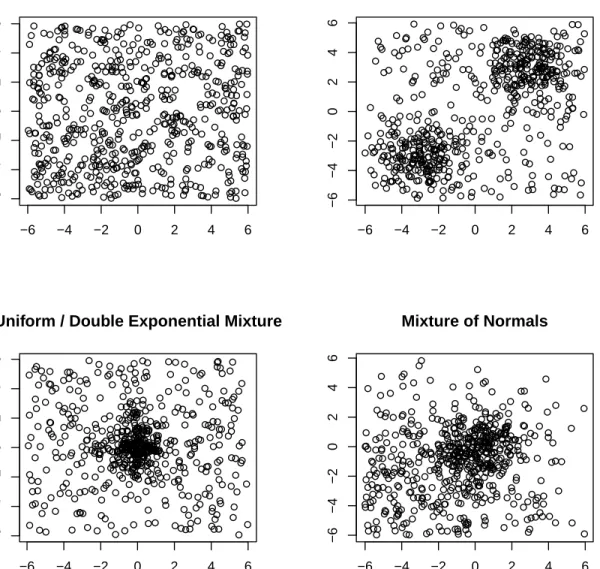
4.1 Example of uniform (top left), normal / uniform mixture (top right), uniform / double exponential mixture (bottom left), and mixture of normals locations on a 12×12 grid with n= 600 points . . . 122
ACKNOWLEDGEMENTS
I would like to express my deepest appreciation to my advisor, Dr. Daniel J. Nordman. I am grateful for his advice, guidance, patience, and assistance. Without his tireless efforts, I could not possibly have completed this thesis, especially in such a timely manner. His direction gave me the motivation to keep forging ahead, even at times when progress was slow and I felt like I was sailing into headwinds. I feel incredibly fortunate to have had the opportunity to work with him. I also want to thank Dr. Nordman for the quality of the classes he taught. His Stat 642 class was the most rewarding course I took here.
I would also like to thank Dr. Soutir Bandyopadhyay for his assistance as co-advisor and his indispensable contributions to this work. I likewise want to thank Dr. Zhengyuan Zhu for his essential contributions.
I also want to thank the rest of my committee, Professors Petrut¸a Caragea, Mark Kaiser, and Huaiqing Wu, for their time and effort during this process.
ABSTRACT
Empirical likelihood (EL) is a statistical framework that allows for likelihood-type inference without explicit distributional assumptions. EL formulates a likelihood function nonparamet-rically, producing likelihood ratio statistics for use in constructing confidence intervals and performing tests. EL ratio statistics have properties analogous to parametric likelihood ratio statistics, such as chi-square limiting distributions.
EL methods formulated for independent data typically fail when applied to dependent random processes. There are two primary ways to adapt EL to dependent data. One is through the use of data blocking techniques, where data blocking aims to capture the local dependence structure. The other general approach is through a data transformation to typically weaken the dependence structure, often involving analysis in the frequency domain. A variety of EL methods have been developed for time series, but the application of EL to spatial data, particularly irregularly located spatial data, has received far less attention.
We investigate two different EL methods for irregularly located spatial data. The first is a blockwise EL method, which allows for inference on means, marginal distributions, and spatial regression parameters. The second is a frequency domain EL method, allowing various estimation and tests about spatial covariance structures.
One primary challenge in investigating inference methods for irregularly located spatial data is the question of the asymptotic structure. In time series, the asymptotic context derives from an increasing number of observations over time, but in the spatial setting, there are two different drivers of the asymptotic regime: the rate of growth of the number of points within the sampling region and the rate of growth of the volume of the sampling region. The growth rate of the number of points may be proportional to or greater than the growth rate of the volume of the region. These differences often cause dramatic changes in the limiting distribution of spatial statistics. A further challenge in the frequency domain setting is that the irregular
spacing eliminates orthogonality properties of discrete Fourier transforms as typical for equi-spaced time series.
For the blockwise EL method, we show that log EL ratio statistics have chi-square limiting distributions, provide results from a simulation study, and apply the method to a real data example in the context of spatial regression. For the frequency domain EL method, we also show log EL ratio statistics have chi-square limiting distributions, and we provide results from an extensive simulation study. In both cases, the EL methods are valid regardless of the exact type of spatial asymptotic structure or the concentrations of random sampling locations.
CHAPTER 1. INTRODUCTION
This dissertation investigates empirical likelihood (EL) methods for irregularly located spa-tial data. EL is a statistical methodology that defines a likelihood function nonparametrically by probability profiling data. EL has properties analogous to parametric likelihood, such as chi-square limiting distributions for likelihood ratio statistics, but EL makes no parametric model assumptions in terms of a joint distribution for the data. EL thus allows for valid inference with-out (potentially mis-specified) parametric model assumptions or stringent assumptions abwith-out the exact data generation.
EL methods were first proposed for independent data by Owen (1988 [11], 1990 [12]), but EL methods for independent data generally fail for data with temporal or spatial dependence. There are two primary ways to extend EL methods to handle dependent data. One is through the use of data blocking techniques, and the other is through analysis in the frequency domain, which effectively weakens dependence through data transformation, namely the discrete Fourier transform. For time series data, EL methods have been developed in both the time and frequency domain. In addition to showing that EL methods for independent data generally do not hold for correlated time series data, Kitamura (1997) [4] developed a blockwise EL method for time series data. Monti (1997) [7] and Nordman and Lahiri (2006) [10] proposed frequency domain EL methods for time series data.
In contrast to time series, there has been comparatively less attention on EL methods for spatial data, and much less still forirregularly located spatial data. Some work has been done on EL methods for spatial lattice data, with Nordman (2008) [8], Nordman and Caragea (2008)
[9], and Kaiser and Nordman (2012) [3] proposing blockwise EL methods for spatial lattice data. In a recent work, Bandyopadhyay, Lahiri, and Nordman (2013) [2] propose a frequency domain EL method for irregularly located spatial data. This dissertation attempts to build
on these efforts by investigating EL methods for irregularly located spatial data in both the spatial and frequency domains.
We consider spatial data generated by a general class of spatial sampling designs from Lahiri and Zhu (2006)[5]. The number of points may grow at a rate equal to or faster than the rate of growth of the volume of the sampling region. The question of the asymptotic regime is one of the primary challenges in moving from time series to spatial data. In contrast to time series, in which the asymptotic context is induced by an increasing number of observations over time, in the spatial case the asymptotic structure is influenced by the rates of growth in both the number of observations and the volume of the sampling region.
When the number of spatial sampling points increases at a rate proportional to the size of a spatial sampling region, we call this a pure increasing domain (PID) asymptotic framework. When the number of points grows at a faster rate than the volume of a sampling region, this corresponds to a situation of infill sampling, and we refer to this as a mixed increasing domain (MID) asymptotic framework.
The first method we consider is a block-based EL method for irregularly located spatial data or a spatial blockwise EL (SBEL) method. We consider irregularly located spatial sampling sites generated by a possibly non-uniform density over the sampling region in an asymptotic framework allowed to be either PID or MID. The SBEL method method applies in a unified manner to a wide class of spatial sampling designs. In particular, the SBEL allows us to conduct inference on means and marginal distributions, and it can also be readily extended to spatial regression models.
We then move from the spatial domain to the frequency domain, entering more favorable terrain for analyzing covariance structures. Due to the fact that the covariance of a weakly stationary mean square continuous random field can be expressed in terms of a spectral measure, the analysis of random fields through spectral densities allows us to more easily assess covariance structures.
The spectral analysis of irregularly spaced spatial data is complicated by the fact that the irregular spacing destroys the typical orthogonality properties of discrete Fourier transforms. A further complication is the spatial periodogram for irreguarly spaced data, explored by Matsuda
and Yajima (2009) [6] and investigated by Bandyopadhyay and Lahiri (2009) [1], has a non-trivial bias that does not vanish asymptotically. However, Bandyopadhyay and Lahiri (2009)
[1] show that for “asymptotically distant” sequences of Fourier frequencies, discrete Fourier transforms are independent. The spatial frequency domain EL method is therefore built upon periodogram values at “well-separated” sets of frequencies.
Bandyopadhyay, Lahiri, and Nordman (2013)[2]propose a frequency domain EL method for irregularly located spatial data and demonstrate that Wilks’ phenomenon holds for this method. An added complication in comparison to other cases is that not only does the distinction between PID and MID asymptotics impact results, the rate of infilling in the MID case also makes a difference. The appropriate scaling for the log EL ratio statistics to have a chi-square limit varies depending upon the asymptotic case, but a unified EL ratio statistic can be developed which has a limiting chi-square distribution in any case.
We extend this spatial EL method to problems of spatial testing by investigating the prop-erties of the maximum EL estimator. Log EL ratio statistics based on the maximum EL estimator are shown to have chi-square limits. The scaling of the likelihood ratio statistic de-pends on the asymptotic context and rate of infill sampling, although a data-based statistic can be formulated which has a chi-square limit in any case.
This dissertation contains three primary chapters. Chapter 2 develops a blockwise EL method for irregularly located spatial data which can be used for inference for means, marginal distributions, and parameters in spatial regression models. Results from a simulation study, analysis of a real data example, and proofs of the main distributional results are provided. Chapter 3 investigates a frequency domain EL method for irregularly located spatial data, which is a general method that can be applied to a wide variety of problems in spatial testing. Results from an extensive simulation study and proofs of the main distributional results for the frequency domain EL method are provided in Chapter4.
References
[1] Bandyopadhyay, S. and Lahiri, S. N. (2009). Asymptotic properties of discrete Fourier transforms for spatial data. Sankhya: The Indian Journal of Statistics, Series A71,
221-259.
[2] Bandyopadhyay, S., Lahiri, S. N., and Nordman, D. J. (2013). A frequency domain em-pirical likelihood method for irregularly spaced spatial data. Preprint.
[3] Kaiser, M. S. and Nordman, D. J. (2012). Blockwise empirical likelihood for spatial Markov model assessment. Statistics and Its Interface 5, 303-318.
[4] Kitamura, Y. (1997). Empirical likelihood methods for weakly dependent processes. The
Annals of Statistics 25, 2084-2102.
[5] Lahiri, S. N. and Zhu, J. (2006). Resampling methods for spatial regression models under a class of stochastic designs. The Annals of Statistics 34, 1774-1813.
[6] Matsuda, Y. and Yajima, Y. (2009). Fourier analysis of irregularly spaced data on Rd.
Journal of the Royal Statistical Society: Series B 71, 191-217.
[7] Monti, A. C. (1997). Empirical likelihood confidence regions in time series models. Biomet-rika 84, 395-405.
[8] Nordman, D. J. (2008). A blockwise empirical likelihood for spatial lattice data. Statistica
Sinica 18, 1111-1129.
[9] Nordman, D. J. and Caragea, P. C. (2008). Point and interval estimation of variogram models using spatial empirical likelihood. Journal of the American Statistical
Asso-ciation 103, 350-361.
[10] Nordman, D. J. and Lahiri, S. N. (2006). A frequency domain empirical likelihood for short- and long-range dependence. The Annals of Statistics 34, 3019-3050.
[11] Owen, A. B. (1988). Empirical likelihood ratio confidence intervals for a single functional.
Biometrika 75, 237-249.
[12] Owen, A. B. (1990). Empirical likelihood ratio confidence regions. The Annals of Statistics
CHAPTER 2. AN EMPIRICAL LIKELIHOOD METHOD FOR IRREGULARLY LOCATED SPATIAL DATA
A paper to be submitted to Statistica Sinica
Matthew Van Hala, Daniel J. Nordman, and Zhengyuan Zhu
Abstract
We develop an empirical likelihood (EL) method for inference over a broad class of spatial data exhibiting stochastic spatial patterns along with various levels of infill sampling. With-out stringent assumptions abWith-out the sampling design or spatial dependence structure, the EL method (based on general estimating functions) produces log-likelihood ratio statistics having chi-square limits for calibrating tests and confidence regions for spatial parameters. Maximum EL estimators are shown to be valid for asymptotically normal point estimation and formu-lating tests of spatial structure conditions. The proposed EL approach applies additionally to inference in spatial regression models with irregularly located sampling sites. The method is illustrated with a data example and investigated through simulation for calibrating confidence intervals and goodness-of-fit tests.
Key words: Blockwise Empirical Likelihood; Infill Sampling; Spatial Regression; Stationarity; Stochastic Sampling
2.1 Introduction
Introduced by Owen (1988[30], 1990[31]), empirical likelihood (EL) is a statistical method-ology for likelihood-type inference without an explicit distributional model for the data. For quantifying the plausibility of parameter values, EL formulates a non-parametric likelihood
function by probability profiling data and produces ratio statistics for constructing tests and confidence regions which have some properties analogous to fully parametric likelihood (e.g., chi-square limits). Extending EL to dependent data remains a challenge. In a pivotal work, Kitamura (1997) [19] showed that the EL version for iid data generally fails for time series in the presence of serial correlation. As a remedy, Kitamura (1997)[19] proposed a blockwise EL (BEL) for time series based on data blocking techniques which serve to capture the underlying dependence in neighboring observations. This general BEL approach has shown to be valid over several inference problems with time series (cf. Bravo, 2005 [14], 2009 [15]; Chen and Wong, 2009[16]; Lei and Qin, 2011[25]; Wu and Cao, 2011[40]); see Kitamura (2006)[20]and Nordman and Lahiri (2013)[29] for a review of EL for time series.
In contrast to the time series case, EL for spatial data has received less consideration, though some extensions exist. Nordman (2008)[26]developed a spatial BEL version for spatial processes observed on a partial grid inRd, extending Kitamura’s (1997) [19]time series results
(d= 1). Nordman and Caragea (2008) [27] considered a spatial BEL for estimating variogram model parameters, and Kaiser and Nordman (2012) [18] developed goodness-of-fit tests for spatial Markov models using BEL. Recently, Kostov (2013) [21] proposed a smoothed EL method for inference in spatial quantile regressions.
However, all of spatial EL works above are limited to spatiallatticedata, or data collected at regular locations on a grid, corresponding to a type of spatial sampling most closely connected to time series. While lattice data provide an important form of spatial data (cf. Cressie, 1993
[17], ch. 6-7), more diverse structures for spatial data are common in applications, typically involving irregularly located spatial observations. Our goal here is to advance EL methodology for inference about this form of spatial data. As a complicating factor with such data, the large-sample distribution of spatial estimators generally depends on an complex interaction of factors regarding the spatial dependence and sampling design (cf. Lahiri, 2003b [23]). These factors include the underlying generating mechanism of sampling sites, the number of spatial observations relative to the volume of a spatial sampling region (i.e., the amount of infill sampling), and the unknown correlation form of the spatial process. An advantage of EL in this setting is that the method, if appropriately formulated, can provide valid inference