Volume 3, Issue 1, pp. 395-406, 2020 DOI: https://doi.org/10.15157/IJITIS.2020.3.1.395-406
Received January 25, 2020; Accepted February 28, 2020
A Comparative Study of Machine Learning Classifiers for Credit Card
Fraud Detection
Md. Nur-E-Arefin*a1, Mohammad Sultan Mahmudb2 1
Department of Computer Science & Engineering Royal University of Dhaka, Dhaka-1213, Bangladesh
2
Department of Computer Science & Engineering,
Shenzhen University, 3688 Nanhai Boulevard, Nanshan, Shenzhen, China *[email protected];[email protected]
ABSTRACT
Now a day’s credit card transactions have been gaining popularity with the growth of e-commerce and shows tremendous opportunity for the future. Therefore, due to surge of credit card transaction, it is a crying need to secure it. Though the vendors and credit card providing authorities are showing dedication to secure the details of these transactions, researchers are searching new scopes or techniques to ensure absolute security which is the demand of time. To detect credit card fraud, along with other technologies, applications of machine learning and computational intelligence can be used and plays a vital role. For detecting credit card anomaly, this paper analyzes and compares some popular classifier algorithms. Moreover, this paper focuses on the performance of the classifiers. UCSD-FICO Data Mining Contest 2009 dataset were used to measure the performance of the classifiers. The final results of the experiment suggest that (1) meta and tree classifiers perform better than other types of classifiers, (2) though classification accuracy rate is high but fraud detection success rate is low. Finally, fraud detection rate should be taken into consideration to assess the performance of the classifiers in a credit card fraud detection system.
Keywords: Computational intelligence; e-crime; artificial intelligence; data mining; data analysis.
1. INTRODUCTION
The commerce platform is a vast marketplace. The actors which play a vital role in commerce are merchants, clients, banks, and other commercial societies. Therefore, the e-commerce system is very powerful and large. In the e-e-commerce system, the behavior of customers is not predictable at all. So, profiling of customers and judging their spending patterns is not an easy task because for that matter a lot of direct and indirect factors come into consideration. Electronic crime is a recent threat while there are other old traditional forms of crimes are being committed electronically using computers and the internet. E-crime really does cross over a whole range of different crime types. For online purchasing credit card uses has dramatically increased and that's why credit card fraud has also risen.
There are many ways for credit card frauds such as simple theft, application fraud, counterfeit cards, never received issue (NRI), and online fraud (where the card holder is not present). In online fraud, the transactions occur remotely and only the card’s details are needed. For authentication, a PIN or a card imprint are not required at the time of purchase. Though prevention mechanism like CHIP and PIN decreases the fraudulent activities through simple theft, counterfeit cards and NRI; online frauds such as internet and mail order frauds are still increasing with the number of transactions. There has been a growing amount of financial losses due to frauds as the usage of the credit cards become more and more common. As such, many papers reported huge amounts of losses in different countries (Duman E and Sahin [1]).
Currently, the major problem for e-commerce business is that fraudulent transactions appear more and more which are more likely to legitimate ones. Hence, statistical fraud detection or simple pattern matching techniques are not efficient to detect fraud because there are very few examples of fraud. Credit card transaction dataset are very much ambiguous. Generally, in real case, 99% of the transactions are legal while only 1% of them are fraud, so fraud datasets are extremely skewed. Implementation of effective fraud detection systems becomes imperative for all credit card issuing banks to avert their losses. Various modern techniques based on artificial intelligence, machine learning, data mining, fuzzy logic, genetic programming etc. has evolved in detecting credit card fraudulent transactions. The goal of this paper is to provide an up-to-date review of different approaches of classification, compare their performances applied on a wide range of challenging credit card transaction dataset, and draw conclusions on their applicability to credit card fraud detection applications. This paper is organized in several sections. Section 2 describes related works. Section 3 gives a classification algorithms review. Experimental result analysis is presented in section 4. And finally, section 5 concludes the paper.
2. STATEOFTHEART
There are many review papers describing the different types of frauds and fraud detection techniques (Ngaiet al. [2]; Zareapoor et al. [3]). Machine learning algorithms i.e., decision trees and probability trees are used in assessing credit card applications(Carter C and Catlett [4]). To generate a fraud score, a radial basis function network with a density based clustering and historical information on credit card transactions are used (Hanagandiet al. [5]). That report described a fraud and non-fraud classification, and obtained preliminary result was satisfactory. A feed-forward neural network-based fraud detection system using past data of credit card account transactions of a particular customer was developed (Ghosh S and Reilly [6]). They found that the network detected significantly more fraud with fewer false positives over rule-based fraud detection system. An online system rule-based on a neural classifier and a nonlinear Fisher's discriminant analysis for credit card operations fraud detection was also developed (Dorronsoro et al. [7]). This system is fully operational and currently handles more than 12 million operations per year with satisfactory results. Moreover, a neural multi-layer perceptron (MLP) based customer’s transaction operation classifier is another example using neural networks (Dorronsoro et al. [7]).Moreover, rule-based association system combined with the neuro-adaptive approach and fuzzy neural network approach was proposed (Brause et al. [8]).Fuzzy association rule mining in extracting knowledge for fraud from transactional credit card database is also a mentionable work (S´anchez et al. [9]).
3. CLASSIFIERALGORITHMSREVIEW
It is the aim of this study to put all methods to the test of experiment, and to give an objective assessment of their effectiveness in credit card fraud detection.
3.1 Machine Learning Classifiers
There are many kinds of classification algorithms; these are grouped into Bayesian classifiers, functions, lazy algorithms, meta algorithms, rules, trees algorithms. This section deals with different classifier algorithm models.
3.1.1Bayesian classifiers
Bayesian classifiers are statistical classifier that predicts class membership by probabilities. Several Bayes’ algorithms have been developed, such as Bayesian networks and Naïve Bayes. When applied to large databases Bayesian classifiers have showed high accuracy and speed. BayesNet classifier or Bayes network uses different search algorithms and quality measures. It is actually representing a set of random variables and their dependencies (Pearl J [10]). Suppose there are two events which could cause grass to be wet: either sprinkler or rain. The situation can be modeled with Bayes network. The probability function is:
P(G, S, R) = P(G | S, R) P (S|R) P(R) (1) where, G= grass wet(yes/no), S= sprinkler turned on(yes/no), and R= raining (yes/no).
NaïveBayes classifier belongs to the family of probabilistic classifiers based on Bayes’ theorem with the “Naïve” assumption. Given a class variable y and a dependent feature vector x1throughxn, Bayes’ theorem states the following relationship:
P(y|x1, … , xn) = P(y)P( x1, … , xn|y)
P(x1, … , xn) (2)
3.1.2 Trees
A decision tree starts from root attributes, and ends with leaf nodes. Generally, a decision tress has branches consisting of different attributes; classifier splits a dataset on the basis of discrete decisions, using certain thresholds on the attribute values. An object is misclassified by a tree if the classification output by the tree is not the same as the object’s correct class label. Some of well-known tree learning algorithms include ID3, its successor C4.5, CART, and random forest (Breiman L [11]).
3.1.3 Rules
Decision-Table is simply complex rules set and their actions. A decision table has two components: (1) a schema, which is set of different features and (2) a body, which is a multi-set of labeled instances. DTNB (Hall M and Frank [12]) is the class for decision table (DT) / Naïve Byes (NB) hybrid classifier. The algorithm divides the attributes into two disjoint subsets: one for the decision table and anther for Naïve Byes. In this algorithm all attributes are modeled by the decision table initially, and then selected attributes are modeled by Naïve Byes and the rest by the decision table. At each step the algorithm drops an attribute completely from the model. Assuming XT is the set of attributes in the DT and X┴ in NB, the overall class probability is computed as Eq. (3).
Q(y|X) = α × QDT( y|XT) × Q
NB(y|X┴)/Q(y) (3) where QDT( y|XT) and QNB(y|X┴) are the class probabilityestimates obtained from the DT and NB respectively.
OneR or 1R (short for one rule) is the simplest associative rules, which contain just one attribute in the condition part. It uses the minimum error attribute for classification. The basic idea of OneR algorithm is to find the one attribute to use and that makes less prediction error. J48 (Quinlan R [13]) is the class for generating a pruned or unpruned C4.5 decision tree. Among different decision tree algorithms C4.5 is very popular and well known. Most decision tree algorithms use a ‘pruning’ method which means that they grow a big tree and then trim some portion of it.
3.1.4 Functions
The functions group includes classifiers that can be written as mathematical equations in a reasonably natural way. SimpleLogistic builds logistic regression models fitting them using LogitBoost with simple regression functions as base learners (Landwehr et al. [14]). Logistic is an alternative implementation for designing and using a multi-nominal logistic regression model with a ridge estimator to guard against over-fitting by penalizing large coefficients.
MultilayerPerceptron (MLP) is a feed forward artificial neural network (ANN) model that maps set of input data onto a set of appropriate outputs. It consists of multiple layers of nodes in a directed graph which is fully connected from one layer to the next. Radial Basis Function (RBF) network implements a Gaussian Radial Basis Function Network, deriving the centers and widths of hidden units using K-means and combining the outputs obtained from the hidden layer using logistic regression if the class is nominal and linear regression when it is numeric.
3.1.5 Lazy
Lazy learners store the training instances and do no real work until classification time. These nearest neighbor rules are based on the concept of minimum distance classification from ‘instances’ and can involve either a single prototype or multiple prototypes.IB1(Aha Dand Kibler [15]), is a nearest-neighbor classifier, finds the training instance closest to the given test instance, and predicts the same class as the training instance by using Euclidean distance. If two or more instance has the same distance then earlier one is used.
IBk, K-nearest neighbours classifier can select suitable value of K based on cross-validation. It can be useful for both classification and regression. It also assigns weight the nearest neighbours so that they can contribute more than the distant ones.
KStar or K*is an instance-based classifier. Based on some similarity function, it tests the test instance with the class of training instance similar to it. It is different from other instance-based classifiers because it uses an entropy-based distance function.LWL (Frank et al. [16]);locally weighted learning classifier uses an instance-based algorithm to assign weight to the different instances which are later used by weight instance handler. It can do both classification (using Naïve Bayes) and regression (using linear regression). LMT (Landwehr et al. [14]); logistic model tree is a classifier which combines logistic regression (LR) and decision tree learning. It can deal with binary as well as multi-class target variables, numeric, nominal attributes and missing values. 3.1.6 Meta
Combining multiple learners to improve them into more powerful learners has been a popular topic in machine learning since the early 1990s, and research has been going on ever since.
MultiClassClassifier is a meta classifier to handle multi-class dataset with 2-class classifiers. It can also have the ability to apply error correcting output codes for increasing efficiency. Multi-class Multi-classification is totally different from multi-label Multi-classification.
Bagging classifier is an ensemble meta-estimator to reduce variance. It works for both classification and regression, depending on the base learner. In the case of classification, predictions are generated by averaging probability estimates, not by voting (Breiman L [17]).
Dagging is a meta classifier. It creates a number of disjoint, classified data and feeds each piece of data to the supplied base classifier. Majority vote win the prediction in this method.
ClassificationViaClustering, a user defined cluster algorithm is built with the training data presented to the meta-classifier and then mapping between classes and clusters is determined. This mapping is then used for predicting class labels of unseen instances and with the algorithm. Classification via Regression (Frank et al. [18]), classification is performed using regression method. END (Dong et al. [19]), a meta classifier for handling multi-class dataset along with 2-class 2-classifiers by building an ensemble of nested dichotomies. It is a good alternative to pair wise classification as well as error correcting codes.
Ordinal Class is a meta classifier that allows standard classification algorithms to be applied to ordinal class problem. Random Committee builds an ensemble of base classifiers and data, but uses a different random number of seed. A variant, named AdaBoost, short for adaptive boosting, that uses the same training set over and over and thus need not be large, but the classifiers should be simple so that they do not over-fit (Freund Y and Schapire [20]). AdaBoost can also combine an arbitrary number of base learners, not three.
4. EXPERIMENTRESULTSANDDISCUSSIONS 4.1 Data Set and Preprocessing
In order to evaluate the classifiers, UCSD-FICO Data Mining Contest 2009 dataset is used. The dataset is a real dataset of commerce transactions and the objective was to detect anomalous e-commerce transactions. There were two versions of the dataset: ‘Task 1’ and ‘Task 2’.Here‘Task 2’ version is used to evaluate of the classifiers. The dataset contains two sub datasets: (1) train set and (2) test set. The train set is labeled and the test set is unlabeled. Here only the labeled train dataset is used. It contains 100,000 transactions of 73,729 customers spanning over a period of 98 days. The dataset contains 20 fields including class label, amount, hour1, state1, zip1, custAttr1, field1, custAttr2, field2, hour2, flag1, total, field3, field4, indicator1, indicator2, flag2, flag3, flag4, flag5. It is found that custAttr1 is the account/card number and custAttr2 is e-mail id of the customer. Both these fields are unique to a particular customer and thus decided to keep only custAttr1. The fields total and amount as well as hour1 and hour2 are found to be the same for each customer and thus removed total and hour2. Similarly, state1 and zip1 are also found to be representing the same information and thus removed state1. All other fields are anonymized and therefore decided to keep them as they are. Hence, final dataset contains 16 fields: amount, hour1, zip1, custAttr1, field1, field2, flag1, field3, field4, indicator1, indicator2, flag2, flag3, flag4, flag5, and class. Among 100,000 credit transactions 97,346 (98.35%) of these being Class 0 (normal transaction) and 2,654 (2.65%) Class 1 (anomaly).
4.2 Experiment Setup
The experiments are designed to detect the fraud transaction (anomaly) using customer’s data where has 16 attributes. Tests are performed in order to gain experimental evidence about different machine learning algorithms. The experiment focused on two distinct types of test (1)
train-test, and (2) cross-validation. Firstly, in train-test, the dataset is divided into two parts: one for train and another for test, where 66,000 (66%) used as train set, and remaining 34,000 (34%) used as test set to verify the accuracy of classifiers. Secondly, for moderate-sized samples, cross-validation (fold 10) is applied. To run the experiment, WEKA machine learning tools were used.
4.3 Performance Measures
The performance of the classifiers was evaluated in terms of classification metrics relevant to credit card fraud detection. Some commonly used evaluation measures include correctly classified rate, fraud detection rate, Kappa statistic, precision, recall, f-measure, and ROC area. The performance of this model evaluated with the help of following metrics:
𝐴𝑐𝑐𝑢𝑟𝑎𝑐𝑦 =𝑁𝑢𝑚𝑏𝑒𝑟 𝑜𝑓 𝑐𝑜𝑟𝑟𝑒𝑐𝑡 𝑝𝑟𝑒𝑑𝑖𝑐𝑡𝑖𝑜𝑛𝑠𝑇𝑜𝑡𝑎𝑙 𝑛𝑢𝑚𝑏𝑒𝑟 𝑜𝑓 𝑝𝑟𝑒𝑑𝑖𝑐𝑡𝑖𝑜𝑛𝑠 = 𝑡𝑝+𝑡𝑛+𝑓𝑝+𝑓𝑛𝑡𝑝+𝑡𝑛 (4) 𝑃𝑟𝑒𝑐𝑖𝑠𝑖𝑜𝑛 = 𝐶𝑜𝑛𝑓𝑖𝑑𝑒𝑛𝑐𝑒 =𝑡𝑝+𝑓𝑝𝑡𝑝 (5) 𝑅𝑒𝑐𝑎𝑙𝑙 = 𝑆𝑒𝑛𝑠𝑖𝑡𝑖𝑣𝑖𝑡𝑦 =𝑡𝑝+𝑓𝑛𝑡𝑝 (6) 𝐹 = 2 (𝑃𝑟𝑒𝑐𝑖𝑠𝑖𝑜𝑛 × 𝑅𝑒𝑐𝑎𝑙𝑙𝑃𝑟𝑒𝑐𝑖𝑠𝑖𝑜𝑛+ 𝑅𝑒𝑐𝑎𝑙𝑙) (7) 𝑀𝐴𝐸 =𝑛1∑𝑛𝑖=1|𝑝𝑖 − 𝑎𝑖| (8) 𝑅𝑀𝑆𝐸 = √𝑛1∑𝑛 (𝑝𝑖 − 𝑎𝑖)2 𝑖=1 (9) where 𝑝𝑖 is the predicted and 𝑎𝑖 the actual value.
4.4 Results Analysis and Discussion
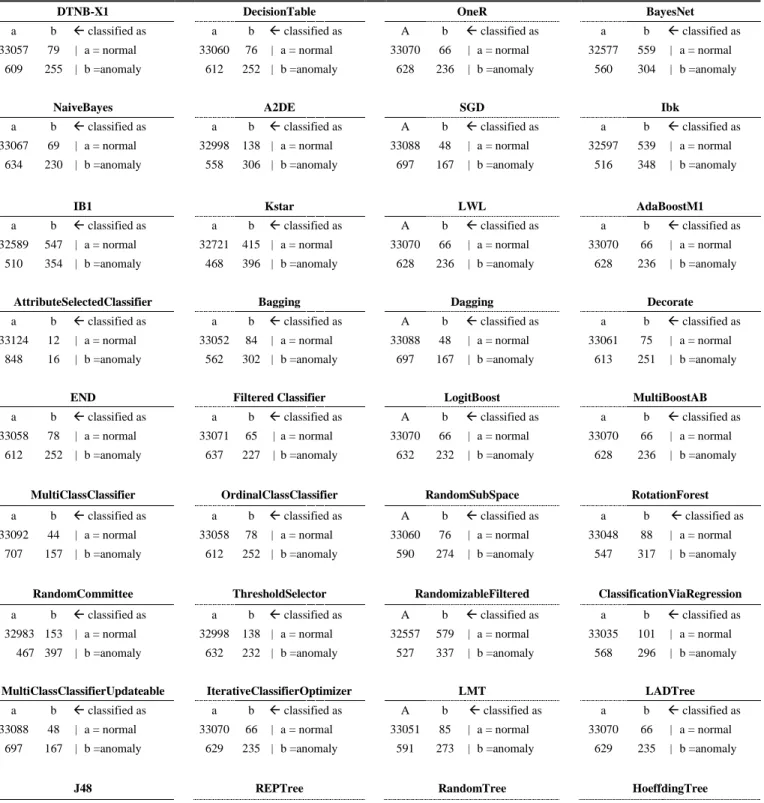
Consider, the anomaly detecting capability of machine learning algorithms can be characterized using confusion matrices shown in table 1 and 2;showing results relative to the low misclassification error. It is noted that, in train-test experiment approximately 97.35% of the data belong to class 0 (normal). At the other extreme, there are 1790 (67.45%) examples among 2654 of Class 1 (anomaly) in the learning set. From confusion matrix in Table 1, it is observed that the machine learning algorithms IBk, IB1, KStar, RandomCommittee, and RandomTree give comparatively good results, and can detect fraud 348 (35.27%), 354 (40.97%), 396 (45.83%), 397 (45.94%), and 399 (46.18%) respectively. AttributeSelectedClassifier performs worst and along with Dagging, MultiClassClassifier, and MultiClassClassifierUpdateable give poorer results than others classifier for the fraud detection rate (less than 20%).
Furthermore, in Table 2, the cross-validation (fold 10) test confusion matrixes are shown. Here, Ibk, has fraud detection rate of 42.27% (1122), similar to IB1 42.57% (1130), RandomizableFiltered 43.70% (1160) and REPTree 40.73% (1081). The best results are given by RotationForest (49.17%), Kstar (48.30%), RandomCommittee (47.36%) and RandomTree (47.28%). Table 3 and Table 4 illustrate performance comparisons of the 36 classifiers. The results of experiment 1 in Table 3 suggest: BayesNet, IBk, IB1, and RandomizableFiltered classifiers perform poorly.DTNB-X1, DecisionTable, OneR, NaiveBayes, A2DE, LWL,
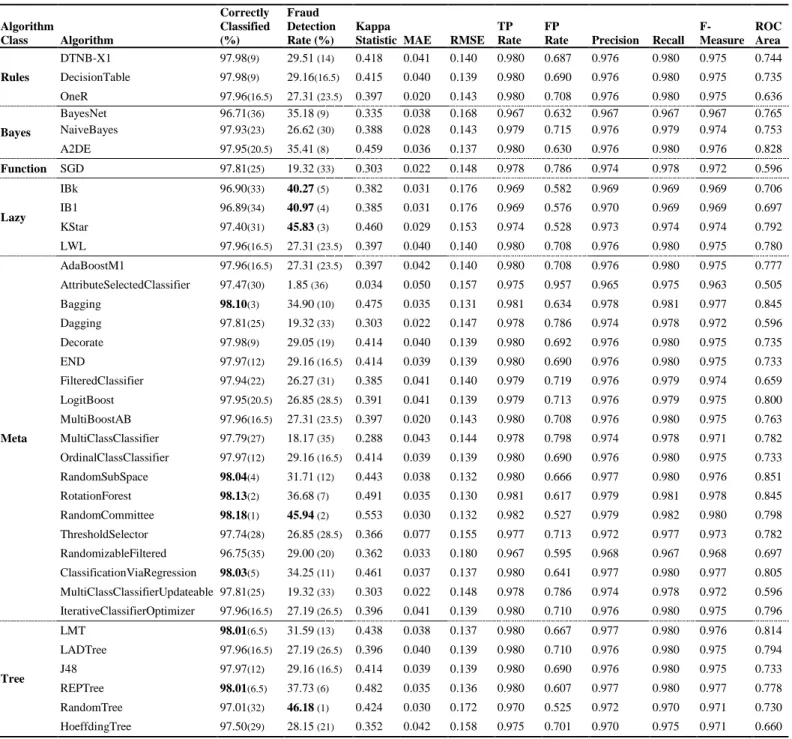
OrdinalClassClassifier, IterativeClassifierOptimizer, LMT, and J48 achieve almost similar accuracy rate around 97.97%.The best result for the ‘meta’ algorithms obtained by Bagging, RandomSubSpace, RotationForest, RandomCommittee, and ClassificationViaRegression are 98.10%, 98.04%, 98.13%, 98.18%, and 98.03% respectively. The best result for the ‘tree’ algorithms obtained by LMT and REPTree with equal classification rate, which is 98.01%.
Table 1: Confusion matrix of various classifier algorithms (2 classes, 16 attributes, (train, test) = (66000, 34000) observations).
DTNB-X1 DecisionTable OneR BayesNet
a b classified as a b classified as A b classified as a b classified as 33057 79 | a = normal 33060 76 | a = normal 33070 66 | a = normal 32577 559 | a = normal
609 255 | b =anomaly 612 252 | b =anomaly 628 236 | b =anomaly 560 304 | b =anomaly
NaiveBayes A2DE SGD Ibk
a b classified as a b classified as A b classified as a b classified as 33067 69 | a = normal 32998 138 | a = normal 33088 48 | a = normal 32597 539 | a = normal
634 230 | b =anomaly 558 306 | b =anomaly 697 167 | b =anomaly 516 348 | b =anomaly
IB1 Kstar LWL AdaBoostM1
a b classified as a b classified as A b classified as a b classified as 32589 547 | a = normal 32721 415 | a = normal 33070 66 | a = normal 33070 66 | a = normal
510 354 | b =anomaly 468 396 | b =anomaly 628 236 | b =anomaly 628 236 | b =anomaly
AttributeSelectedClassifier Bagging Dagging Decorate
a b classified as a b classified as A b classified as a b classified as 33124 12 | a = normal 33052 84 | a = normal 33088 48 | a = normal 33061 75 | a = normal
848 16 | b =anomaly 562 302 | b =anomaly 697 167 | b =anomaly 613 251 | b =anomaly
END Filtered Classifier LogitBoost MultiBoostAB
a b classified as a b classified as A b classified as a b classified as 33058 78 | a = normal 33071 65 | a = normal 33070 66 | a = normal 33070 66 | a = normal
612 252 | b =anomaly 637 227 | b =anomaly 632 232 | b =anomaly 628 236 | b =anomaly
MultiClassClassifier OrdinalClassClassifier RandomSubSpace RotationForest a b classified as a b classified as A b classified as a b classified as 33092 44 | a = normal 33058 78 | a = normal 33060 76 | a = normal 33048 88 | a = normal
707 157 | b =anomaly 612 252 | b =anomaly 590 274 | b =anomaly 547 317 | b =anomaly
RandomCommittee ThresholdSelector RandomizableFiltered ClassificationViaRegression a b classified as a b classified as A b classified as a b classified as 32983 153 | a = normal 32998 138 | a = normal 32557 579 | a = normal 33035 101 | a = normal
467 397 | b =anomaly 632 232 | b =anomaly 527 337 | b =anomaly 568 296 | b =anomaly
MultiClassClassifierUpdateable IterativeClassifierOptimizer LMT LADTree a b classified as a b classified as A b classified as a b classified as 33088 48 | a = normal 33070 66 | a = normal 33051 85 | a = normal 33070 66 | a = normal
697 167 | b =anomaly 629 235 | b =anomaly 591 273 | b =anomaly 629 235 | b =anomaly
a b classified as a b classified as A b classified as a b classified as 33058 78 | a = normal 32998 138 | a = normal 32583 553 | a = normal 32906 230 | a = normal
612 252 | b =anomaly 538 326 | b =anomaly 465 399 | b =anomaly 621 243 | b =anomaly
Table 2: Confusion matrix of various classifier algorithms (2 classes, 16 attributes, (cross-validation (fold-10) observations).
DTNB DecisionTable OneR BayesNet
a b <-- classified as a b <-- classified as A B <-- classified as a b <-- classified as 96645 701 | a = normal 97153 193 | a = normal 97187 159 | a = normal 95774 1572 | a = normal
1673 981 | b =anomaly 1880 774 | b =anomaly 1945 709 | b =anomaly 1714 940 | b =anomaly
NaiveBayes A2DE SGD IBk
a b <-- classified as a b <-- classified as A B <-- classified as a b <-- classified as 97150 196 | a = normal 96964 382 | a = normal 97232 114 | a = normal 95773 1573 | a = normal
1963 691 | b =anomaly 1716 938 | b =anomaly 2148 506 | b =anomaly 1532 1122 | b =anomaly
IB1 KStar LWL AdaBoostM1
a b <-- classified as a b <-- classified as A B <-- classified as a b <-- classified as 95749 1597 | a = normal 96164 1182 | a = normal 97185 161 | a = normal 97185 161 | a = normal
1524 1130 | b =anomaly 1372 1282 | b =anomaly 1945 709 | b =anomaly 1945 709 | b =anomaly
AttributeSelectedClassifier Bagging Dagging Decorate
a b <-- classified as a b <-- classified as A B <-- classified as a b <-- classified as 97134 212 | a = normal 97101 245 | a = normal 97187 159 | a = normal 97139 207 | a = normal
2038 616 | b =anomaly 1616 1028 | b =anomaly 1945 709 | b =anomaly 1837 817 | b =anomaly
END Filtered Classifier LogitBoost MultiBoostAB
a b <-- classified as a b <-- classified as A B <-- classified as a b <-- classified as 97140 206 | a = normal 97158 188 | a = normal 97186 160 | a = normal 97185 161 | a = normal
1840 814 | b =anomaly 1901 753 | b =anomaly 1958 696 | b =anomaly 1945 709 | b =anomaly
MultiClassClassifier OrdinalClassClassifier RandomSubSpace RotationForest a b <-- classified as a b <-- classified as A B <-- classified as a b <-- classified as 97239 107 | a = normal 97140 206 | a = normal 97142 204 | a = normal 96941 405 | a = normal
2182 472 | b =anomaly 1840 814 | b =anomaly 1759 895 | b =anomaly 1349 1305 | b =anomaly
RandomCommittee ThresholdSelector RandomizableFiltered ClassificationViaRegression a b <-- classified as a b <-- classified as A B <-- classified as a b <-- classified as 96877 469 | a = normal 97061 285 | a = normal 95765 1581 | a = normal 97074 272 | a = normal
1397 1257 | b =anomaly 1984 670 | b =anomaly 1494 1160 | b =anomaly 1761 893 | b =anomaly
MultiClassClassifierUpdateable IterativeClassifierOptimizer LMT LADTree a b <-- classified as a b <-- classified as A B <-- classified as a b <-- classified as 97232 114 | a = normal 97188 158 | a = normal 97107 239 | a = normal 97159 187 | a = normal
2148 506 | b =anomaly 1952 702 | b = anomaly 1820 834 | b =anomaly 1917 737 | b = anomaly
J48 REPTree RandomTree HoeffdingTree
97140 206 | a = normal 96987 359 | a = normal 95801 1545 | a = normal 96660 686 | a = normal 1840 814 | b =anomaly 1573 1081 | b =anomaly 1399 1255 | b =anomaly 1922 732 | b =anomaly
Table 3: Performance comparison of various classifier algorithms (2 classes, 16 attributes, (train, test) = (66000, 34000) observations). Algorithm Class Algorithm Correctly Classified (%) Fraud Detection Rate (%) Kappa
Statistic MAE RMSE TP Rate
FP
Rate Precision Recall F-Measure ROC Area Rules DTNB-X1 97.98(9) 29.51 (14) 0.418 0.041 0.140 0.980 0.687 0.976 0.980 0.975 0.744 DecisionTable 97.98(9) 29.16(16.5) 0.415 0.040 0.139 0.980 0.690 0.976 0.980 0.975 0.735 OneR 97.96(16.5) 27.31 (23.5) 0.397 0.020 0.143 0.980 0.708 0.976 0.980 0.975 0.636 Bayes BayesNet 96.71(36) 35.18 (9) 0.335 0.038 0.168 0.967 0.632 0.967 0.967 0.967 0.765 NaiveBayes 97.93(23) 26.62 (30) 0.388 0.028 0.143 0.979 0.715 0.976 0.979 0.974 0.753 A2DE 97.95(20.5) 35.41 (8) 0.459 0.036 0.137 0.980 0.630 0.976 0.980 0.976 0.828 Function SGD 97.81(25) 19.32 (33) 0.303 0.022 0.148 0.978 0.786 0.974 0.978 0.972 0.596 Lazy IBk 96.90(33) 40.27 (5) 0.382 0.031 0.176 0.969 0.582 0.969 0.969 0.969 0.706 IB1 96.89(34) 40.97 (4) 0.385 0.031 0.176 0.969 0.576 0.970 0.969 0.969 0.697 KStar 97.40(31) 45.83 (3) 0.460 0.029 0.153 0.974 0.528 0.973 0.974 0.974 0.792 LWL 97.96(16.5) 27.31 (23.5) 0.397 0.040 0.140 0.980 0.708 0.976 0.980 0.975 0.780 Meta AdaBoostM1 97.96(16.5) 27.31 (23.5) 0.397 0.042 0.140 0.980 0.708 0.976 0.980 0.975 0.777 AttributeSelectedClassifier 97.47(30) 1.85 (36) 0.034 0.050 0.157 0.975 0.957 0.965 0.975 0.963 0.505 Bagging 98.10(3) 34.90 (10) 0.475 0.035 0.131 0.981 0.634 0.978 0.981 0.977 0.845 Dagging 97.81(25) 19.32 (33) 0.303 0.022 0.147 0.978 0.786 0.974 0.978 0.972 0.596 Decorate 97.98(9) 29.05 (19) 0.414 0.040 0.139 0.980 0.692 0.976 0.980 0.975 0.735 END 97.97(12) 29.16 (16.5) 0.414 0.039 0.139 0.980 0.690 0.976 0.980 0.975 0.733 FilteredClassifier 97.94(22) 26.27 (31) 0.385 0.041 0.140 0.979 0.719 0.976 0.979 0.974 0.659 LogitBoost 97.95(20.5) 26.85 (28.5) 0.391 0.041 0.139 0.979 0.713 0.976 0.979 0.975 0.800 MultiBoostAB 97.96(16.5) 27.31 (23.5) 0.397 0.020 0.143 0.980 0.708 0.976 0.980 0.975 0.763 MultiClassClassifier 97.79(27) 18.17 (35) 0.288 0.043 0.144 0.978 0.798 0.974 0.978 0.971 0.782 OrdinalClassClassifier 97.97(12) 29.16 (16.5) 0.414 0.039 0.139 0.980 0.690 0.976 0.980 0.975 0.733 RandomSubSpace 98.04(4) 31.71 (12) 0.443 0.038 0.132 0.980 0.666 0.977 0.980 0.976 0.851 RotationForest 98.13(2) 36.68 (7) 0.491 0.035 0.130 0.981 0.617 0.979 0.981 0.978 0.845 RandomCommittee 98.18(1) 45.94 (2) 0.553 0.030 0.132 0.982 0.527 0.979 0.982 0.980 0.798 ThresholdSelector 97.74(28) 26.85 (28.5) 0.366 0.077 0.155 0.977 0.713 0.972 0.977 0.973 0.782 RandomizableFiltered 96.75(35) 29.00 (20) 0.362 0.033 0.180 0.967 0.595 0.968 0.967 0.968 0.697 ClassificationViaRegression 98.03(5) 34.25 (11) 0.461 0.037 0.137 0.980 0.641 0.977 0.980 0.977 0.805 MultiClassClassifierUpdateable 97.81(25) 19.32 (33) 0.303 0.022 0.148 0.978 0.786 0.974 0.978 0.972 0.596 IterativeClassifierOptimizer 97.96(16.5) 27.19 (26.5) 0.396 0.041 0.139 0.980 0.710 0.976 0.980 0.975 0.796 Tree LMT 98.01(6.5) 31.59 (13) 0.438 0.038 0.137 0.980 0.667 0.977 0.980 0.976 0.814 LADTree 97.96(16.5) 27.19 (26.5) 0.396 0.040 0.139 0.980 0.710 0.976 0.980 0.975 0.794 J48 97.97(12) 29.16 (16.5) 0.414 0.039 0.139 0.980 0.690 0.976 0.980 0.975 0.733 REPTree 98.01(6.5) 37.73 (6) 0.482 0.035 0.136 0.980 0.607 0.977 0.980 0.977 0.778 RandomTree 97.01(32) 46.18 (1) 0.424 0.030 0.172 0.970 0.525 0.972 0.970 0.971 0.730 HoeffdingTree 97.50(29) 28.15 (21) 0.352 0.042 0.158 0.975 0.701 0.970 0.975 0.971 0.660
The results of experiment 2 are summarized in Table 4, where BayesNet, IBk, IB1, and RandomizableFiltered classifiers performed poorly with higher misclassification rates. In contrast, DecisionTable, OneR, A2DE, Dagging, Decorate, END, FilteredClassifier, OrdinalClassClassifier, ClassificationViaRegression, LMT, LADTree, and J48 obtain almost
similar classification error rate approximately 2.1%. Bagging, RandomSubSpace, RotationForest, RandomCommittee, and REPTree achieve higher classification accuracy rates, which is 98.14%, 98.04%, 98.25%, 98.13%, and 98.07% respectively.
Table 4: Performance comparison of various classifier algorithms (2 classes, 16 attributes, (cross-validation (fold-10) observations).
Algorithm Class Algorithm Correctly Classified (%) Fraud Detection Rate (%) Kappa
Statistic MAE RMSE TP Rate FP Rate Precision Recall F-Measure ROC Area Rules DTNB-X1 97.63 (29) 36.96 (10) 0.441 0.075 0.168 0.976 0.614 0.972 0.976 0.974 0.760 DecisionTable 97.93 (12) 29.16 (20) 0.419 0.041 0.141 0.010 0.690 0.976 0.979 0.975 0.756 OneR 97.90 (15.5) 26.71 (26) 0.395 0.021 0.145 0.979 0.713 0.976 0.979 0.974 0.633 Bayes BayesNet 96.71 (36) 35.41 (11) 0.347 0.038 0.169 0.967 0.629 0.966 0.967 0.967 0.774 NaiveBayes 97.84 (23) 26.03 (31) 0.382 0.030 0.145 0.978 0.720 0.975 0.978 0.973 0.753 A2DE 97.90 (15.5) 35.34 (12) 0.463 0.036 0.139 0.979 0.630 0.975 0.979 0.976 0.836 Function SGD 97.74 (25.5) 19.06 (34.5) 0.302 0.023 0.150 0.977 0.788 0.974 0.977 0.970 0.595 Lazy IBk 96.90 (34) 42.27 (7) 0.404 0.031 0.176 0.969 0.562 0.969 0.969 0.969 0.715 IB1 96.88 (35) 42.57 (6) 0.404 0.031 0.177 0.969 0.559 0.969 0.969 0.969 0.705 KStar 97.45 (30) 48.30(2) 0.487 0.028 0.151 0.974 0.504 0.974 0.974 0.974 0.804 LWL 97.89 (19.5) 26.71 (26) 0.394 0.040 0.142 0.979 0.713 0.976 0.979 0.974 0.786 Meta AdaBoostM1 97.89 (19.5) 26.71 (26) 0.394 0.039 0.142 0.979 0.713 0.976 0.979 0.974 0.783 AttributeSelectedClassifier 97.75 (24) 23.21 (33) 0.346 0.043 0.146 0.978 0.748 0.973 0.978 0.972 0.665 Bagging 98.14 (2) 38.73 (9) 0.519 0.033 0.128 0.981 0.593 0.979 0.981 0.978 0.859 Dagging 97.90 (15.5) 26.71 (26) 0.394 0.0408 0.1427 0.979 0.713 0.976 0.979 0.974 0.625 Decorate 97.96 (7) 30.78 (16) 0.436 0.039 0.140 0.980 0.674 0.977 0.980 0.975 0.759 END 97.95 (9) 30.67 (18) 0.435 0.039 0.140 0.980 0.675 0.977 0.980 0.975 0.749 FilteredClassifier 97.91 (13) 28.37 (21) 0.411 0.040 0.141 0.979 0.697 0.976 0.979 0.974 0.741 LogitBoost 97.88 (22) 26.22 (30) 0.389 0.041 0.142 0.979 0.718 0.976 0.979 0.973 0.803 MultiBoostAB 97.89 (19.5) 26.71 (26) 0.394 0.021 0.145 0.979 0.713 0.976 0.979 0.974 0.765 MultiClassClassifier 97.71 (28) 17.78 (36) 0.285 0.043 0.146 0.977 0.800 0.974 0.977 0.970 0.787 OrdinalClassClassifier 97.95 (9) 30.67 (18) 0.435 0.039 0.140 0.980 0.675 0.977 0.980 0.975 0.749 RandomSubSpace 98.04 (5) 33.72 (13) 0.469 0.037 0.131 0.980 0.645 0.978 0.980 0.976 0.862 RotationForest 98.25 (1) 49.17(1) 0.589 0.0313 0.124 0.982 0.495 0.980 0.982 0.981 0.852 RandomCommittee 98.13 (3) 47.36(3) 0.565 0.030 0.133 0.981 0.513 0.979 0.981 0.979 0.807 ThresholdSelector 97.73 (27) 25.14 (32) 0.362 0.075 0.155 0.977 0.728 0.973 0.977 0.972 0.786 RandomizableFiltered 96.93 (33) 43.70(5) 0.414 0.031 0.174 0.969 0.548 0.97 0.969 0.969 0.725 ClassificationViaRegression 97.97 (6) 33.64 (14) 0.459 0.037 0.137 0.980 0.646 0.976 0.980 0.976 0.820 MultiClassClassifierUpdateable 97.74 (25.5) 19.06 (34.5) 0.302 0.022 0.1504 0.977 0.788 0.974 0.977 0.97 0.595 IterativeClassifierOptimizer 97.89 (19.5) 26.46 (29) 0.391 0.041 0.141 0.979 0.716 0.976 0.979 0.974 0.798 Tree LMT 97.94 (11) 31.42 (15) 0.439 0.038 0.138 0.979 0.668 0.976 0.979 0.975 0.818 LADTree 97.90 (15.5) 27.76 (22) 0.404 0.041 0.141 0.979 0.703 0.976 0.979 0.974 0.803 J48 97.95 (9) 30.67 (18) 0.435 0.039 0.140 0.980 0.675 0.977 0.980 0.975 0.749 REPTree 98.07 (4) 40.73 (8) 0.519 0.034 0.134 0.981 0.577 0.978 0.981 0.978 0.809 RandomTree 97.06 (32) 47.28(4) 0.445 0.030 0.171 0.971 0.514 0.971 0.971 0.971 0.736 HoeffdingTree 97.39 (31) 27.58 (23) 0.348 0.048 0.161 0.974 0.705 0.968 0.974 0.970 0.669
The algorithms are ranked according to their performances in two categories: (1) percentage of correctly classified, and (2) fraud detection rate. However, both experiments agreed that meta and tree algorithms perform well. With samples of this size, it is possible to obtain an accuracy of 96 - 99.25%. The best results in terms of classification accuracy achieved by Bagging, RandomSubSpace, RotationForest, RandomCommittee, LMT, and REPTree.
5. CONCLUSION
This study compares and analyzes the performance of various machine learning classifiers in detecting credit card fraud to ensure secure electronic transaction. The objective of this paper is to evaluate the effectiveness of the computational intelligence in detecting fraud by reviewing performance measurement. The most important parameters such as classification accuracy and fraud detection rate are considered in performance evaluation. Generally, in fraud detection, the cost of misclassification is quite vital. The classification of an anomaly as normal usually costs more than classification of a normal as anomaly. Based on collective experience in the field of data mining and the maturity of the techniques, 36 prominent classification algorithms were selected and applied. It is found that some meta and tree algorithms e.g., RotationForest,Bagging, RandomSubSpace, RandomCommittee, ClassificationViaRegression can deal with fraud transaction significantly whereas MultiClassClassifierUpdateable, ThresholdSelector, MultiClassClassifier, NaiveBayes cannot perform good enough. The key finding of this study is that only higher classification accuracy cannot give precise estimate of the misclassification because of fraud rate is too minimal; such examples are KStar, RandomCommittee, and RandomTree. Though, with credit type datasets small improvements in accuracy can save vast amounts of money so it is suggested that these classifiers have to be considered in credit card fraud detection system.
ACKNOWLEDGMENT
This study is supported by UCSD-FICO Data Mining Contest 2009 dataset. The authors would like to thank this contest authority for arranging this type of contest.
CONFLICT OF INTERESTS
The authors would like to confirm that there is no conflict of interests associated with this publication and there is no financial fund for this work that can affect the research outcomes.
REFERENCES
[1] Duman E, Sahin Y. A Comparison of Classification Models on Credit Card Fraud Detection with respect to Cost-Based Performance Metrics. NATO Science for Peace and Security Series E: Human and Societal Dynamics. IOS Press. 2011;88:88–99.
[2] Ngai EWT, Hu Y, Wong YH, Chen Y, Sun X. The application of data mining techniques in financial fraud detection: a classification framework and an academic review of literature. Decision Support Systems. 2011;50(3):559–569.
[3] Zareapoor M, Seeja KR, Alam AM. Analyzing credit card fraud detection techniques: based on certain design criteria. International Journal of Computer Application. 2012;52(3):35–42. [4] Carter C, Catlett J. Assessing credit card applications using machine learning. IEEE Expert:
[5] Hanagandi V, Dhar A, Buescher K. Density-based clustering and radial basis function modeling to generate credit card fraud scores. Computational Intelligence for Financial Engineering. 1996.
[6] Ghosh S, Reilly DL. Credit card fraud detection with a neural-network. In Proceedings of the 27th Hawaii International Conference on System Sciences. 1994;3:621–630.
[7] Dorronsoro JR, Ginel F, Sanchez C, Cruz CS. Neural fraud detection in credit card operations. In IEEE Transactions on Neural Networks. 1997;8:827-834.
[8] Brause R, Langsdorf T, Hepp M. Credit card fraud detection by adaptive neural data mining. Proceedings of the 11thIEEE International Conference on Tools with Artificial Intelligence. 1999. p. 103-106.
[9] S´anchez D, Vila MA, Cerda L, Serrano JM. Association rules applied to credit card fraud detection. Expert Systems with Applications. 2009;36(2):3630–3640.
[10] Pearl J. A Probabilistic Calculus of Actions, UAI'94 Proceedings of the Tenth International Conference on Uncertainty in Artificial Intelligence. San Mateo CA: Morgan Kaufman. 1994. p. 454–462.
[11] Breiman L. Random forests. Machine Learning. 2001;45(1):5–32.
[12] Hall M, Frank E. Combining Naive Bayes and Decision Tables. In Proceedings of the 21st Florida Artificial Intelligence Society Conference (FLAIRS). 2008. P. 318-319.
[13] Quinlan R. C4.5: Programs for Machine Learning. Morgan Kaufmann Publishers. San Mateo CA. 1993.
[14] Landwehr N, Hall M, Frank E. Logistic model trees. Machine Learning. 2005;59:161–205. [15] Aha, D, Kibler, D. Instance-based learning algorithms. Machine Learning. 1991. Vol.6. p.
37-66.
[16] Frank E, Hall M, Pfahringer B. Locally Weighted Naive Bayes. In: 19th Conference in Uncertainty in Artificial Intelligence. 2003. p. 249-256.
[17] Breiman L. Bagging predictors. Machine Learning. 1996;24(2):123-140.
[18] Frank E, Wang Y, Inglis S, Holmes G, Witten IH. Using model trees for classification. Machine Learning. 1998;32(1):63-76.
[19] Dong L, Frank E, Kramer S. Ensembles of balanced nested dichotomies for multi-class problems. Knowledge Discovery in Databases: Pkdd. 2005;3721:84–95.
[20] Freund Y, Schapire RE. Experiments with a new boosting algorithm. Machine Learning: Proceedings of the Thirteenth International Conference. 1996. p.148–156.