DOCUMENT DE TREBALL
XREAP2018-4
TRACKING ECONOMIC GROWTH BY
EVOLVING EXPECTATIONS VIA GENETIC
PROGRAMMING: A TWO-STEP APPROACH
Oscar Claveria (AQR, XREAP)
Enric Monte
1. Introduction
Evolutionary computation can be regarded as a subfield of artificial intelligence and soft computing centred around a family of algorithms for global optimization inspired by biological evolution, as they adopt principles of the theory of natural selection to problem solving (Fogel, 2006). These algorithms are known as evolutionary algorithms (EAs). Evolutionary computation is increasingly used in economic research (Acosta-González and Fernández-Rodríguez, 2014; Claveria et al. 2018a,b; Ramos-Herrera and Acosta-González, 2017).
There are different types of EAs. The most commonly used EA in optimization problems is the genetic algorithm (GA) developed by Holland (1975). A generalization of GAs that expresses the solution in the form of computer programs was proposed by Cramer (1985) and is known as genetic programming (GP). This more general representation scheme allows the model structure to vary during the evolution. Whereas GAs code potential solutions by means of fixed length binary string representations, GP uses tree-structured, variable length representations suitable for non-linear empricial modelling.
Empirical modelling is based on the development of mathematical models from experimental data, which implies finding both the structure and the parameters of the model simultaneously. Koza (1992) proposed a novel approach to empirical modelling based on symbolic regression (SR) via GP. This modelling technique is based on the specification of any regression model (linear regression, radial basis functions, support vector machines, kriging, etc.) and then searching the space of mathematical expressions that best fit a given dataset. This search process is usually characterised by a trade-off between accuracy and simplicity. Koza (1992) proposed using GP to find the best single computer program that solves a given SR problem. This approach is especially useful to find patterns in large data sets, where little or no information is known about the system. In this study we implement a SR via GP approach to find the relationship between a wide range of expectational variables and economic growth. We follow a two-step methodology proposed by Claveria et al. (2016b, 2017a) to derive mathematical functional forms that optimally combine survey variables to best fit the actual evolution of the economic activity in 28 countries of the OECD. We make use of survey expectations from the World Economic Survey (WES) carried out by the CESIfo Institute for Economic Research.
Expectations about the state of the economy are a key factor in economic modelling. Agents’ expectations are collected through tendency surveys. Business and consumer tendency surveys ask respondents whether they expect a variable to rise, to remain constant, or to fall. The relationship between quantitative data and agents’ expectations was first formalised by Anderson (1952) and Theil (1952), who regressed the actual average percentage change of an aggregate variable on the percentage of respondents expecting a variable to rise and to fall. The theoretical framework designed for the quantification of these percentages was initially based on the existence of an interval around zero within which respondents perceive that there are no significant changes in the variable. Thus, they answer that they expect a certain variable to go up (or down) to the extent that the mean of their subjective probability distribution lies beyond a threshold level, known as the limit of the indifference interval. Carlson and Parkin (1975) developed this approach by using a normal distribution, and by assuming unbiasedness over the sample period to estimate the difference limen. This approach was latter extended by Pesaran (1984, 1985), who allowed the model for an asymmetrical relationship between the actual average percentage change and the agents’ changes in periods of growth.
By matching individual responses with realisations, several authors have further explored this relationship at the micro level (Białowolski, 2016; Lui et al., 2011a, 2011b; Mitchell et al., 2002, 2005a, 2005b; Mokinski et al., 2015). Müller (2010) proposed a variant of the Carlson-Parkin method with asymmetric and time invariant thresholds. Breitung and Schmeling (2013) found that the introduction of asymmetric and time-varying thresholds was key in order to improve the forecast accuracy of quantified survey expectations, while the individual heterogeneity across forecasters played a minor role. Using household-level data from the University of Michigan, Lahiri and Zhao (2015) found strong evidence against the threshold constancy, symmetry, homogeneity, and overall unbiasedness assumptions of the Carlos-Parkin method.
Experimental expectations generated by Monte Carlo simulations have also been used to delve into the relationship between individual expectations and their quantitative equivalent. Common (1985) generated simulated expectations to test the rational expectations hypothesis. Simulation experiments have also been used to assess the forecasting performance of different quantification methods of survey expectations. By means of individual computer-generated expectations, Claveria (2010) compared the forecasting performance of the main quantification methods, while Löffler (1999) and Terai (2009) estimated the measurement error introduced by the Carlson-Parkin method.
The link between survey expectations and quantitative data at the aggregate level has been widely investigated (Abberger, 2007; Batchelor and Dua, 1998, 1992; Bergström, 1995; Berk, 1999; Bovi, 2013; Bruestle and Crain, 2015, Bruno, 2014; Claveria et al., 2007; Claveria et al., 2016a, 2017b; Dees and Brinca, 2013; Driver and Urga, 2004; Graff, 2010; Hansson et al., 2005; Jean-Baptiste, 2012; Kauppi et al., 1996; Leduc and Sill, 2013; Lee, 1994; Lehmann and Wohlrabe, 2017; Mittnik and Zadrozny, 2005; Nardo, 2003; Nolte and Pohlmeier, 2007; Pesaran and Weale, 2006; Qiao et al., 2009, Rahiala and Teräsvirta, 1993; Robinzonov et al., 2012; Smith and McAleer, 1995; Sorić et al., 2013; Vermeulen, 2014; Wilms et al., 2016). Since survey data are approximations of unobservable expectations, they inevitably entail a measurement error. As a result, in spite of the great body of research in this field, there is no consensus in the literature about the usefulness of the information content of survey expectations.
On the one hand, Klein and Özmucur (2010) analysed the role of survey expectations in 26 European countries, and found that they improved the forecasting performance of autoregressive time series models. In a similar sense, Schmeling and Schrimpf (2011) found that survey-based measures of expected inflation were significant predictors of future aggregate stock returns in France, Germany, Italy, the UK, the US and Japan, both in-sample and out-of-sample. Making use of survey expectations of 12 European countries, Ghonghadze and Lux (2012) obtained a superior out-of-sample forecasting performance with a canonical opinion dynamics model than with univariate time series models. Jonsson and Österholm (2012) analysed the inflation expectations formation process in Sweden using survey expectations, obtaining a poor forecasting performance that could be partly attributable to a mismeasurement of expectations. However, Österholm (2014) found that survey-based expectations improved the out-of-sample forecasting performance of GDP growth predictions in Sweden.
Martinsen et al. (2014) constructed factor models based on disaggregate survey data to forecast inflation, unemployment and GDP in Norway. The authors obtained the most accurate results for GDP growth. Girardi (2014) found that survey expectations contained relevant information about business cycle developments in the Euro Area (EA), especially around periods of extreme cyclical swings. Guizzardi and Stacchini (2015) showed that the inclusion of business survey indicators in time series models increased the forecasting accuracy of the baseline models. In a recent study, Altug and Çakmakli (2016) generated inflation forecasts by combining data on survey expectations with the inflation target set by central banks, finding the former to increase the predictive power of the models.
Although these studies use a wide range of econometric techniques, none of them assesses the relationship between both official quantitative data and qualitative survey expectations by means of evolutionary methods. In this research we design a SR experiment and use evolutionary computation to find the optimal combinations of survey expectations that best fit the actual evolution of year-on-year growth rates of GDP. In a recent study, Lahiri and Zhao (2015) found a significant improvement in agents’ expectations accuracy during periods of uncertainty. This finding has also led us to assess the impact of the 2008 financial crisis on agents’ ability to forecast the evolution of economic activity. Hence, we use the estimates of GDP in 28 OECD economies and compare them to a baseline model by means of the mean absolute scaled error (MASE) proposed by Hyndman and Koehler (2006).
The rest of the paper is organized as follows. The next section reviews the existing literature and describes the methodological approach and the experimental set up. In Section 3 we describe the data and present the empirical results. Finally, Section 4 provides some concluding remarks.
2. Methodology
GP is a soft computing search technique for problem-solving. GP’s tree-structured programs are evolved by means of genetic operators for model approximation. In this study we design a SR experiment in order to derive a set of functional forms that link survey expectations to economic growth. This data-driven regression approach assumes no a priori model. Using EAs that apply Darwinian principles that imitate aspects of biological evolution, such as the principle of survival and reproduction of the fittest, an initial population of computer programs are bred through generations to find a set of analytical functions that best fit the data.
Koza (1992) proposed using GP for implementing SR. In his seminal paper, Koza (1995) applied GP to assess the non-linear “exchange equation”, finding the empirical relationships between the price level, and gross national product, money supply, and the velocity of money. The versatility of this empirical modelling approach has attracted researchers from different areas (Álvarez-Díaz et al., 2009; Barmpalexis et al., 2011; Cai et al., 2006; Can and Heavey, 2011; Ceperic et al., 2014; Sarradj and Geyer, 2014; Wu et al., 2008; Yao and Lin, 2009).
Most of the applications of evolutionary computing to economics have been in finance (Goldberg, 1989). For a review of the applications of GAs for financial forecasting see Drake and Marks (2002). Acosta-González et al. (2012) used a GA to select the best econometric model for explaining the 2008 financial crisis, and found that the main determinant was the percentage of bank claims on private sector over deposits in the year 2006. By means of a computational search methodology based on GAs, Acosta-González and Fernández-Rodríguez (2014) selected the optimal financial ratios employed in a logit model to forecast bankruptcy in the Spanish building industry using annual public accounting information. Álvarez-Díaz and Álvarez (2005) used GP to forecast exchange rates of the yen and the pound to the US dollar. Based upon its performance in eight stock markets and eight foreign exchange markets during three consecutive test periods, Chen et al. (2008) thoroughly analysed the application of GP to financial trading, shedding some light on how GP performance could be connected to the trending and cyclical properties of financial data. Huang et al. (2015) presented a novel methodology for pairs trading using GAs.
Larkin and Ryan (2008) applied GP to nowcast stock prices using ordinal news sentiment data generated in real time by classifying financial news into positive, negative and neutral. The authors found that GP effectively predicted large intraday price jumps on the Standard & Poor 500 return index (S&P 500) up to an hour before they occurred without using current market prices information. Sheta et al. (2015) modelled the S&P 500 using multi-gene SR. Multi-gene SR is a special variation of the classic GP algorithms where each symbolic model is represented by a number of GP trees weighted by a linear combination. The method was used to evolve linear combinations of non-linear functions of 27 input variables, obtaining robust results when tracking the S&P 500 index in a weekly basis. Ramos-Herrera and Acosta-González (2017) evaluated the factors explaining exchange rate stability in 17 economies of the European Union (EU) making use of GAs. Among the higher impact factors, the authors found that variables measuring competiveness, including agents’ expectations, clearly stood out due to their repeated presence in the different models. Vasilakis et al. (2013) presented a GP-based technique to predict returns in the trading of the euro/dollar exchange rate based on historical data and assessed its forecasting performance relative to four different approaches, obtaining the highest trading performance with the proposed method. Wilson and Banzhaf (2009) compared a developmental co-evolutionary GP approach to standard linear GP for interday stock prices prediction.
Applications of evolutionary computation in economics are more recent and scarce. See Chen and Kuo (2002) for a classification of the literature on the application of evolutionary computation to economics and finance. By means of GAs, Acosta-González et al. (2014) selected the best econometric model for explaining the determinants of the size of the shadow economy using data from 38 economies. The authors found that the main determinants of the shadow economy were: taxes on capital gains of individuals, corporate taxes on income, profits and capital gains, domestic credit, bank secrecy, ethnic fractionalization, urban population, globalization, corruption and the socialist legal origin of country. Chen et al. (2010) introduced GP in a vector error correction model for macroeconomic forecasting. By means of SR via Pareto GP, Kotanchek et al. (2010) provided some insight into GDP forecasting. Duda and Szydło (2011) applied an improved version of GP known as gene expression programming (GEP) (Ferreria, 2011) to develop a set of economic forecasting models.
Kapetanios et al. (2016) assessed the forecasting performance of GAs and two other heuristic optimisation algorithms to forecast quarterly GDP growth and monthly inflation in the EA based on a large set of 195 monthly indicators. The authors found that variable selection based on heuristic optimisation outperformed variable reduction methods (principal components, partial least squares, and Bayesian shrinkage regression). See Milutinović et al. (2017) and Petković (2015) for alternative heuristic optimisation strategies. Klúčik (2012) used SR via GP in the estimation of total exports and imports to Slovakia. Krömer et al. (2013) presented an an application of GP to the evolution of fuzzy rules based on the concept of extended Boolean queries. In their approach, fuzzy rules are used as symbolic classifiers learned from data and used to label data records and to predict the value of an output variable. The authors used GP to find fuzzy rules labelling faulty products in a steel processing plant. Kronberger et al. (2011) made use of SR to identify variable interactions between 33 economic indicators in order to estimate the evolution of prices in the US. In a recent study, Marković et al. (2017) assessed the role of ten science and technology factors as inputs for GDP growth prediction in 28 EU countries. The authors compared the predictive accuracy of GP and other soft computing methods to that of extreme learning machines (ELMs) (Huang et al., 2006), and obtained the highest accuracy with ELMs were initially proposed as learning algorithms for single-hidden layer feedforward neural networks characterised by fast training time. Yang et al. (2015) applied a data-driven approach based on SR to predict oil production in the US, using data from the 48 lower states since 1859.
Among recent developments in evolutionary computation, Zelinka (2005) introduced analytical programming, and showed its ability to synthesize suitable solutions (programs) in SR. Maschek (2010) developed a two-level learning (or self-adaptation) mechanism and evaluated how it affected an economic application of GAs. Vladislavleva et al. (2010) evaluated different ways of improving SR by incorporating weights into the fitness function. Waltman et al. (2011) examined to what extent the use of binary encoding strategies influence the results produced by GAs. Peng et al. (2014) proposed an improved GEP algorithm especially suitable for dealing with SR problems. Gandomi and Roke (2015) compared the forecasting performance of ANN models to that of GEP techniques. See Dabhi and Chaudhary (2015) and Poli et al. (2010) for a review of the main issues related to GP.
GP allows to find patterns in large data sets. This feature is particularly indicated when little or no information is known about the system. While in evolutionary programming (Fogel, 1966) the structure of the program to be evolved remains fixed, GP simultaneously evolves the structure and the parameters of the models. In this study we use GP to formalise the interactions between a set of indicators of survey expectations that best fit the evolution of economic activity. As there is an arbitrary functional relationship between this set of survey variables (Table 1), we link all of them to the actual percentage growth rate of GDP by means of a SR model:
it it it it it it it it it it it it
it f x x x x x x x x x x x x
y 1 , 2 , 3 , 4 , 5 , 6 , 7 , 8 , 9 , 10 , 11, 12 (1)
where x1it,,x12it are the different survey variables, and yit is a scalar referring to the
year-on-year growth rate of quarterly GDP for country i at time t. We divide the set of survey variables into three types: judgements about the present economic situation
x1it,x2it,x3it, perceptions about the present economic situation compared to last year x4it,x5it,x6it, and expectations for the next six months about the economic situation x7it,x8it,x9it and the foreign trade volume x10it,x11it,x12it. See Table 1.
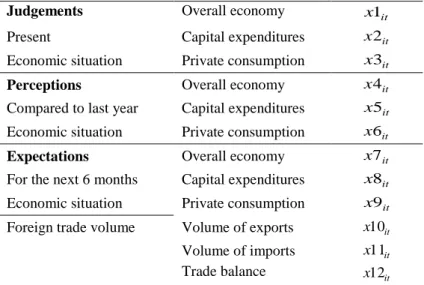
Table 1. Explanatory variables (WES expectational indicators)
Judgements Overall economy x1it
Present Capital expenditures x2it
Economic situation Private consumption x3it
Perceptions Overall economy x4it Compared to last year Capital expenditures x5it Economic situation Private consumption x6it
Expectations Overall economy x7it For the next 6 months Capital expenditures x8it Economic situation Private consumption x9it Foreign trade volume Volume of exports x10it Volume of imports x11it Trade balance x12it
By means of GP we evolve the resulting symbolic mathematical expressions until a stopping criterion is reached, be it a predetermined value of the fitness function or a given number of generations. We want to note that there is a trade-off between fitness and complexity. To deal with the growth in the complexity of the SR function we introduce a term that penalizes the functions that exceed a given number of terms. In this study we have chosen a maximum number of 150 generations as as stopping criterion. In Table 2 we summarize the steps for implementing GP.
Table 2. GP implementation – Steps
1. Creation of an initial population of programs 1,000
2. Evaluation of fitness for each program Root mean square error (RMSE) 3. Selection of a reproduction strategy Tournament method (size 3) 4. Application of genetic operators Mutation probability 0.1 5. Determination of constants Automatically generated 6. Creation of a new population Max. generations 150
(1) Creation of an initial population of programs – First, in order to start the process we create an initial population of 1000 programs.
(2) Evaluation of fitness for each program – An error metric is calculated for each member of the population. We use the Root Mean Square Error (RMSE) as a fitness function.
(3) Selection of a reproduction strategy – From the existing strategies for the selection of parents for replacement, which are the programs used to create offspring programs, we
use the tournament method so as to guarantee diversity in the population. This method is based on the selection of the fittest individual in each tournament among a group of individuals chosen at random from the population. One of the main advantages over other alternative methods is that the selection pressure can be easily adjusted and it is code-efficient.
(4) Application of genetic operators – Genetic operators (crossover and mutation) are applied to the parents selected on the basis of the fitness function. Crossover consists on the recombination of randomly chosen parts of parents, while mutation on randomly altering a part of a parent.
(5) Determination of constants – We include the automatic generation of constants provided by the GA. This set of constants is optimised after a number of generations to avoid the search path to deviate from the optimum.
(6) Creation of a new population – Generation after generation, the fitness of the population increases, as steps three and four are repeated until the creation of a new population when a required minimal fitness is achieved. In this experiment we have chosen a maximum number of 150 generations as a stopping criterion.
The output of this process is a set with the best individual functions from all generations. In this study we have used the open source Distributed Evolutionary Algorithms Package (DEAP) framework implemented in Python (Fortin et al. 2012; Gong et al. 2015).
3. Results
In this section we present the results of the experiment. The SR has been estimated using survey data from the CESIfo WES for 28 countries of the OECD, and GDP data retrieved from the OECD web (https://data.oecd.org/gdp/quarterly-gdp.htm#indicator-chart). The sample period goes from the second quarter of 2000 to the first quarter of 2014. The WES is carried out by the CESIfo Institute for Economic Research. The questionnaire asks respondents whether they expect their country’s general economic situation to get better, worse, or to remain unchanged.
Qualitative responses are transformed by means of a grading procedure consisting in giving a rank of 9 to positive replies, of 5 to indifferent replies, and of 1 to negative replies (CESifo World Economic Survey, 2011). Survey results are published as aggregated data
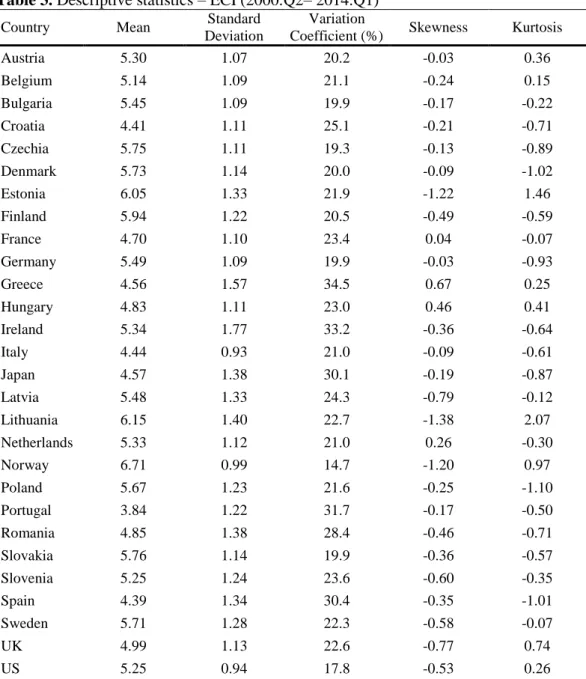
by country, weighting the results according to the country’s share of trade worldwide. See Henzel and Wollmershäuser (2005), Stangl (2007, 2008), and Hutson et al. (2014) for a detailed analysis of WES data. The Ifo makes use of these data to construct the Economic Climate Index (ECI). The ECI is an aggregate indicator obtained as the arithmetic mean of assessments of the general economic situation and the expectations for the economic situation in the next six months. The trend in the ECI tends to correlate closely with the actual business-cycle trend measured in annual growth rates of real GDP (Garnitz et al., 2015). In Table 3 we present a descriptive analysis of the ECI for the 28 economies analysed in this study.
Table 3. Descriptive statistics – ECI (2000:Q2– 2014:Q1)
Country Mean Standard
Deviation
Variation
Coefficient (%) Skewness Kurtosis
Austria 5.30 1.07 20.2 -0.03 0.36 Belgium 5.14 1.09 21.1 -0.24 0.15 Bulgaria 5.45 1.09 19.9 -0.17 -0.22 Croatia 4.41 1.11 25.1 -0.21 -0.71 Czechia 5.75 1.11 19.3 -0.13 -0.89 Denmark 5.73 1.14 20.0 -0.09 -1.02 Estonia 6.05 1.33 21.9 -1.22 1.46 Finland 5.94 1.22 20.5 -0.49 -0.59 France 4.70 1.10 23.4 0.04 -0.07 Germany 5.49 1.09 19.9 -0.03 -0.93 Greece 4.56 1.57 34.5 0.67 0.25 Hungary 4.83 1.11 23.0 0.46 0.41 Ireland 5.34 1.77 33.2 -0.36 -0.64 Italy 4.44 0.93 21.0 -0.09 -0.61 Japan 4.57 1.38 30.1 -0.19 -0.87 Latvia 5.48 1.33 24.3 -0.79 -0.12 Lithuania 6.15 1.40 22.7 -1.38 2.07 Netherlands 5.33 1.12 21.0 0.26 -0.30 Norway 6.71 0.99 14.7 -1.20 0.97 Poland 5.67 1.23 21.6 -0.25 -1.10 Portugal 3.84 1.22 31.7 -0.17 -0.50 Romania 4.85 1.38 28.4 -0.46 -0.71 Slovakia 5.76 1.14 19.9 -0.36 -0.57 Slovenia 5.25 1.24 23.6 -0.60 -0.35 Spain 4.39 1.34 30.4 -0.35 -1.01 Sweden 5.71 1.28 22.3 -0.58 -0.07 UK 4.99 1.13 22.6 -0.77 0.74 US 5.25 0.94 17.8 -0.53 0.26
After 150 generations, and using as a selection criterion the capacity of the elements of the population to track the dependent variables (year-on-year growth rates of quarterly GDP for each country), we have selected the top 20 functions returned by the GP algorithm (Table 4).
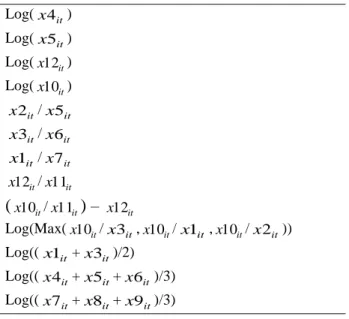
Table 4. SR-generated indicators (building blocks)
Log(x4 ) it Log(x5 ) it Log(x12 ) it Log(x10 ) it it x2 /x5 it it x3 /x6 it it x1 /x7 it it x12 /x11 it (x10 /it x11it) – x12 it Log(Max(x10 /it x3 ,it x10 /it x1 ,it x10 /it x2 )) it Log((x1 +it x3 )/2) it Log((x4 +it x5 +it x6 )/3) it Log((x7 +it x8 +it x9 )/3) it
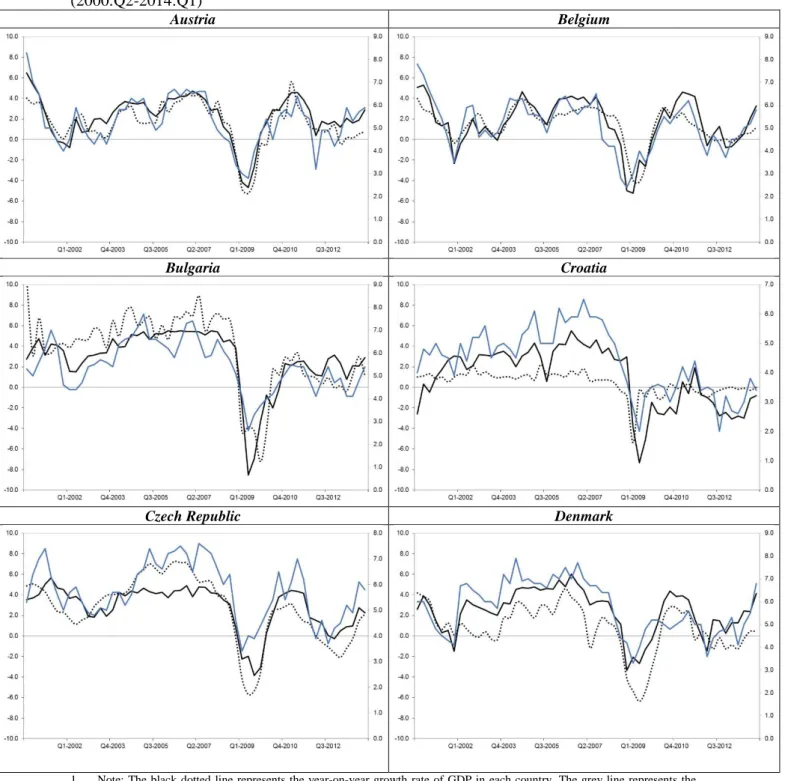
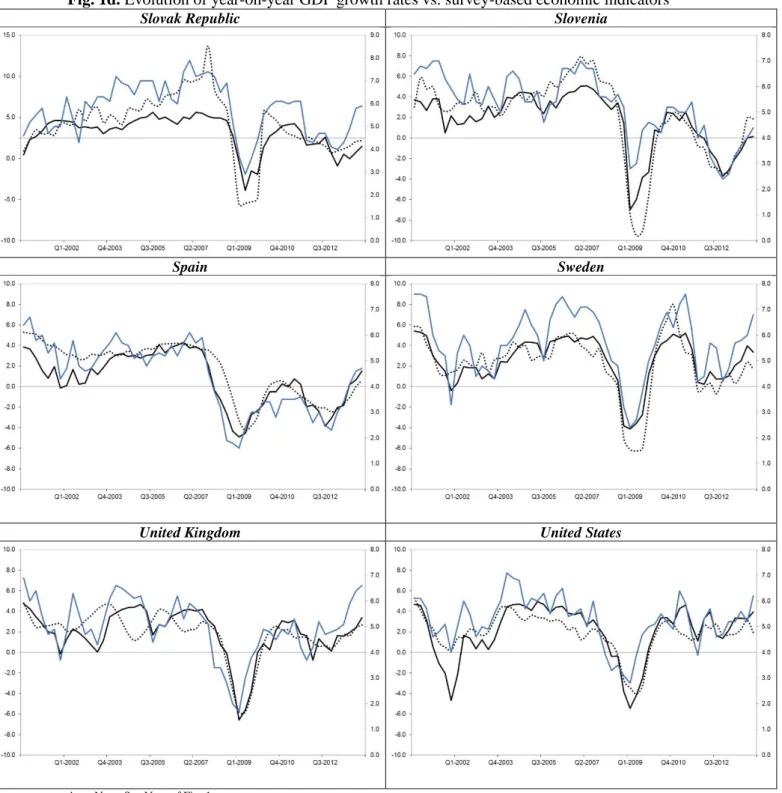
The GP-generated functions in Table 4 can be regarded as building blocks, which are then introduced as regressors of GDP growth so as to obtain the coefficients used to generate the optimal linear combination to estimate the evolution of economic growth. In order to assess the accuracy of the forecasts of GDP, we first compare the evolution of the obtained estimations of economic growth to that of the ECI. Fig. 1 compares the evolution of the GR-based estimates to that of the year-on-year growth rates of GDP and the ECI. We can observe that the estimates seem to correlate closely with the actual oscillations of GDP. In most economies agents’ expectations seem to advance turning points, especially regarding the 2008 financial crisis. The severity of the crisis varies across countries, being Estonia, Latvia, and Lithuania the economies showing the highest percentages of decrease in the activity. At the opposite end, Norway and Poland show the lowest decline in terms of GDP growth, being the countries in which the GR-generated forecasts from agents’ expectations more clearly overestimate the extent of the crisis.
Fig. 1a. Evolution of year-on-year GDP growth rates vs. survey-based economic indicators (2000:Q2-2014:Q1)
Austria Belgium
Bulgaria Croatia
Czech Republic Denmark
1. Note: The black dotted line represents the year-on-year growth rate of GDP in each country. The grey line represents the evolution of the scaled ECI (secondary axis). The black line represents the evolution of the proposed indicator.
Fig. 1b. Evolution of year-on-year GDP growth rates vs. survey-based economic indicators
Estonia Finland
France Germany
Greece Hungary
Ireland Italy
Fig. 1c. Evolution of year-on-year GDP growth rates vs. survey-based economic indicators
Japan Latvia
Lithuania Netherlands
Norway Poland
Portugal Romania
Fig. 1d. Evolution of year-on-year GDP growth rates vs. survey-based economic indicators
Slovak Republic Slovenia
Spain Sweden
United Kingdom United States
4. Note: See Note of Fig. 1a..
After the graphical analysis, we evaluate the in-sample forecasting performance of the quantified expectations by comparing them to a benchmark model in order to compute the MASE. This measure of forecast accuracy was developed by Hyndman and Koehler (2006), who proposed scaling the forecast errors by the in-sample mean absolute error
(MAE) obtained with a random walk. As official data are published with a delay of more than a quarter with respect to survey data, we use two-step ahead naïve forecasts as a baseline. The MASE statistic presents several advantages over other forecast accuracy measures. First, it is independent of the scale of the data. Second, it does not suffer from some of the problems presented by other relative measures of forecast accuracy such as the relative MAE. Finally, it is easy to interpret: values larger than one are indicative that the GP-based forecasts are worse than the average prediction computed in-sample with the baseline model.
If we denote the forecast error obtained by means of GP as et YtYˆt, the scale error is defined as: n i i i t t Y Y n e q 3 2 1 1 (2)
Hence, the MASE is obtained as the mean of qt, MASEmean
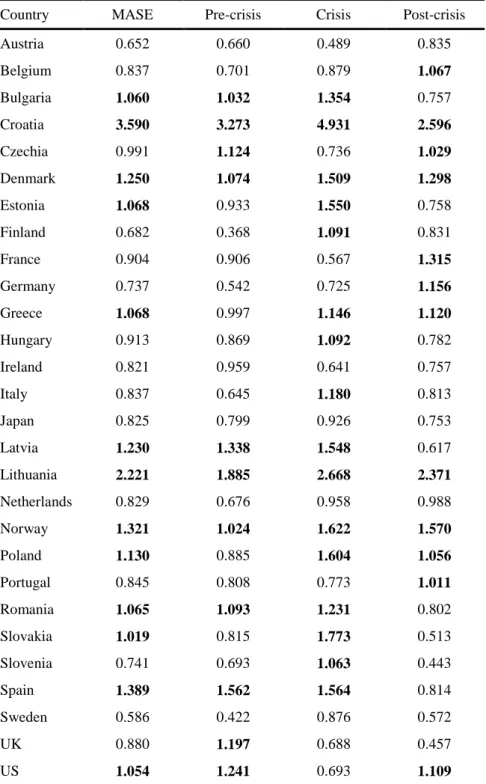
qt .With the aim of assessing the potential influence of the 2008 financial crisis on the forecasting accuracy of GP-generated estimates of GDP, we re-compute the MASE differentiating between the pre-crisis subperiod (2000-2007), the crisis (2007-2010), and the post-crisis subperiod (Table 5).
The results in Table 5 show that the most remarkable improvement of the survey-based estimates relative to the benchmark model are obtained in Sweden, Austria, and Finland, as opposed to Croatia and Lithuania. When splitting the results in sub-periods, we find that the accuracy of the estimates of GDP significantly worsens during the crisis in most countries, with the exception of Austria, Czechia, France, Ireland, Portugal, the UK and the US. When comparing the accuracy of agents’ expectations between the post-crisis and the pre-post-crisis years, we obtain mixed results. This mixed evidence is in line with previous research. While Lahiri and Zhao (2015) found a significant improvement in agents’ expectations accuracy during periods of uncertainty and Łyziak and Mackiewicz-Łyziak (2014) showed that the 2008 financial crisis period led to a decrease in expectational errors in transition economies, Erjavec et al. (2015) found that consumers' expectational bias regarding inflation in Croatia diminished in times of lower price volatility.
Table 5. Forecast accuracy by country (in-sample)
Country MASE Pre-crisis Crisis Post-crisis
Austria 0.652 0.660 0.489 0.835 Belgium 0.837 0.701 0.879 1.067 Bulgaria 1.060 1.032 1.354 0.757 Croatia 3.590 3.273 4.931 2.596 Czechia 0.991 1.124 0.736 1.029 Denmark 1.250 1.074 1.509 1.298 Estonia 1.068 0.933 1.550 0.758 Finland 0.682 0.368 1.091 0.831 France 0.904 0.906 0.567 1.315 Germany 0.737 0.542 0.725 1.156 Greece 1.068 0.997 1.146 1.120 Hungary 0.913 0.869 1.092 0.782 Ireland 0.821 0.959 0.641 0.757 Italy 0.837 0.645 1.180 0.813 Japan 0.825 0.799 0.926 0.753 Latvia 1.230 1.338 1.548 0.617 Lithuania 2.221 1.885 2.668 2.371 Netherlands 0.829 0.676 0.958 0.988 Norway 1.321 1.024 1.622 1.570 Poland 1.130 0.885 1.604 1.056 Portugal 0.845 0.808 0.773 1.011 Romania 1.065 1.093 1.231 0.802 Slovakia 1.019 0.815 1.773 0.513 Slovenia 0.741 0.693 1.063 0.443 Spain 1.389 1.562 1.564 0.814 Sweden 0.586 0.422 0.876 0.572 UK 0.880 1.197 0.688 0.457 US 1.054 1.241 0.693 1.109
Notes: * MASE stands for the Mean Absolute Scaled Error. In this study we propose scaling the errors by the in-sample MAE obtained with the Naïve method for two-step ahead forecasts (as official data are published with a delay of more than a quarter with respect to survey data). Values larger than one (in bold) indicate worse predictions than the average forecast computed in-sample with the Naïve method.
4. Concluding remarks and future work
Evolutionary computation is increasingly being used for economic applications. In this study we implement GP to find the most fitted mathematical functional forms linking survey expectations to economic growth. By linearly combining the output of this GP-generated set of models, we estimate the evolution of GDP in 28 OECD economies. The proposed approach demonstrates the potential of survey expectations for economic forecasting and circumvents the issue of quantifying qualitative expectations on the direction of change. Thus, this data-driven method for modelling survey-based agents’ expectations avoids making assumptions about the subjective probability distribution of respondents.
SR via GP allows selecting the fittest models of interaction between agents' expectations and the official quantitative series they refer to. As a result, the evolution of the GP-generated forecasts correlates closely with the actual oscillations of the economic activity and with other official economic indicators such as the ECI. This result suggests that this empirical approach to model survey expectations on the direction of change may provide gains in forecast accuracy.
We have also analysed the impact of the 2008 financial crisis on the accuracy of agents’ expectations by assessing the capacity of GP-generated estimates of GDP to anticipate future economic growth. We have found that the crisis period has led to a deterioration in the forecasting performance of agents’ expectations in most economies.
Despite the versatility of the proposed GP approach for modelling survey-based expectations to estimate economic growth, some aspects have been left for further research. We have not evaluated to what extent the forecasting performance of GP predictions could have been improved by increasing the maximum number of generations. There is also the question of whether the implementation of improved adaptive algorithms, such as Ferreira’s gene expression programming or Zelinka’s analytical programming, may improve the forecasting performance of computationally generated economic forecasts. Finally, another issue left for future research is the use of GP-based expectations to assess empirically observed economic relationships such as the Phillips curve, or to test the rational expectations hypothesis.
References
Abberger, K. (2007). Qualitative business surveys and the assessment of employment — A case study for Germany. International Journal of Forecasting, 23(2), 249–258.
Altug, S., & Çakmakli, C. (2016). Forecasting inflation using survey expectations and target inflation: Evidence from Brazil and Turkey. International Journal of Forecasting, 32(1), 138–153.
Acosta-González, E., & Fernández-Rodríguez, F. (2014). Forecasting financial failure of firms via genetic algorithms. Computational Economics, 43(2), 133–147.
Acosta-González, E., Fernández-Rodríguez, F., & Sosvilla-Rivero, S. (2012). On factors explaining the 2008 financial crisis. Economics Letters, 115(2), 215–217.
Acosta-González, E., Fernández-Rodríguez, F., & Sosvilla-Rivero, S. (2014). An empirical examination of the determinants of the shadow economy. Applied Economics Letters, 21(5), 304–307.
Álvarez-Díaz, M., & Álvarez, A. (2005). Genetic multi-model composite forecast for non-linear prediction of exchange rates. Empirical Economics, 30(3), 643–663.
Álvarez-Díaz, M., Mateu-Sbert, J., & Rosselló-Nadal, J. (2009). Forecasting tourist arrivals to Balearic Islands using genetic programming. International Journal of Computational
Economics and Econometrics, 1(1), 64–75.
Anderson, O. (1952). The Business Test of the IFO-Institute for Economic Research, Munich, and its theoretical model. Revue de l’Institut International de Statistique, 20, 1–17. Barmpalexis, P., Kachrimanis, K., Tsakonas, A., & Georgarakis, E. (2011). Symbolic regression
via genetic programming in the optimization of a controlled release pharmaceutical formulation. Chemometrics and Intelligent Laboratory Systems, 107(1), 75–82.
Batchelor, R., & Dua, P. (1992). Survey expectations in the time series consumption function.
The Review of Economics and Statistics, 74(4), 598–606.
Batchelor, R., & Dua, P. (1998). Improving macro-economic forecasts. International Journal of Forecasting, 14(1), 71–81.
Bergström, R. (1995). The relationship between manufacturing production and different
business survey series in Sweden 1968-1992. International Journal of Forecasting, 11(3), 379–393.
Berk, J. M. (1999). Measuring inflation expectations: A survey data approach. Applied Economics, 31(11), 1467–1480.
Białowolski, P. (2016). The influence of negative response style on survey-based household inflation expectations. Quality & Quantity, 50(2), 509–528.
Bovi, M. (2013). Are the representative agent’s beliefs based on efficient econometric models?
Journal of Economic Dynamics & Control, 37(3), 633–648.
Breitung, J., & Schmeling, M. (2013). Quantifying survey expectations: What’s wrong with the probability approach? International Journal of Forecasting, 29(1), 142–154.
Bruestle, P., & Crain, W. M. (2015). A mean-variance approach to forecasting with the consumer confidence index. Applied Economics, 47(23), 2430–2444.
Bruno, P. (2014). Consumer confidence and consumption forecast: A non-parametric approach.
Empirica, 41(1), 37–52.
Cai, W., Pacheco-Vega, A., Sen, M., & Yang, K. T. (2006). Heat transfer correlations by symbolic regression. International Journal of Heat and Mass Transfer, 49(23-24), 4352– 4359.
Can, B., and C. Heavey. 2011. “Comparison of Experimental Designs for Simulation-based Symbolic Regression of Manufacturing Systems.” Computers & Industrial Engineering 61, no. 3: 447–462.
Ceperic, V., Bako, N., & Baric, A. (2014). A symbolic regression-based modelling strategy of AC/DC rectifiers for RFID applications. Expert Systems with Applications, 41(16), 7061– 7067.
CESifo World Economic Survey (2011). Vol. 10(2), May 2011.
Chen, X., Pang, Y., & Zheng, G. (2010). Macroeconomic forecasting using GP based vector error correction model. In J. Wang (Ed.), Business Intelligence in Economic Forecasting: Technologies and Techniques (pp. 1–15). Hershey, PA: IGI Global.
Chen, S. H., & Kuo, T. W. (2002). Evolutionary computation in economics and finance: A bibliography. In S. H. Chen (Ed.), Evolutionary Computation in Economics and Finance
(pp. 419–455). Heidelberg: Physica-Verlag.
Chen, S. H., Kuo, T. W., & Hoi, K. M. (2008). Genetic programming and financial trading: How much about “what we know”. In C. Zopounidis et al. (Eds.), Handbook of financial engineering (pp. 99–154). New York: Springer.
Claveria, O. (2010). Qualitative survey data on expectations. Is there an alternative to the balance statistic? In A. T. Molnar (Ed.), Economic Forecasting (pp.181–190). Hauppauge, NY: Nova Science Publishers.
Claveria, O., Pons, E., & Ramos, R. (2007). Business and consumer expectations and macroeconomic forecasts. International Journal of Forecasting, 23(1), 47–69.
Claveria, O., Monte, E., & Torra, S. (2016a). A self-organizing map analysis of survey-based agents’ expectations before impending shocks for model selection: The case of the 2008 financial crisis. International Economics, 146, 40–58.
Claveria, O., Monte, E., & Torra, S. (2016b). Quantification of survey expectations by means of symbolic regression via genetic programming to estimate economic growth in Central and Eastern European economies. Eastern European Economics, 54(2), 171–189.
Claveria, O., Monte, E., & Torra, S. (2017a). Assessment of the effect of the financial crisis on agents’ expectations through symbolic regression. Applied Economics Letters, 24 (9), 648–652.
Claveria, O., Monte, E., and Torra, S. (2017b). A new approach for the quantification of qualitative measures of economic expectations. Quality & Quantity, 51 (6), 2685–2706. Claveria, O., Monte, E., and Torra, S. (2017c). Using survey data to forecast real activity with evolutionary algorithms. A cross-country analysis. Journal of Applied Economics, 20 (2), 329–349.
Claveria, O., Monte, E., and Torra, S. (2018a). Evolutionary computation for macroeconomic forecasting. Computational Economics, In Press.
Claveria, O., Monte, E., and Torra, S. (2018b). A data-driven approach to construct survey-based indicators by means of evolutionary algorithms. Social Indicators Research, 135 (1), 1–14.
Common, M. (1985). Testing for rational expectations with qualitative survey data. Manchester School of Economic and Social Statistics, 53(2), 138–148.
Cramer, N. (1985). A representation for the adaptive generation of simple sequential programs.
Proceedings of the International Conference on Genetic Algorithms and their Applications, 24-26 June. Pittsburgh, PA.
Dabhi, V. K., & Chaudhary, S. (2015). Empirical modeling using genetic programming: A survey of issues and approaches. Natural Computing, 14(2), 303–330.
Dees, S., & Brinca, P. S. (2013). Consumer confidence as a predictor of consumption spending: Evidence for the United States and the Euro area. International Economics, 134, 1–14. Drake, A. E., & Marks, R. E. (2008). Genetic algorithms in economics and finance: Forecasting
stock market prices and foreign exchange –A review. In S. H. Chen (Ed.), Genetic Algorithms and Genetic Programming in Computational Finance (pp. 29–54). New York: Springer.
Driver, C., & Urga, G. (2004). Transforming qualitative survey data: Performance comparisons for the UK. Oxford Bulletin of Economics and Statistics, 66(1), 71–89.
Duda, J., & Szydło, S. (2011). Collective intelligence of genetic programming for macroeconomic forecasting. In P. Jędrzejowicz et al. (Eds.), Computational Collective Intelligence. Technologies and Applications (pp. 445–454). Berlin: Springer.
Erjavec, N., Lolić, I., & Sorić, P. (2015). How (i)rrational are we? A case of Croatian inflation.
Ferreira, C. (2001). Gene expression programming: A new adaptive algorithm for solving problems. Complex Systems, 13(2), 87–129.
Fogel, D. B. (2006). Evolutionary computation. Toward a new philosophy of machine intelligence (Third Edition). Hoboken, NJ: John Wiley & Sons.
Fogel, L. J., Owens, A. J., & Walsh, M. J. (1966). Artificial intelligence through simulated evolution. New York: John Wiley.
Fortin, F. A., De Rainville, F. M., Gardner, M. A., Parizeau, M., & Gagné, C. (2012). DEAP: Evolutionary algorithms made easy. Journal of Machine Learning Research, 13(1), 2171– 2175.
Gandomi, A. H., & Roke, D. A. (2015). Assessment of artificial neural network and genetic programming as predictive tools. Advances in Engineering Software, 88(C), 63–72. Garnitz, J., Nerb, G., & Wohlrabe, K. (2015). CESifo World Economic Survey – November
2015. CESifo World Economic Survey, 14(4), 1–28.
Ghonghadze, J., & Lux, T. (2012). Modelling the dynamics of EU economic sentiment indicators: An interaction-based approach. Applied Economics, 44(24), 3065–3088. Girardi, A. (2014). Expectations and macroeconomic fluctuations in the euro area. Economics
Letters, 125(2), 315–318.
Goldberg, D. E. (1989). Genetic algorithms in search, optimization, and machine learning. Reading Boston, MA: Addison-Wesley.
Gong, Y. J., Chen, W. N., Zhan, Z. H., Zhang, J., Li, Y., Zhang, Q., & Li, J. J. (2015). Distributed evolutionary algorithms and their models: A survey of the stat-of-the-art.
Applied Soft Computing, 34, 286–300.
Graff, M. (2010). Does a multi-sectoral design improve indicator-based forecasts of the GDP growth rate? Evidence from Switzerland. Applied Economics, 42(21), 2759–2781. Guizzardi, A., & Stacchini, A. (2015). Real-time forecasting regional tourism with business
sentiment surveys. Tourism Management, 47, 213–223.
Hansson, J., Jansson, P., & Löf, M. (2005). Business survey data: Do they help in forecasting GDP growth?. International Journal of Forecasting, 30(1), 65–77.
Henzel, S., & Wollmershäuser, T. (2005). An alternative to the Carlson-Parkin method for the quantification of qualitative inflation expectations: Evidence from the Ifo World
Economic Survey. Journal of Business Cycle Measurement and Analysis, 2(3), 321–352. Holland, J. H. (1975). Adaptation in natural and artificial systems. Ann Arbor, MI: University
of Michigan Press.
Huang, C. F., Hsu, C. J., Chen, C. C., Chang, B. R., & Li, C.-A. (2015). An intelligent model for pairs trading using genetic algorithms. Computational Intelligence and Neuroscience, 2015, 1–10.
Huang, G.-B., Zhu, Q.-Y., & Siew, C.-K. (2006). Extreme learning machine: Theory and applications. Neurocomputing, 70(1–3), 489–501.
Hutson, M., Joutz, F., & Stekler, H. (2014). Interpreting and evaluating CESIfo’s World Economic Survey directional forecasts. Economic Modelling, 38, 6–11.
Hyndman, R. J., & Koehler, A. B. (2006). Another look at measures of forecast accuracy.
International Journal of Forecasting, 22(4), 679–688.
Jean-Baptiste, F. (2012). Forecasting with the new Keynesian Phillips curve: Evidence from survey data. Economics Letters , 117(3) 811–813.
Jonsson, T., & Österholm, P. (2012). The properties of survey-based inflation expectations in Sweden. Empirical Economics, 42(1), 79–94.
Kaboudan, M. A. (2000). Genetic programing prediction of stock prices. Computational Economics, 16(3), 207–236.
Kapetanios, G., Marcellino, M., & Papailias, F. (2016). Forecasting inflation and GDP growth using heuristic optimisation of information criteria and variable reduction methods.
Computational Statistics and Data Analysis, 100, 369–382.
Kauppi, E., Lassila, J., & Teräsvirta, T. (1996). Short-term forecasting of industrial production with business survey data: Experience from Finland’s great depression 1990-1993.
Klein L. R., & Özmucur, S. (2010). The use of consumer and business surveys in forecasting.
Economic Modelling, 27(6), 1453–1462.
Kľúčik, M. (2012). Estimates of foreign trade using genetic programming. Proceedings of the 46 the scientific meeting of the Italian Statistical Society.
Kotanchek, M. E, Vladislavleva, E. Y., & Smits, G. F. (2010). Symbolic regression via genetic programming as a discovery engine: Insights on outliers and prototypes. In R. Riolo et al., (Eds.), Genetic Programming Theory and Practice VII, Genetic and Evolutionary
Computation Vol. 8 (pp. 55–72). Springer Science+Business Media, LLC.
Koza, J. R. (1992). Genetic programming: On the programming of computers by means of natural selection. Cambridge, MA: MIT Press.
Koza, J. R. (1995). Genetic Programming for econometric modeling. In S. Goonatilaje and P. Treleaven (Eds.), Intelligent Systems for Finance and Business (pp. 251–269). London: John Wiley and Sons.
Krömer, P., Owais, S., Platoš, J., & Snášel, V. (2013). Towards new directions of data mining by evolutionary fuzzy rules and symbolic regression. Computers and Mathematics with Applications, 66(2), 190–200.
Kronberger, G., Fink, S., Kommenda, M., & Affenzeller, M. (2011). Macro-economic time series modeling and interaction networks. In C. Di Chio et al. (Eds.), EvoApplications, Part II (pp. 101–110). LNCS 6625.
Lahiri, K., & Zhao, Y. (2015). Quantifying survey expectations: A critical review and
generalization of the Carlson-Parkin method. International Journal of Forecasting, 31(1), 51–62.
Larkin, F., & Ryan, C. (2008). Good news: Using news feeds with genetic programming to predict stock prices. In M. O’Neil et al. (Eds.), Genetic Programming (pp. 49–60). Berlin: Springer-Verlag.
Leduc, S., & Sill, K. (2013). Expectations and economic fluctuations: An analysis using survey data. The Review of Economic and Statistics, 95(4), 1352–1367.
Lee, K. C. (1994). Formation of price and cost inflation expectations in British manufacturing industries: A multi-sectoral analysis. Economic Journal, 104(423), 372–385.
Lehmann, R., & Wohlrabe, K. (2017). Experts, firms, consumers or even hard data? Forecasting employment in Germany. Applied Economics Letters, 24(4), 279–283.
Löffler, G. (1999). Refining the Carlson-Parkin method. Economics Letters, 64(2), 167–71. Lui, S., Mitchell, J., & Weale, M. (2011a). The utility of expectational data: firm-level evidence
using matched qualitative-quantitative UK surveys. International Journal of Forecasting, 27(4), 1128–1146.
Lui, S., Mitchell, J., & Weale, M. (2011b). Qualitative business surveys: signal or noise?.
Journal of The Royal Statistical Society, Series A (Statistics in Society), 174(2), 327–348. Łyziak, T., & Mackiewicz-Łyziak, J. (2014). Do consumers in Europe anticipate future
inflation? Eastern European Economics, 52(3), 5–32.
Marković, D., Petković, D., Nikolić, V., Milovančević, M., & Petković, B. (2017). Soft computing prediction of economic growth based in science and technology factors.
Physica A, 465, 217–220.
Martinsen, K., Ravazzolo, F., & Wulfsberg, F. (2014). Forecasting macroeconomic variables using disaggregate survey data. International Journal of Forecasting, 30(1), 65–77. Maschek, M. K. (2010). Intelligent mutation rate control in an economic application of genetic
algorithms. Computational Economics, 35(1), 25–49.
Milutinović, B., Stefanović, G., Ðekić, P. S., Mijailović, I., & Tomić, M. (2017). Environmental assessment of waste management scenarios with energy recovery using life cycle
assessment and multi-criteria analysis. Energy, 137, 917–926.
Mitchell, J. (2002). The use of non-normal distributions in quantifying qualitative survey data on expectations. Economics Letters, 76(1), 101–107.
Mitchell, J., Smith, R., & Weale, M. (2002). Quantification of qualitative firm-level survey data.
Economic Journal, 112(478), 117–135.
Mitchell, J., Smith, R., & Weale, M. (2005a). Forecasting manufacturing output growth using firm-level survey data. The Manchester School, 73(4), 479–499.
Mitchell, J., Smith, R., & Weale, M. (2005b). An indicator of monthly GDP and an early estimate of quarterly GDP growth. The Economic Journal, 115(501), F108–F129. Mittnik, S., & Zadrozny, P. (2005). Forecasting quarterly German GDP at monthly intervals
using monthly IFO business conditions data (2005). In J. E. Sturm and T. Wollmershäuser (Eds.), IFO survey data in business cycle analysis and monetary policy analysis (pp. 19– 48). Heidelberg: Physica-Verlag.
Mokinski, F., Sheng, X., & Yang, J. (2015). Measuring disagreement in qualitative expectations. Journal of Forecasting, 34(5), 405–426.
Müller, C. (2010). You CAN Carlson-Parkin. Economics Letters, 108(1), 33–35.
Nardo, M. (2003). The quantification of qualitative data: a critical assessment. Journal of Economic Surveys, 17(5), 645–668.
Nolte, I., & Pohlmeier, W. (2007). Using forecasts of forecasters to forecast. International Journal of Forecasting, 23(1), 15–28.
Österholm, P. (2014). Survey data and short-term forecasts of Swedish GDP growth. Applied Economics Letters, 21(2), 135–139.
Peng, Y., Yuan, C., Qin, X., Huang, J., & Shi, Y. (2014). An improved gene expression programming approach for symbolic regression problems. Neurocomputing, 137, 293– 301.
Pesaran, M. H. (1984). Expectation formation and macroeconomic modelling. In P. Malgrange and P. A. Muet (Eds.), Contemporary Macroeconomic Modelling (pp. 27–55). Basil Blackwell: Oxford.
Pesaran, M. H. (1985). Formation of inflation expectations in British manufacturing industries.
Economic Journal, 95(380), 948-975.
Pesaran, M. H., & Weale, M. (2006). Survey Expectations. In G. Elliott, C. W. J. Granger, and A. Timmermann (Eds.), Handbook of Economic Forecasting, Vol. 1 (pp. 715–776). Amsterdam: Elsevier North- Holland.
Petković, D. (2015). Adaptive neuro-fuzzy optimization of the net present value and internal rate of return of a wind farm project under wake effect. JCC: The Business and Economics Research Journal, 8(1), 11–28.
Poli, R., Vanneschi, L., Langdon, W. B., & Mcphee, N. F. (2010). Theoretical Results in Genetic Programming: The Next Ten Years? Genetic Programming and Evolvable Machines, 11(3), 285–320.
Qiao, Z., McAleer, M., & Wong, W. K. (2009). Linear and nonlinear causality between changes in consumption and consumer attitudes. Economic Letters, 102(3), 161–164.
Rahiala, M., & Teräsvirta, T. (1993). Business survey data in forecasting the output of Swedish and Finnish metal and engineering industries: A Kalman filter approach. Journal of Forecasting, 12(3-4), 255–271.
Ramos-Herrera, M. C., & Acosta-González, E. (2017). Factors determining exchange rate stability in member and candidate States of the European Union: An analysis based on genetic algorithms. Cuadernos de Economía, 40(112), 68–82.
Robinzonov, N., Tutz, G., & Hothorn, T. (2012). Boosting techniques for nonlinear time series models. AStA Advances in Statistical Analysis, 96(1), 99–122.
Sarradj, E., & Geyer, T. (2014). Symbolic regression modeling of noise generation at porous airfoils. Journal of Sound and Vibration, 333(14), 3189–3202.
Schmeling, M., & Schrimpf, A. (2011). Expected inflation, expected stock returns, and money illusion: What can we learn from survey expectations. European Economic Review, 55(5), 702–719.
Sheta, A. F., Ahmed, S. E. M., & Faris, H. (2015). Evolving stock market prediction models using multi-gene symbolic regression genetic programming. Artificial Intelligence and Machine Learning, 15(1), 11–20.
Smith, J., & McAleer, M. (1995). Alternative procedures for converting qualitative response data to quantitative expectations: an application to Australian manufacturing. Journal of Applied Econometrics, 10(2), 165–185.
Sorić, P., Lolić, I., & Mačkić, V. (2013). An empirical assessment of the expected inflation quantification methods. A pan-European study. Global Review of Business and Economics Research, 9(2), 117–132.
Stangl, A. (2007). Ifo World Economic Survey micro data. Journal of Applied Social Science Studies, 127(3), 487–496.
Stangl, A. (2008). Essays on the measurement of economic expectations. Dissertation. Munich: Universität München.
Terai, A. (2009). Measurement error in estimating inflation expectations from survey data: an evaluation by Monte Carlo simulations. Journal of Business Cycle Measurement and Analysis, 8(2), 133–156.
Theil, H. (1952). On the time shape of economic microvariables and the Munich Business Test.
Revue de l’Institut International de Statistique, 20, 105–20.
Thinyane, H., & Millin, J. (2011). An investigation into the use of intelligent systems for currency trading. Computational Economics, 37(4), 363–374.
Vasilakis, G. A., Theofilatos, K. A., Georgopoulos, E. F., Karathanasopoulos, A., &
Likothanassis, S. D. (2013). A genetic programming approach for EUR/USD exchange rate forecasting and trading. Computational Economics, 42(4), 415–431.
Vladislavleva, E.; Smits, G., den Hertog, D. (2010). On the importance of data balancing for symbolic regression. IEEE Transactions in Evolutionary Computation, 14(2), 252–277. Vermeulen, P. (2014). An evaluation of business survey indices for short-term forecasting:
Balance method versus Carlson-Parkin method. International Journal of Forecasting, 30(4), 882–897.
Waltman, L., Van Eck, N. J., Dekker, R., & Kaymak, U. (2011). Economic modeling using evolutionary algorithms: The effect of a binary encoding of strategies. Journal of Evolutionary Economics, 21(5), 737–756.
Wei, L. Y. (2013). A hybrid model based on ANFIS and adaptive expectation genetic algorithm to forecast TAIEX. Economic Modelling, 33, 893–899.
Wu, C. H., Chou, H. J., & Su, W. H. (2008). Direct transformation of coordinates for GPS positioning using the techniques of genetic programming and symbolic regression.
Engineering Applications of Artificial Intelligence, 21(8), 1347–1359.
Yang, G., Li, X., Wang, J., Lian, L., & Ma, T. (2015). Modeling oil production based on symbolic regression. Energy Policy, 82(1), 48–61.
Yao, L., & Lin, C. C. (2009). Identification of nonlinear systems by the genetic programming-based volterra filter. IET Signal Processing, 3(2), 93–105.
Wilms, I., Gelper, S., & Croux, C. (2016). The predictive power of the business and bank sentiment of firms: A high-dimensional Granger Causality approach. European Journal of Operational Research, 254(1), 138–147.
Wilson, G., & Banzhaf, W. (2009). Prediction of interday stock prices using developmental and linear genetic programming. In M. Giacobini et al. (Eds.), Applications of Evolutionary Computing (pp.172–181). Berlin: Springer-Verlag.
Yu, T., Chen, S., & Kuo, T. W. (2004). A genetic programming approach to model international short-term capital flow. Applications of Artificial Intelligence in Finance and Economics, 19, 45–70.
Zelinka, I. (2015). A survey on evolutionary algorithms dynamics and its complexity – Mutual relations, past, present and future. Swarm and Evolutionary Computation, 25, 2–14. Zimmermann, K. F. (1997). Analysis of business surveys. In M. H. Pesaran and P. Schmidt(Eds.),
Handbook of Applied Econometrics. Volume II: Microeconomics (pp. 407–441), Blackwell Publishers, Oxford.
SÈRIE DE DOCUMENTS DE TREBALL DE LA XREAP
2006
CREAP2006-01
Matas, A. (GEAP); Raymond, J.Ll. (GEAP)
"Economic development and changes in car ownership patterns" (Juny 2006)
CREAP2006-02
Trillas, F. (IEB); Montolio, D. (IEB); Duch, N. (IEB)
"Productive efficiency and regulatory reform: The case of Vehicle Inspection Services" (Setembre 2006)
CREAP2006-03
Bel, G. (PPRE-IREA); Fageda, X. (PPRE-IREA)
"Factors explaining local privatization: A meta-regression analysis" (Octubre 2006)
CREAP2006-04
Fernàndez-Villadangos, L. (PPRE-IREA)
"Are two-part tariffs efficient when consumers plan ahead?: An empirical study" (Octubre 2006)
CREAP2006-05
Artís, M. (AQR-IREA); Ramos, R. (AQR-IREA); Suriñach, J. (AQR-IREA) "Job losses, outsourcing and relocation: Empirical evidence using microdata" (Octubre 2006)
CREAP2006-06
Alcañiz, M. (RISC-IREA); Costa, A.; Guillén, M. (RISC-IREA);Luna, C.; Rovira, C. "Calculation of the variance in surveys of the economic climate”
(Novembre 2006)
CREAP2006-07
Albalate, D. (PPRE-IREA)
"Lowering blood alcohol content levels to save lives: The European Experience” (Desembre 2006)
CREAP2006-08
Garrido, A. (IEB); Arqué, P. (IEB)
“The choice of banking firm: Are the interest rate a significant criteria?” (Desembre 2006)
CREAP2006-09
Segarra, A. (GRIT); Teruel-Carrizosa, M. (GRIT)
"Productivity growth and competition in spanish manufacturing firms: What has happened in recent years?”
(Desembre 2006)
CREAP2006-10
Andonova, V.; Díaz-Serrano, Luis. (CREB)
"Political institutions and the development of telecommunications” (Desembre 2006)
CREAP2006-11
Raymond, J.L.(GEAP); Roig, J.L.. (GEAP)
"Capital humano: un análisis comparativo Catalunya-España” (Desembre 2006)
CREAP2006-12
Rodríguez, M.(CREB); Stoyanova, A. (CREB)
"Changes in the demand for private medical insurance following a shift in tax incentives” (Desembre 2006)
CREAP2006-13
Royuela, V. (AQR-IREA); Lambiri, D.; Biagi, B.
"Economía urbana y calidad de vida. Una revisión del estado del conocimiento en España” (Desembre 2006)
SÈRIE DE DOCUMENTS DE TREBALL DE LA XREAP Camarero, M.; Carrion-i-Silvestre, J.LL. (AQR-IREA).;Tamarit, C.
"New evidence of the real interest rate parity for OECD countries using panel unit root tests with breaks” (Desembre 2006)
CREAP2006-15
Karanassou, M.; Sala, H. (GEAP).;Snower , D. J.
"The macroeconomics of the labor market: Three fundamental views” (Desembre 2006)
2007
XREAP2007-01
Castany, L (AQR-IREA); López-Bazo, E. (AQR-IREA).;Moreno , R. (AQR-IREA) "Decomposing differences in total factor productivity across firm size”
(Març 2007)
XREAP2007-02
Raymond, J. Ll. (GEAP); Roig, J. Ll. (GEAP)
“Una propuesta de evaluación de las externalidades de capital humano en la empresa" (Abril 2007)
XREAP2007-03
Durán, J. M. (IEB); Esteller, A. (IEB)
“An empirical analysis of wealth taxation: Equity vs. Tax compliance” (Juny 2007)
XREAP2007-04
Matas, A. (GEAP); Raymond, J.Ll. (GEAP)
“Cross-section data, disequilibrium situations and estimated coefficients: evidence from car ownership demand” (Juny 2007)
XREAP2007-05
Jofre-Montseny, J. (IEB); Solé-Ollé, A. (IEB)
“Tax differentials and agglomeration economies in intraregional firm location” (Juny 2007)
XREAP2007-06
Álvarez-Albelo, C. (CREB); Hernández-Martín, R.
“Explaining high economic growth in small tourism countries with a dynamic general equilibrium model” (Juliol 2007)
XREAP2007-07
Duch, N. (IEB); Montolio, D. (IEB); Mediavilla, M.
“Evaluating the impact of public subsidies on a firm’s performance: a quasi-experimental approach” (Juliol 2007)
XREAP2007-08
Segarra-Blasco, A. (GRIT)
“Innovation sources and productivity: a quantile regression analysis” (Octubre 2007)
XREAP2007-09
Albalate, D. (PPRE-IREA)
“Shifting death to their Alternatives: The case of Toll Motorways” (Octubre 2007)
XREAP2007-10
Segarra-Blasco, A. (GRIT); Garcia-Quevedo, J. (IEB); Teruel-Carrizosa, M. (GRIT) “Barriers to innovation and public policy in catalonia”
(Novembre 2007)
XREAP2007-11
Bel, G. (PPRE-IREA); Foote, J.
“Comparison of recent toll road concession transactions in the United States and France” (Novembre 2007)
XREAP2007-12
SÈRIE DE DOCUMENTS DE TREBALL DE LA XREAP
XREAP2007-13
Bermúdez Morata, Ll. (RFA-IREA); Guillén Estany, M. (RFA-IREA), Solé Auró, A. (RFA-IREA) “Impacto de la inmigración sobre la esperanza de vida en salud y en discapacidad de la población española” (Novembre 2007)
XREAP2007-14
Calaeys, P. (AQR-IREA); Ramos, R. (AQR-IREA), Suriñach, J. (AQR-IREA) “Fiscal sustainability across government tiers”
(Desembre 2007)
XREAP2007-15
Sánchez Hugalbe, A. (IEB)
“Influencia de la inmigración en la elección escolar” (Desembre 2007)
2008
XREAP2008-01
Durán Weitkamp, C. (GRIT); Martín Bofarull, M. (GRIT) ; Pablo Martí, F. “Economic effects of road accessibility in the Pyrenees: User perspective” (Gener 2008)
XREAP2008-02
Díaz-Serrano, L.; Stoyanova, A. P. (CREB)
“The Causal Relationship between Individual’s Choice Behavior and Self-Reported Satisfaction: the Case of Residential Mobility in the EU” (Març 2008)
XREAP2008-03
Matas, A. (GEAP); Raymond, J. L. (GEAP); Roig, J. L. (GEAP) “Car ownership and access to jobs in Spain”
(Abril 2008)
XREAP2008-04
Bel, G. (PPRE-IREA) ; Fageda, X. (PPRE-IREA)
“Privatization and competition in the delivery of local services: An empirical examination of the dual market hypothesis” (Abril 2008)
XREAP2008-05
Matas, A. (GEAP); Raymond, J. L. (GEAP); Roig, J. L. (GEAP) “Job accessibility and employment probability”
(Maig 2008)
XREAP2008-06
Basher, S. A.; Carrión, J. Ll. (AQR-IREA)
Deconstructing Shocks and Persistence in OECD Real Exchange Rates (Juny 2008)
XREAP2008-07
Sanromá, E. (IEB); Ramos, R. (AQR-IREA); Simón, H.
Portabilidad del capital humano y asimilación de los inmigrantes. Evidencia para España (Juliol 2008)
XREAP2008-08
Basher, S. A.; Carrión, J. Ll. (AQR-IREA)
Price level convergence, purchasing power parity and multiple structural breaks: An application to US cities (Juliol 2008)
XREAP2008-09
Bermúdez, Ll. (RFA-IREA)
A priori ratemaking using bivariate poisson regression models (Juliol 2008)
SÈRIE DE DOCUMENTS DE TREBALL DE LA XREAP XREAP2008-10
Solé-Ollé, A. (IEB), Hortas Rico, M. (IEB)
Does urban sprawl increase the costs of providing local public services? Evidence from Spanish municipalities (Novembre 2008)
XREAP2008-11
Teruel-Carrizosa, M. (GRIT), Segarra-Blasco, A. (GRIT) Immigration and Firm Growth: Evidence from Spanish cities (Novembre 2008)
XREAP2008-12
Duch-Brown, N. (IEB), García-Quevedo, J. (IEB), Montolio, D. (IEB)
Assessing the assignation of public subsidies: Do the experts choose the most efficient R&D projects? (Novembre 2008)
XREAP2008-13
Bilotkach, V., Fageda, X. (PPRE-IREA), Flores-Fillol, R.
Scheduled service versus personal transportation: the role of distance (Desembre 2008)
XREAP2008-14
Albalate, D. (PPRE-IREA), Gel, G. (PPRE-IREA)
Tourism and urban transport: Holding demand pressure under supply constraints (Desembre 2008)
2009
XREAP2009-01
Calonge, S. (CREB); Tejada, O.
“A theoretical and practical study on linear reforms of dual taxes” (Febrer 2009)
XREAP2009-02
Albalate, D. (PPRE-IREA); Fernández-Villadangos, L. (PPRE-IREA)
“Exploring Determinants of Urban Motorcycle Accident Severity: The Case of Barcelona” (Març 2009)
XREAP2009-03
Borrell, J. R. (PPRE-IREA); Fernández-Villadangos, L. (PPRE-IREA) “Assessing excess profits from different entry regulations”
(Abril 2009)
XREAP2009-04
Sanromá, E. (IEB); Ramos, R. (AQR-IREA), Simon, H.
“Los salarios de los inmigrantes en el mercado de trabajo español. ¿Importa el origen del capital humano?” (Abril 2009)
XREAP2009-05
Jiménez, J. L.; Perdiguero, J. (PPRE-IREA)
“(No)competition in the Spanish retailing gasoline market: a variance filter approach” (Maig 2009)
XREAP2009-06
Álvarez-Albelo,C. D. (CREB), Manresa, A. (CREB), Pigem-Vigo, M. (CREB) “International trade as the sole engine of growth for an economy”
(Juny 2009)
XREAP2009-07
Callejón, M. (PPRE-IREA), Ortún V, M. “The Black Box of Business Dynamics” (Setembre 2009)
XREAP2009-08 Lucena, A. (CREB)
“The antecedents and innovation consequences of organizational search: empirical evidence for Spain” (Octubre 2009)