Analysis on efficiency of Korea’s internet-only banks :
Data Envelopment Analysis
By
LEE, Seo-Jin
THESIS
Submitted to
KDI School of Public Policy and Management In Partial Fulfillment of the Requirements
For the Degree of
MASTER OF PUBLIC POLICY
Analysis on efficiency of Korea’s internet-only banks :
Data Envelopment Analysis
By
LEE, Seo-Jin
THESIS
Submitted to
KDI School of Public Policy and Management In Partial Fulfillment of the Requirements
For the Degree of
MASTER OF PUBLIC POLICY
2020
Table of contents Abstract ... 4 Chapter 1 ... 5 Introduction ... 5 Chapter 2 ... 6 Literature review ... 6
Korea internet banking services ... 6
Bank efficiency measurement: Data envelopment analysis ... 8
Efficiency measurement ... 10
Efficiency of Korean banks... 11
Chapter 3: Research Method and Data ... 13
Research method ... 13 Data ... 14 Chapter 4 : Results ... 17 Results ... 17 Chapter 5: Conclusion ... 22 References ... 23
Acknowledgment
First of all, I would like to express my gratitude to my supervisor, who provided guidance that helped me to conduct research and write this thesis successfully. Moreover, I would like to thank my family and my friends for all of the support and encouragement they provide in everything I do.
Abstract
This paper analyzes the efficiency of internet-only banks in South Korea during the period starting from 2017 to 2019. To use the data envelopment analysis, we examine the efficiency rate of Korea’s banking industry. The data envelopment analysis(DEA) was generally used to apply to measure the efficiency of banks. From the perspective taken, variables alter to inputs and outputs. Herein the operating and intermediation approaches were applied. Analysis on two internet-only banks in Korea, the results indicate that Kakao bank efficiencies tend to increase. However, the K-bank’s efficiencies were goes down as time goes by. Considering this situation, the role of government is gaining importance in promoting innovation enabled by new technologies.
Chapter 1 Introduction
Recent advancements in our lives made by new technologies enabled the banking industry’s structure to change. In other words, the internet and mobile innovations revolutionized the traditional concept of bank services. In the past, the banks were the sole dominant players in the financial market and services. The banks served people with providing savings, transfer, and lending services. However, by adopting new technologies, new kinds of financial institutions are aggressively expanding their area of services. For instance, novel payment systems, namely PayPal, Apple Pay and Alipay, rapidly began to be adopted by the consumers at a massive scale.
As these new companies grew in size and competitiveness, aside of relatively basic services such as remittance and money transfer, they have also began to engage in more traditional operations such as lending, which has been considered a function that only the larger banks and institutions were able to execute. This enabled traditional banks to also take actions such as launching online banking services which could seamlessly operate on the consumers’ mobile devices and internet browser environment. Nevertheless the efforts, the traditional banks are losing competitive edge against the emerging online financial players (Navaretti, Calzolari et al., 2017).
In the case of Korea, banks increase their efficiency and financial soundness by means of M&A during late 1990s to early 2000s. However, due to rapid change in financial industry, the efficiency of large Korean banks had decreased gradually over time(Kang, 2019). Compared to other countries with developed economy, South Korea adopted online-only banking service rather later. The result is Korean financial market’s lack of competitiveness. Despite its importance, there is a limited research paper about studying banks' efficiency in Korea. For this reason, I would like to examine change in efficiencies of banks in South Korea
after since the launching of online-only bank. K-bank and Kakao bank were taken as the subject of the online-only bank referred in this paper.
Chapter 2 presents relevant literature reviews which illustrate the history of the internet banking in South Korea and explain the methodology of measuring efficiency. Chapter 3 introduces data envelopment analysis which is the primary method utilized in this research. Detailed data information is described with hypotheses in Chapter3. Following-on results and discussion will be portrayed in Chapter 4. Lastly, I will conclude this study in Chapter 5.
Chapter 2 Literature review
Korea internet banking services
During the period of Asian financial crisis in 1997, a number of banks in Korea inevitably went under reformation and restructuring. Merging of bankrupted banks continued until early of 2002. End of this stage of restructuring period, the Korean banks started to introduce the banking services via the internet and telephone. Services offered began with the ones essential to the customers such as providing information. Table 1 illustrates the first stage of the 18 Korean banks' internet banking services date back 2000. This table included all of the commercial and local banks in Korea. Different services are sorted and categorized in the table. For example, the information providing category contains information on financial products, securities(stocks), and exchange rates. Others includes the services like opening a bank account, wire transferring of funds, security trading and offering insurances. It can be observed that the internet based services presented in Table 1 leaned towards the category of providing and confirming essential information.
South Korean banks adopted the internet banking services later than the other banks in notable economies. In United states, online banking services were launched for the first time during the 1980s (Cronin, 1998). And the branch-less online banking service called ‘Direct
bank’ appeared for the first time during 1990s. Conversely, Korea's commercial banks started partial online and mobile services in early 2000 (Bank of Korea, 2000). And the first online-only bank appeared in 2017. Under this situation, Korea's financial services diversification was lagged with technological developments. Thus, we would like to see the state of affairs after the internet-only bank introduced. Herein this research will focus on the efficiency of the banking sector.
(O: adequately providing services, /: partially providing services)
Source: Bank of Korea report, "Stage of domestic banks' internet banking services" (2000.07)
Bank efficiency measurement: Data envelopment analysis
Data envelopment analysis(DEA) has been observed as a non-parametric methodology for measuring and evaluating entities and banks' efficiency. DEA was formed by decision-making units'(DMUs) of various inputs and outputs. For example, individual banks are becoming the decision-making units(DMUs) in the banking sector. In a large bank, each branch can be a DMU. Thus, they can compare the efficiency result by DMUs. Moreover, DEA could not only use financial data but also non-financial variables. There are variables which are input and output. It depends on the perspective of the researchers on the role of the banks which variable shall take input or output.
From the views of banks' primary function, the DEA model's input and output variables are changing. In the book on microeconomics of baking, three kinds of approaches are mentioned as to how the banks can be viewed: the production approach, the intermediation approach, and the modern approach (Freixas and Rochet,1999). The first and second approaches were contained in the traditional microeconomics theory of the banking sector. For
instance, the production approach showed that banks play a leading role in the production of services to consumers. Thus the input can be the number of employees and capital, and the outputs are the only loan. For the view of intermediation role, researchers consider the banks as financial intermediaries that simply transfer and lent the money for the user. So the input variables are labor, capital, and deposits and outputs are the loans and securities. Lastly, the modern approach describes an operating view that focuses on the profits of the bank. In this case, the output is returns from the operating, interest, and commission/fees. The table below shows that the summary of inputs and outputs by approaches.
Table2. input and output variables by way of approach
Approach Input Output
Production Labor, Capital Loan
Intermediation Labor, Capital, Deposit Loan, Security
Operating Labor, Capital, Expenses Profits
(Operating, interest, commission)
The data envelopment analysis(DEA) model was stemmed from Farrell's Isoquant analysis. It developed a single input and output definition to multiple inputs and outputs equation. This first DEA model was introduced by Charnes, Cooper, and Rhodes in 1978 (Charnes et al.,1978). It named the DEA CCR model after the first letter of the author's name. After the CCR model, Banker, Charnes, and Cooper develop the new DEA model called the BCC model, which generally use to measuring the bank's efficiency ratio. The difference between CCR and BCC model is they are assuming different returns-to-scale evaluations. The DEA CCR model was referred to as constant returns of scale(CRS). However, the BCC model was using variable returns to scale(VRS). The DEA CCR model is appropriate when the banks are operating on an optimal scale, in which the firms were perfectly competitive environment
(Huguenin, 2012). Compared with this, and the real firms were not serving optimal size; thus, the DEA BCC model was generally used.
Those two types of DEA models again diverge into input and output orientation. In the input orientation, the equation was to minimize the inputs under the given level of outputs. Compared to input-oriented, the output orientation was to maximize outputs for the given level of inputs. However, both orientations have a minor effect from the results under the same returns of scale model (Coelli, 1996). Thus, choosing the model is more important.
Efficiency measurement
Except for the data envelopment analysis (DEA), there are three major analysis methods commonly used in evaluating efficiency: functional approach, ratio analysis, productivity index method. Differences come from the way of approaches. Each has its own advantages and disadvantages to measuring efficiency. However, recently conducted studies prefer to use data envelopment analysis(DEA) and Malmquist analysis method. To explain the characteristics of the measurement, this chapter describes the brief concept of efficiency analysis methods.
The approach utilizes the regression model which is broadly used in statistics. There are two categories of regression model linear and nonlinear regression. From the linear aspect, the formula of the multiple regression model was composed of inputs and output variables with random error. Thus, the formula shows the correlation between dependent and independent variables. Similar to the linear regression, the nonlinear regression also contains dependent and independent variables. Single regression formula produces single output. And because of this inherent limitation, regression model is not suitable for analyzing banking sector’s efficiency where it is required to produce multiple outputs.
Secondly, ratio analysis was generally used to measure business performance. The ratio analysis compares relationship between variables to evaluate companies' profitability,
soundness, and stabilities (Park, 2008). This analysis is using financial data to make financial ratios and cost-benefit ratios. When financial data was limited, non-financial data also can be used to supplement the data limitation. Other analysis methods can be applied as a complement. Specifically, the limitation comes from the indication of ratio. Moreover, it is hard to evaluate the total effect of inputs and outputs due to partial information. Thus, the ratio approach does not fit for evaluating bank efficiencies in general.
Depending on the output criterion, the productivity index was sorted as capital productivity and value productivity. However, the productivity index takes perfect competition and balanced technical improvement as assumption. Therefore, it is not suitable for measuring efficiency of banking industry where it produces various kinds of value. Due to the limitations of methodologies mentioned above, we would like to use the data envelopment analysis to measuring banks’ efficiency.
Efficiency of Korean banks
Literatures viewed for this research were using data from 1997 after Asian financial crisis to focus on the Korean bank’s M&A and global financial crisis in 2008. For example, Dong and Kim(2011) show that Korea’s banking restructuring had a positive effect on improving banking efficiency in Korea. In other hand, there are other results was shown when data size was bigger. Kang (2019) also examined the technical efficiency of Korean banks after restructuring period. The 18 years of periodic data ranged from year 2001 to 2018. The study conducted was to find out the relationship between the effect of bank’s expansion and the bank’s efficiency after restructuring. The paper demonstrates that the overall efficiency of Korea’s banking industry gradually decreased from 2001 to 2018 as opposed to the increased concentration in the market over time. It explains that the increase the market concentration has negative effect to the Korean bank efficiency in a long run. One of the reason is the change in the financial environment caused by the development of the internet. However, there are
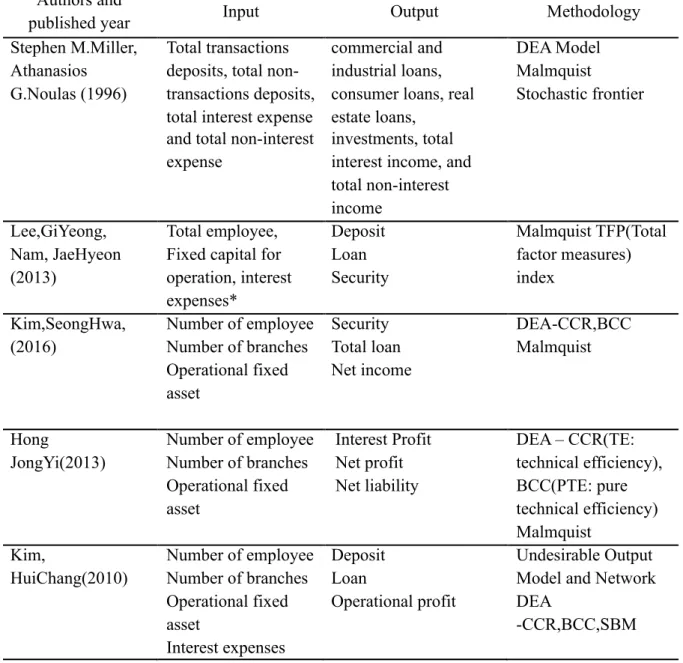
limited number of papers about the internet only banks since it first appeared in Korea. Thus, we are measuring the internet-only banks efficiency rate in this paper. Table 3 illustrates the summary of the inputs/outputs and results from the conducted methodology.
Table 3. Summary of literature reviews- banking efficiency papers
Authors and
published year Input Output Methodology
Stephen M.Miller, Athanasios G.Noulas (1996)
Total transactions deposits, total non-transactions deposits, total interest expense and total non-interest expense
commercial and industrial loans, consumer loans, real estate loans,
investments, total interest income, and total non-interest income DEA Model Malmquist Stochastic frontier Lee,GiYeong, Nam, JaeHyeon (2013) Total employee, Fixed capital for operation, interest expenses* Deposit Loan Security Malmquist TFP(Total factor measures) index Kim,SeongHwa, (2016) Number of employee Number of branches Operational fixed asset Security Total loan Net income DEA-CCR,BCC Malmquist Hong JongYi(2013) Number of employee Number of branches Operational fixed asset Interest Profit Net profit Net liability DEA – CCR(TE: technical efficiency), BCC(PTE: pure technical efficiency) Malmquist Kim, HuiChang(2010) Number of employee Number of branches Operational fixed asset Interest expenses Deposit Loan Operational profit Undesirable Output Model and Network DEA
-CCR,BCC,SBM
Chapter 3: Research Method and Data Research method
The data envelopment analysis(DEA) defined as a non-parametric linear programming method for measuring the efficiency of institutions that uses multiple inputs and outputs of DMUs(decision-making unit). Simply, this method is using DMU’s inputs and outputs to draw the efficient production frontier to measure and evaluate each DMU's efficiency instead of using production function and cost function. In other words, the DEA shows the distance between the efficient production frontier each DMU’s point. Based on this distance, we can measure the individual DMU’s efficiency ratio and evaluate the efficiencies between the set of DMUs. This DEA method has been developed into many other methodologies so far.
As time goes by, the DEA model has improved by many researchers. The earliest model was named CCR and BCC DEA model named after the first letter of the authors. The CCR DEA model was assuming the constant return to scale to measure the relative efficiency ratio. However, the BCC model was referred to as the variable return to scale rather than using constant return to scale. Both models also separated from which orientation was followed by input or output. However, the orientation is less likely to affect the results in the same model. Thus, choosing a model was more important than which orientation was followed. Because of the CRS(constant returns to scale) assumption, the DEA CCR model does not distinguish between efficiency of scale and technical efficiency. However, the BCC model was using the VRS assumption to complement the shortcomings of CCR.
In this paper, the BCC model was used as measuring the bank's efficiency ratio. The function of the input-oriented DEA BCC model, as shown below. Here we assume that the nth number of DMU was evaluated. The decision-making unit was represented as DMUj, which j means that j= 1,2,…,n. To measure the relative efficiency of DMUj, the other DMU was denoted as DMU0.
Input oriented BCC DEA model min ℎ 𝜃 𝑠. 𝑡. 𝜆 𝑥 𝑆 𝜃𝑥 , 𝑖 1, … , 𝑚 𝜆 𝑦 𝑆 𝑦 , ,…, 𝜆 1 𝑆 , 𝑆 , 𝜆 0, ∀ 𝑖, 𝑟, 𝑗 <Index> ℎ 𝑒𝑓𝑓𝑖𝑐𝑖𝑒𝑛𝑐𝑦 𝑜𝑓 𝐷𝑀𝑈 𝑥 𝑖 𝑡ℎ 𝑖𝑛𝑝𝑢𝑡 𝑓𝑎𝑐𝑡𝑜𝑟 𝑜𝑓 𝑗 𝑡ℎ 𝐷𝑀𝑈 𝑦 𝑟 𝑡ℎ 𝑜𝑢𝑡𝑝𝑢𝑡 𝑓𝑎𝑐𝑡𝑜𝑟 𝑜𝑓 𝑗 𝑡ℎ 𝐷𝑀𝑈 𝑦 𝑟𝑡ℎ 𝑜𝑢𝑡𝑝𝑢𝑡 𝑓𝑎𝑐𝑡𝑜𝑟 𝑜𝑓 𝐷𝑀𝑈 𝑥 𝑖 𝑡ℎ 𝑖𝑛𝑝𝑢𝑡 𝑓𝑎𝑐𝑡𝑜𝑟 𝑜𝑓 𝐷𝑀𝑈 𝑆 𝑆𝑙𝑎𝑐𝑘 𝑣𝑎𝑟𝑖𝑎𝑏𝑙𝑒 𝑜𝑓 𝑖 𝑡ℎ 𝑖𝑛𝑝𝑢𝑡 𝑓𝑎𝑐𝑡𝑜𝑟 𝑆 𝑆𝑙𝑎𝑐𝑘 𝑣𝑎𝑟𝑖𝑎𝑏𝑙𝑒 𝑜𝑓 𝑟 𝑡ℎ 𝑜𝑢𝑡𝑝𝑢𝑡 𝑓𝑎𝑐𝑡𝑜𝑟 𝜆 𝑊𝑒𝑖𝑔ℎ𝑡 𝑜𝑓 𝑗 𝑡ℎ 𝐷𝑀𝑈 Data
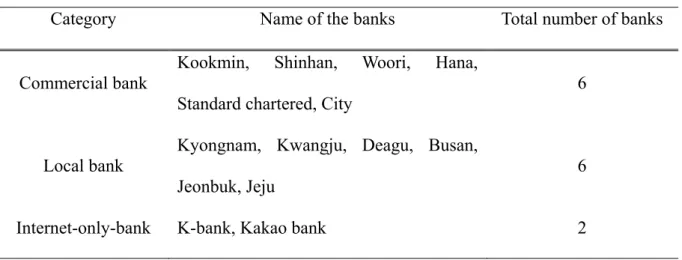
Under this research method, the data came from Korea Financial Statistics Information System(FISIS), which is managed by Korea Financial Supervisory Service(FSS). The total number of banks is 14 banks: Kookmin, Shinhan, Woori, Hana, Standard chartered, City, Kyongnam, Kwangju, Deagu, Busan, Jeonbuk, Jeju, K-bank, and Kakao bank. Those banks were classified as three categories based on the operating style of banks. The table below shows the name of the banks by groups.
Table 4. Categorized banks
Category Name of the banks Total number of banks
Commercial bank Kookmin, Shinhan, Woori, Hana, Standard chartered, City
6
Local bank
Kyongnam, Kwangju, Deagu, Busan, Jeonbuk, Jeju
6
Internet-only-bank K-bank, Kakao bank 2
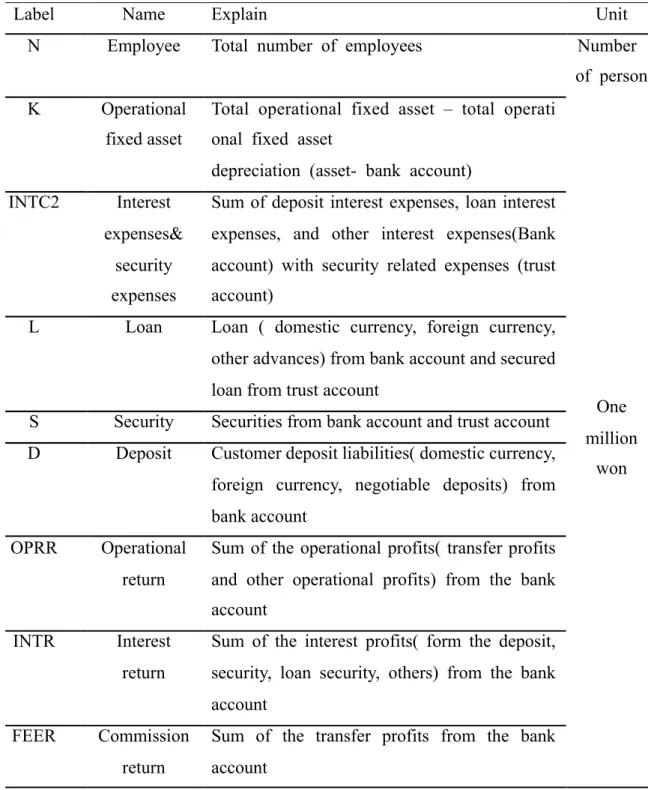
The period of data was from 3rd quarter of 2017 to 2019, when the online-only bank data existed. Therefore those financial and non-financial annual data was fixed in December of each year. To improve accuracy, the quarterly data was used rather than yearly data to use the STATA program to run the DEA BCC model. Table 5, illustrate the detailed information of inputs and outputs variables. See table 5 for more details.
Table 5. Variables
Label Name Explain Unit
N Employee Total number of employees Number
of person K Operational
fixed asset
Total operational fixed asset – total operati onal fixed asset
depreciation (asset- bank account)
One million won INTC2 Interest expenses& security expenses
Sum of deposit interest expenses, loan interest expenses, and other interest expenses(Bank account) with security related expenses (trust account)
L Loan Loan ( domestic currency, foreign currency, other advances) from bank account and secured loan from trust account
S Security Securities from bank account and trust account D Deposit Customer deposit liabilities( domestic currency,
foreign currency, negotiable deposits) from bank account
OPRR Operational return
Sum of the operational profits( transfer profits and other operational profits) from the bank account
INTR Interest return
Sum of the interest profits( form the deposit, security, loan security, others) from the bank account
FEER Commission return
Sum of the transfer profits from the bank account
Chapter 4 : Results Results
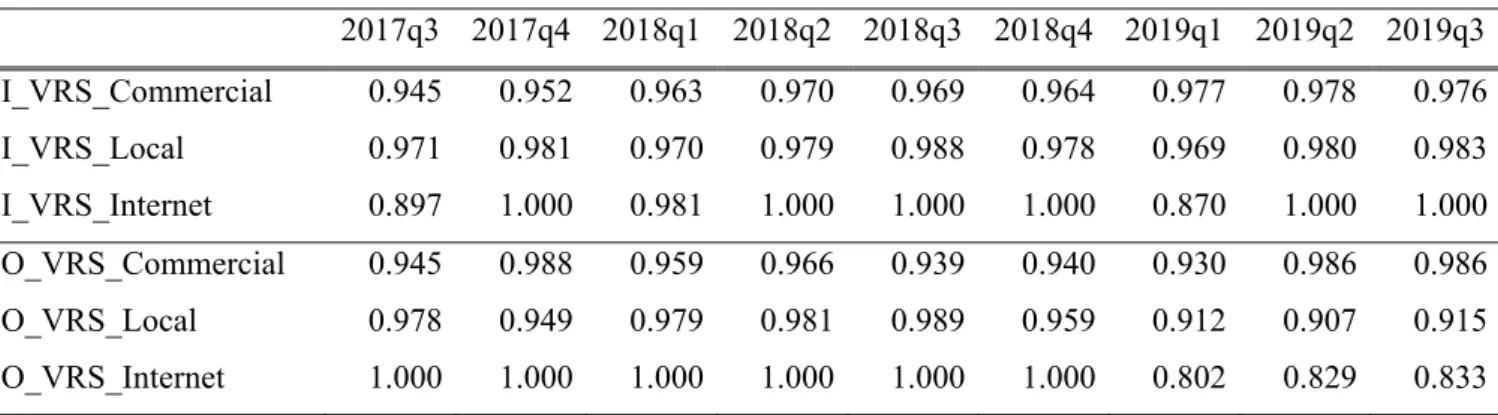
Considering the characteristic of internet-only-banks, we are using intermediation and operating approaches to measure the bank's efficiency. From the different views of the bank's primary function, they are using different inputs and outputs variables. Thus, there are two different efficiency ratios presented. Table 6 shows the average efficiency result of categorized banks. The VRS stands for the variable returns to scale, which means it represents the technical efficiency of the DEA BCC model. And also, the intermediation approach was described as I_VRS, and the operating approach is identified O_VRS in this table. We can observe that the internet only banks result has a significant difference between intermediation result and operating result. Because the K-banks operating outputs rapidly decline 2019.
Table 6. Average of the VRS technical efficiencies by banks
2017q3 2017q4 2018q1 2018q2 2018q3 2018q4 2019q1 2019q2 2019q3 I_VRS_Commercial 0.945 0.952 0.963 0.970 0.969 0.964 0.977 0.978 0.976 I_VRS_Local 0.971 0.981 0.970 0.979 0.988 0.978 0.969 0.980 0.983 I_VRS_Internet 0.897 1.000 0.981 1.000 1.000 1.000 0.870 1.000 1.000 O_VRS_Commercial 0.945 0.988 0.959 0.966 0.939 0.940 0.930 0.986 0.986 O_VRS_Local 0.978 0.949 0.979 0.981 0.989 0.959 0.912 0.907 0.915 O_VRS_Internet 1.000 1.000 1.000 1.000 1.000 1.000 0.802 0.829 0.833
Based on the result from Table 6, Figure 1 and Figure 2 show the graph of technical efficiency by type of banks. In figure 1, the commercial and local bank's trend was stable over the number of 0.95(95%), which means Korea's commercial and local banks tend to settle as intermediation views. However, the internet banks' technical efficiency result fluctuated twice in 3quarter of 2017 and 1quarter of 2019. The first stage might be concerned as the first internet bank was launched. The second-lowest position was caused by the Kakao bank's efficiency rather than
K-bank's technical efficiency. Under the intermediation approach, commercial and local banks' professional efficiency rates tended to stabilize rather than internet banks. However, internet banks were positioned higher than commercial and local banks except for two points. Fig.1. Intermediation approach
Comparing with the intermediation view, figure 2 was denoted the operating approach DEA BCC results by banks. Not like the intermediation view, the internet only banks efficiency result occupied the highest rank from the end of 2017 to 2018. However, starting from the year 2019, the internet bank's efficiency rate declined to 0.8(80%) point. To see the table 7, we can observe the lower internet efficiency caused by the K-bank.
0.7 0.75 0.8 0.85 0.9 0.95 1 1.05 2017q3 2017q4 2018q1 2018q2 2018q3 2018q4 2019q1 2019q2 2019q3 VRS_ Ratio Time I_VRS_Commercial I_VRS_Local I_VRS_Internet
Fig.2. The operational approach of average technical efficiency
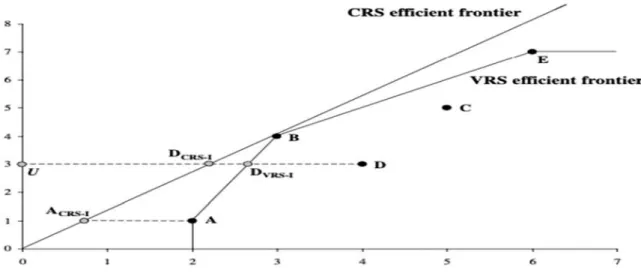
To understand more about the internet efficiency result, we can see the table 7 to see technical efficiency result with the scale efficiency results. Here, the technical efficiency was presented TE, and scale efficiency was named SE. The scale efficiency shows that the gap between the CRS and the VRS frontiers. For example, the point was located in the VRS efficiency frontier. However, that point can not be found in a CRS efficiency frontier.
The DEA approach specifies production functions of individual banks in terms of the distance from the production frontier. When a bank in question is plotted inside the frontier, it signifies that the bank is operating in a manner not fully utilizing its capabilities. Inefficiency in this regard could either mean technical or in scale. The distance from the drawn frontier implies the technical inefficiency resulted by inputs not being fully harnessed. The deviation from an
optimal scale corresponding to constant returns to scale is a measure of diseconomies or economies of scale. 0.7 0.75 0.8 0.85 0.9 0.95 1 1.05 2017q32017q42018q12018q22018q32018q42019q12019q22019q3 VRS_ Ratio Time O_VRS_TE_Commercial O_VRS_TE_Local O_VRS_TE_Internet
Figure.3. example of CRS and VRS efficiency frontier
In Figure 3, the distance between the point A and A CRS-1 was shown as scale inefficiency. If that’s the case, the problem of the scale was occurred by the small scale of institution. In other words, we can observe the inefficiency resulted from the scale problem or poor management to compare the technical and scale efficiency. Table 7 contains the detailed technical efficiency and scale efficiency of online banks(K-bank and Kakao bank) in Korea. Table 7. internet-only banks' technical efficiency and scale efficiency
DMU Period I_VRS_TE I_SE O_VRS_TE O_SE
K-bank 2017q3 1.0000 0.8193 1.0000 0.5499 2017q4 1.0000 0.8497 1.0000 0.5545 2018q1 1.0000 0.8475 1.0000 0.6393 2018q2 1.0000 0.8441 1.0000 0.6776 2018q3 1.0000 0.8844 1.0000 0.7022 2018q4 0.9577 0.8885 1.0000 0.7026 2019q1 0.8377 0.8333 0.6657 0.7891 2019q2 0.9094 0.8472 0.6913 0.8340 2019q3 0.9508 0.8276 0.6653 0.8767 Kakao bank 2017q3 0.8966 0.9459 1.0000 0.8730 2017q4 1.0000 0.9870 1.0000 1.0000
2018q1 0.9813 0.9705 1.0000 1.0000 2018q2 1.0000 0.9739 1.0000 0.9783 2018q3 1.0000 1.0000 1.0000 1.0000 2018q4 1.0000 1.0000 1.0000 1.0000 2019q1 0.8703 0.9807 0.9386 0.9542 2019q2 1.0000 1.0000 0.9670 0.9955 2019q3 1.0000 1.0000 1.0000 1.0000
The K-bank's total technical efficiency was higher than scale efficiency as an intermediation approach. However, the operational technical efficiency goes down after the 2019 year. In other words, the inefficacy was caused by management or operational problem rather than the scale of K-bank. The difference also caused by the different inputs and output variables by approach. In addition, the efficiency rate goes down when the operational view was applied in K-bank. On the contrary, there is no significant difference between Kakao bank's technical and scale efficiency results.
Moreover, there is a similar result shown as intermediation and operating approaches. Briefly, Kakao bank was efficiently managed bank as a role of intermediation and operating. At last, Kakao bank's technical and scale efficiency result was noted 1(100%) in the last period(3q2019). It means that the Kakao bank was in a perfect efficiency situation. Comparing with Korea's online bank efficiency, we can say that the K-banks efficiency rate was lower than the Kakao bank.
Chapter 5: Conclusion
Because of the Asian financial crisis and financial regulations, the Korean banking industry adopted the new internet bank system later than other major economies, so did the implementation of regulations and permits for internet-only banks. Because of this, the importance and accountability of public policymakers have increased. Thus, The Korean government started regulatory sandbox in 2019(2019, The Korea Herald). As a part of the new financial institution, there is an increasing interest in internet-only banks, which started operating in 2017. To understand online banking industry, this paper has examined the empirical technical efficiency of 14 number of Korea banks from 2017 to 2019. To compare the relative efficiency rate of commercial, local, and internet banks in Korea, we used a data envelopment analysis method to find the technical and scale efficiency of internet-only banks(K-bank, Kakao bank).
From the intermediate view of internet-only banks, except for two quarters, the average efficiency rate was higher than other commercial and local banks in Korea. From the operating perspective of view in the other hand, the average efficiency rate suddenly goes down after the first quarter of 2019. The inefficiency was mainly caused by the K-bank. We could observe the K-banks' scale efficiency rate was lower than the Kakao bank in general. However, the Kakao bank maintained a higher technical and scale efficiency rate from the intermediation and operating perspective of views respectively.
References
Navaretti, G. B., Calzolari, G. M., Mansilla-Fernandez, J. M., & Pozzolo, A. F. (2017).
“Fintech and Banking. Friends or Foes?” , European Economy Banks, Regulation, and the Real Sector. doi:10.2139/ssrn.3099337
Kang, Da neon. “Analysis of Efficiency by the Expansion of the Domestic Banking
Industry.” Korea financial economic institute , 2019. http://fei.or.kr.
Miller, Stephen M., and Athanasios G. Noulas. “The Technical Efficiency of Large Bank Production.” Journal of Banking & Finance 20, no. 3 (1996): 495–509.
https://doi.org/10.1016/0378-4266(95)00017-8.
GiYeong, Lee, and Nam JaeHyeon. “은행산업의 생산성 결정요인 분석[Analysis of the Productivity Determinants in the Banking Industry] ,” 2013.
http://www.kif.re.kr/KMFileDir/130046973550367500_WP13-01.pdf.
Hong,Jong-yi. “은행의 효율성 및 생산성 비교-지방은행을 중심으로- [Comparing the efficiency and productivity index of the bank-toward to regional bank],” KCI, 2013, vol.36, no.2, pp. 217-234 (18 pages)
Kim, Seong-Hwa. “Analysis of Efficiency and Malmquist Productivity Index Change of Domestic Commercial Banks.” Journal of Industrial Economics and Business 29, no. 6 (2016): 2077. https://doi.org/10.22558/jieb.2016.12.29.6.2077.
HuiChang, Kim. “우리나라 은행산업의 효율성 및 수익성 분석[A study of efficiency and profitability of Korean Banks].” Library of Dankook Uinvirsity[단국대학교
퇴계기념도서관], 2010.https://lib.dankook.ac.kr/search/detail/CATTOT000001099890.
Choi, Sinjun., and Cha, Junhwan. (2008). “은행산업의 구조변화가 효율성에 미친 영향
[The effect of structural change on efficiency in banking industry]”. Bank of Korea report
Charnes, A., W.w. Cooper, and E. Rhodes. “Measuring the Efficiency of Decision Making Units.” European Journal of Operational Research2, no. 6 (1978): 429–44.
https://doi.org/10.1016/0377-2217(78)90138-8.
“국내은행 인터넷뱅킹서비스 이용현황,[ Current status of internet banking service of domestic banks].” July 18, 2000. http://www.bok.or.kr
Nasir, Shoaib. "DATA ENVELOPMENT ANALYSIS History, Models, and Interpretations." International Series in Operations Research & Management Science.
https://www.academia.edu/8653257/DATA_ENVELOPMENT_ANALYSIS_History_Model s_and_Interpretations.
Cronin, Mary J. Banking and Finance on the Internet. New York, NY <<>>: Wiley, n.d.
“Financial Services Commission.” KOREAN New window. Accessed February 23, 2020. http://www.fsc.go.kr/eng/id/id0101.jsp#sub_list_4.
Freixas, X. and Rochet, J.-C. (1999) Microeconomics of Banking, 4th edn (Cambridge, MA: MIT Press). Morgan Stanley Capital International Inc. Available at http://www.msci.com/
Freixas, X., and J. C. Rochet. Microeconomics of Banking. Massachusetts Institute of
Technology, 1998.
“Data Envelopment Analysis (DEA) - UNIL.” Accessed April 24, 2020.
Huguenin, Jean-Marc. “Data Envelopment Analysis (DEA) : A Pedagogical Guide for ...” idheap, 2012. https://serval.unil.ch/notice/serval:BIB_0FC432348A97.
Shin, Dong Jin, and Brian H. S. Kim. “Efficiency of the Banking Industry Structure in
Korea*.” Asian Economic Journal25, no. 4 (2011): 355–73. https://doi.org/10.1111/j.1467
8381.2011.02066.x.
Coelli, T. J. (1996). A Guide to DEAP Version 2.1: A Data Envelopment Analysis
(Computer) Program (CEPA Working Paper 96/08). Brisbane: Centre for Efficiency and Productivity Analysis, University of Queensland.
Park, M. (2008). Hyoyulseong-gwa saengsanseong bunseog [Efficiency and Productivity Analysis]. Korean Studies Information
Appendix
DMU Period I_CRS_TE I_VRS_TE I_Scale O_CRS_ TE O_VRS_ TE O_Scale Kyongnam 2017q3 0.9933 0.9936 0.9997 0.9377 0.9860 0.9510 2017q4 1.0000 1.0000 1.0000 0.9474 1.0000 0.9474 2018q1 0.9958 0.9959 0.9999 0.9368 0.9987 0.9380 2018q2 0.9932 0.9933 1.0000 0.9027 0.9765 0.9244 2018q3 1.0000 1.0000 1.0000 0.9217 1.0000 0.9217 2018q4 0.9934 0.9945 0.9989 0.8838 0.9989 0.8848 2019q1 0.9790 0.9799 0.9991 0.8492 0.9404 0.9030 2019q2 0.9926 0.9934 0.9992 0.8511 0.8721 0.9759 2019q3 0.9951 0.9953 0.9998 0.8389 0.9163 0.9155 Kwangju 2017q3 0.9688 0.9724 0.9964 0.9733 0.9778 0.9955 2017q4 0.9776 0.9812 0.9964 0.9944 0.9980 0.9963 2018q1 0.9640 0.9677 0.9962 0.9744 0.9767 0.9977 2018q2 0.9580 0.9616 0.9963 0.9833 0.9878 0.9954 2018q3 0.9638 0.9665 0.9973 1.0000 1.0000 1.0000 2018q4 0.9427 0.9442 0.9984 0.9896 0.9898 0.9998 2019q1 0.9410 0.9424 0.9985 0.9221 0.9229 0.9992 2019q2 0.9481 0.9495 0.9985 0.9409 0.9410 1.0000 2019q3 0.9481 0.9513 0.9966 0.9423 0.9444 0.9978 Kookmin 2017q3 0.9769 0.9788 0.9980 0.8763 1.0000 0.8763 2017q4 0.9795 0.9800 0.9994 0.8690 1.0000 0.8690 2018q1 0.9781 0.9781 1.0000 0.8686 1.0000 0.8686 2018q2 0.9905 0.9913 0.9992 0.9026 1.0000 0.9026 2018q3 1.0000 1.0000 1.0000 0.9152 1.0000 0.9152 2018q4 1.0000 1.0000 1.0000 0.8798 1.0000 0.8798 2019q1 0.9858 0.9926 0.9931 0.9043 0.9924 0.9113 2019q2 0.9794 0.9940 0.9853 0.9201 1.0000 0.9201 2019q3 0.9891 1.0000 0.9891 0.9266 1.0000 0.9266 Deagu 2017q3 0.9658 0.9672 0.9985 0.9560 0.9810 0.9745 2017q4 0.9608 0.9620 0.9987 0.9436 0.9728 0.9699 2018q1 0.9668 0.9683 0.9984 0.9501 0.9816 0.9679 2018q2 0.9700 0.9717 0.9983 0.9373 0.9601 0.9762 2018q3 0.9698 0.9715 0.9983 0.9532 0.9682 0.9845 2018q4 0.9762 0.9775 0.9987 0.9281 0.9449 0.9822 2019q1 0.9606 0.9617 0.9989 0.9001 0.9138 0.9850 2019q2 0.9657 0.9666 0.9991 0.9052 0.9186 0.9854 2019q3 0.9662 0.9666 0.9996 0.8865 0.9028 0.9819
Busan 2017q3 0.9866 0.9869 0.9997 1.0000 1.0000 1.0000 2017q4 0.9814 0.9816 0.9997 0.9361 0.9418 0.9940 2018q1 0.9768 0.9770 0.9998 0.9873 0.9914 0.9958 2018q2 0.9829 0.9831 0.9999 0.9731 0.9804 0.9926 2018q3 0.9887 0.9887 1.0000 0.9957 1.0000 0.9957 2018q4 0.9820 0.9825 0.9994 0.9193 0.9392 0.9788 2019q1 0.9771 0.9776 0.9995 0.9006 0.9164 0.9827 2019q2 0.9867 0.9872 0.9995 0.9014 0.9196 0.9803 2019q3 0.9831 0.9833 0.9998 0.8932 0.9153 0.9759 Shinhan 2017q3 0.9621 0.9623 0.9998 0.8627 0.9728 0.8868 2017q4 0.9713 0.9713 1.0000 0.8777 0.9731 0.9020 2018q1 0.9838 0.9839 0.9999 0.9114 0.9921 0.9186 2018q2 0.9863 0.9879 0.9984 0.9735 1.0000 0.9735 2018q3 0.9976 1.0000 0.9976 0.9204 1.0000 0.9204 2018q4 0.9973 1.0000 0.9973 0.9026 1.0000 0.9026 2019q1 0.9937 0.9938 0.9999 0.9289 0.9806 0.9473 2019q2 1.0000 1.0000 1.0000 0.9640 1.0000 0.9640 2019q3 1.0000 1.0000 1.0000 0.9491 0.9887 0.9599 Woori 2017q3 0.9522 0.9522 1.0000 0.8572 0.9479 0.9043 2017q4 0.9480 0.9481 0.9999 0.8868 0.9553 0.9282 2018q1 0.9512 0.9513 0.9999 0.8686 0.9634 0.9016 2018q2 0.9630 1.0000 0.9630 0.8920 0.9426 0.9463 2018q3 0.9666 0.9667 0.9999 0.8700 0.9462 0.9195 2018q4 0.9399 0.9445 0.9952 0.8439 0.9384 0.8993 2019q1 0.9483 0.9483 1.0000 0.8647 0.9243 0.9355 2019q2 0.9575 0.9576 1.0000 0.8821 0.9349 0.9436 2019q3 0.9704 0.9705 0.9999 0.8863 0.9271 0.9560 Jeonbuk 2017q3 0.9439 0.9506 0.9929 0.9202 0.9207 0.9994 2017q4 0.9703 0.9738 0.9964 0.9211 0.9227 0.9982 2018q1 0.9636 0.9704 0.9930 0.9570 0.9589 0.9980 2018q2 0.9699 0.9788 0.9909 0.9883 0.9908 0.9975 2018q3 1.0000 1.0000 1.0000 0.9965 1.0000 0.9965 2018q4 0.9843 0.9873 0.9970 0.9517 0.9532 0.9983 2019q1 0.9685 0.9713 0.9971 0.8947 0.8968 0.9977 2019q2 0.9915 0.9939 0.9976 0.9100 0.9107 0.9992 2019q3 0.9976 1.0000 0.9976 0.9227 0.9253 0.9972 Jeju 2017q3 0.9247 0.9563 0.9670 0.8963 1.0000 0.8963 2017q4 0.9561 0.9865 0.9691 0.7902 0.8574 0.9217 2018q1 0.9130 0.9434 0.9678 0.8692 0.9654 0.9003 2018q2 0.9629 0.9883 0.9743 0.8954 0.9879 0.9064 2018q3 0.9682 1.0000 0.9682 0.8829 0.9656 0.9144 2018q4 0.9641 0.9845 0.9792 0.8580 0.9272 0.9253 2019q1 0.9574 0.9782 0.9787 0.8167 0.8792 0.9289 2019q2 0.9702 0.9869 0.9831 0.8220 0.8830 0.9309 2019q3 0.9833 1.0000 0.9833 0.8214 0.8840 0.9292
K-bank 2017q3 0.8193 1.0000 0.8193 0.5499 1.0000 0.5499 2017q4 0.8497 1.0000 0.8497 0.5545 1.0000 0.5545 2018q1 0.8475 1.0000 0.8475 0.6393 1.0000 0.6393 2018q2 0.8441 1.0000 0.8441 0.6776 1.0000 0.6776 2018q3 0.8844 1.0000 0.8844 0.7022 1.0000 0.7022 2018q4 0.8509 0.9577 0.8885 0.7026 1.0000 0.7026 2019q1 0.6981 0.8377 0.8333 0.5254 0.6657 0.7891 2019q2 0.7704 0.9094 0.8472 0.5765 0.6913 0.8340 2019q3 0.7869 0.9508 0.8276 0.5833 0.6653 0.8767 Hana 2017q3 0.9565 0.9568 0.9997 0.8950 0.9685 0.9241 2017q4 0.9479 0.9479 0.9999 0.9905 1.0000 0.9905 2018q1 0.9608 0.9610 0.9998 0.9079 0.9481 0.9576 2018q2 0.9738 0.9740 0.9998 0.9911 1.0000 0.9911 2018q3 0.9986 0.9986 1.0000 0.9656 1.0000 0.9656 2018q4 0.9663 0.9663 1.0000 0.9560 0.9951 0.9607 2019q1 0.9735 0.9735 1.0000 0.9659 0.9868 0.9788 2019q2 0.9892 0.9892 1.0000 1.0000 1.0000 1.0000 2019q3 1.0000 1.0000 1.0000 1.0000 1.0000 1.0000 Standard chartered 2017q3 0.9068 0.9090 0.9975 0.6636 0.7833 0.8472 2017q4 0.8909 0.8928 0.9979 1.0000 1.0000 1.0000 2018q1 0.9023 0.9036 0.9986 0.7842 0.8934 0.8779 2018q2 0.8688 0.8704 0.9981 0.8708 0.8872 0.9815 2018q3 0.8777 0.8797 0.9978 0.6688 0.7163 0.9337 2018q4 0.8812 0.8822 0.9989 0.6843 0.7283 0.9396 2019q1 0.9524 0.9526 0.9998 0.7865 0.7914 0.9938 2019q2 0.9275 0.9285 0.9990 0.9735 0.9784 0.9950 2019q3 0.8838 0.8857 0.9978 1.0000 1.0000 1.0000 City bank 2017q3 0.9131 0.9135 0.9996 1.0000 1.0000 1.0000 2017q4 0.9681 0.9688 0.9992 1.0000 1.0000 1.0000 2018q1 1.0000 1.0000 1.0000 0.9437 0.9564 0.9867 2018q2 0.9955 0.9962 0.9993 0.9274 0.9678 0.9583 2018q3 0.9707 0.9715 0.9991 0.9124 0.9743 0.9364 2018q4 0.9936 0.9936 1.0000 0.9127 0.9765 0.9346 2019q1 1.0000 1.0000 1.0000 0.8820 0.9037 0.9760 2019q2 1.0000 1.0000 1.0000 1.0000 1.0000 1.0000 2019q3 1.0000 1.0000 1.0000 1.0000 1.0000 1.0000 Kakao bank 2017q3 2017q4 0.84800.9870 0.89661.0000 0.94590.9870 0.8730 1.0000 1.00001.0000 0.87301.0000 2018q1 0.9524 0.9813 0.9705 1.0000 1.0000 1.0000 2018q2 0.9739 1.0000 0.9739 0.9783 1.0000 0.9783 2018q3 1.0000 1.0000 1.0000 1.0000 1.0000 1.0000 2018q4 1.0000 1.0000 1.0000 1.0000 1.0000 1.0000 2019q1 0.8535 0.8703 0.9807 0.8956 0.9386 0.9542 2019q2 1.0000 1.0000 1.0000 0.9626 0.9670 0.9955 2019q3 1.0000 1.0000 1.0000 1 1 1