Feature Clustering based MIM for a New Feature Extraction
Method
S. El Ferchichi, S. Zidi, K. Laabidi, M. Ksouri, S. Maouche
Sabra El Ferchichi*
1. University of Tunis EL Manar National Engineering School of Tunis
Tunisia, BP 37, LE BELVEDERE 1002, TUNIS 2. Lille1 University, Science and Technology
France,Cité Scientifique, 59655 Villeneuve d’Ascq Cedex *Corresponding author: [email protected] Salah Zidi, Salah Maouche
Lille1 University, Science and Technology
France,Cité Scientifique, 59655 Villeneuve d’Ascq Cedex [email protected], [email protected] Kaouther Laabidi, Moufida Ksouri
University of Tunis EL Manar, National Engineering School of Tunis, Tunisia, BP 37, LE BELVEDERE 1002, TUNIS [email protected], moufi[email protected]
Abstract: In this paper, a new unsupervised Feature Extraction appoach is pre-sented, which is based on feature clustering algorithm. Applying a divisive clustering algorithm, the method search for a compression of the information contained in the original set of features. It investigates the use of Mutual Information Maximization (MIM) to find appropriate transformation of clusterde features. Experiments on UCI datasets show that the proposed method often outperforms conventional unsupervised methods PCA and ICA from the point of view of classification accuracy.
Keywords: feature extraction, Mutual Information Maximization (MIM), similarity measure, clustering.
1
Introduction
The capabilities of a classifier are ultimately limited by the quality of the features in each input vector. Using a large number of features can be wasteful of both computational and memory resources. Additionally, there are irrelevant and redundant features that complicate the learning process, and can lead to inaccurate prediction. Although those features may contain enough information about the output class, they can not predict the output label correctly because of the large dimension of the feature space and the reduced number of collected instances. It is important to note that for the classifier, it becomes more difficult to determine the inherent relation between the features and the class distribution [9]. This problem is commonly referred to as the curse of dimensionality [6].
A reduction of the feature space dimensionality is often necessary to alleviate this problem. To address this issue, two different approaches exist : Feature Selection which consists in selecting only the attributes which are relevant according to a pre-defined criterion [10]; And Feature Extraction which transforms the original set of feature and constructs a new one, more compact and more useful for the classification [20].
Feature Extraction methods like PCA [15], ICA [12] and Feature Selection methods, try either to find new statistically independent directions, or to eliminate totally the redundant features. An alternative approach is to gather the "similar" features into a much smaller number of feature-clusters, and use them to re-describe the data. Consequently, the potential information contained Copyright c⃝2006-2013 by CCC Publications
in these features could be preserved while the size of the feature space is reduced and good performances are maintained. The crucial step in such a procedure is the characterization of the "similarity" between features. Recently, the use of clustering has been investigated for the extraction of features. The applicability of this approach was proven in the case of text classification problems [17], [1] and protein sequences analysis [4]. For each application domain, a specific functional similarity measures was determined.
In this work, we develop a new unsupervised Feature Extraction method. It is based on the use of clustering technique combined with Mutual Information Maximization (MIM) to perform feature clustering. Our main interest is to reveal the underlying structure of the feature space without any prior information about probabilities density functions or class-distribution of the data.
Usually, in high dimensional space there are many features that have similar tendencies along the dataset. They describe similar variations of monotonicity (increasing or decreasing trend). Those features give a related discriminative information for the learning process. Hence, an analysis of the variations of the monotonicity of each feature vector along the dataset can lead us to determine a form of redundancy in the data. By using trend analysis, each feature will be totally described by its signature, which is statistically distinguished from random behavior. Intuitively, once the groups of similar features have been settled, feature extraction can be realized through a linear or nonlinear transformation that will determine a representative feature for each feature-cluster. In the same time, the extraction has to preserve the main characteristics of each feature-cluster and to incorporate them into the new representative feature. Therefore, each feature has to be highly correlated with its corresponding group center. To satisfy this objective a reliable measure of dependency between each feature-cluster, its corresponding centroid and a search strategy are needed. Within this context, MI is a suitable dependency measure [19] for our problem: it quantifies the amount of information that the center carries about the feature-cluster. It can detect either a linear or a nonlinear relationship between two random variables [18], [16]. MI measure was exploited in feature extraction and selection method but in a supervised fashion [11], [20], [13] and [2].
In section 2, Feature Extraction based Clustering Method (FEMC) is briefly reviewed. In section 3, we focus on the formulation of the feature-cluster transformation, based on MI maximization (MIM). In section 4, the performances of the proposed Feature Extraction based Clustering Method (FEMC) is analyzed and discussed through multiple classification problems. In section 5, we offer some conclusions and suggestions for future work.
2
Feature Extraction Method based Clustering
The feature extraction method FEMC was recently proposed by [7] for pattern classification problems. It aims to obtain more generalization capabilities than existing methods. It performs feature extraction without presuming any knowledge about data structure or about instances’ classes [7]. As we stated before, features that behave the same along the data may contain the same information. Grouping those features and transforming them garantee there is no loss of information, better classification accuracy and reduced dimension. Hence, we focus on identifying "similar" features in their tendencies along the dataset. The analysis of features monotonocity reveals a form of redundancy between these features.
Clustering technique was used to identify complex relationships between features and to discover the inherent data structure [8], [21]. A k-means algorithm based on a new similarity measure was permormed.
Analyzing the tendency of feature vectors was proposed to identify the similarity between them. This new measure was designed to overcome the limitations of Euclidean distance, usually used
in clustering algorithms.
In fact, a trend is a semi-quantitative information, describing the evolution of the qualitative state of a variable in a time interval, by using a set of symbols such as {increasing, decreasing, steady} [5]. It was used with success for process monitoring and diagnosis [5].
The procedure of feature extrcation proposed in [7] start by computing the first order derivative of a feature vector is and fixing its sign (0,1 or −1), at each point sample. After coding each trend, the difference of the tendency between each two vectors is computed. The distance is expressed as the squared root of the sum of the absolute difference between the occurrences of a specified value of a trend for two feature vectors. This was inspired from the Value Difference Metric (VDM) [14]. Thus, the location of a feature vector within the feature space is not defined directly by the values of its components, but by the conditional distributions of the extracted trend in each component. Furthermore, the similarity measure is not affected by the ordering of samples.
3
MIM for Feature Extraction based on Clustering
We consider {x1, x2, ..., xL} the D-dimensional original dataset composed ofD features vj each. A clustering technique is perforrmed on the feature space to construct d < D feature-clusters. We have to define an appropriate transformation for each feature-cluster in order to obtain a representative features gk, defined by the equation 1:
gk=f(Ck) = nk ∑ h=1 L ∑ i=1 wivh, (1)
Where,Ck is the cluster composed of nk feature vectorsvh. wi is the weight attributed to each component of the feature vector vh. The transform wi has to preserve any linear or nonlinear dependency between features in vh ∈Cj and their centroid gj.
MI is an appropriate measure of dependency, so the optimal transform W∗ has to maximize the MI between {Vj, gj}. Vj is the matrix containing the nk feature vectors belonging to a cluster
Ck. W is the vector containing the nk weightswi. 3.1 Mutual Information
Information theory provides the possibility to measure the information with MI [9], [20]. Let p(x)and p(y) be the probability density function (pdf) for random vectorX andY, andp(x, y)
the joint pdf. The MI between the discrete random vectorsX andY is defined as: I(x, y) =∑ x∈X ∑ y∈Y p(x, y)log p(x, y) p(x)p(y). (2)
WhereX andY are the corresponding alphabets of X and Y.
If the MI between the two random vectors is large then, the two vectors are closely related. If the MI becomes zero then, the two random vectors are independent. MI for continuous random variables are defined as follows:
I(X, Y) =− ∫ ∫
p(x, y)log p(x, y)
p(x)p(y)dxdy . (3)
The determination of the pdfs(p(x, y), p(x), p(y))and the performance of the integrations is very complicated. Consequently, the continuous input feature space is divided into several discrete
partitions. MI is then calculated using its expression for the discrete random variables. The inherent error that exists in the quantization process poses a problem. The Parzen window method is then used to estimate the pdfs of continuous random variables [19].
The method places a kernel function on top of each sample and evaluate the density as a sum of the kernels.
Given a data of n N-dimensional training vectors {x1, .., xn}, the pdf estimated by the Parzen window method is expressed by:
ˆ p(x) = 1 n n ∑ i=1 Φ(x−xi, σI). (4)
whereΦ(.) is the Gaussian window function given by
Φ(x,Σ) = 1 (2π)N2|Σ| 1 2 exp(−1 2x TΣ−1x) (5)
whereΣis a covariance matrix of an N-dimensional random vector Z.
Quadratic Mutual Information: when the aim is not to compute an accurate value of the entropy of a particular distribution, but rather to find a distribution that maximizes or minimizes the entropy given some constraints, a large number of alternative entropy measures are produced [19].
One of these is the following continuous density: D(f, g) =
∫
x(f(x)−g(x))αdx . (6) Since MI is expressed as the divergence between the joint density and the product of the marginal, we can insert this into the relation (6) and this way, the quadratic MI measure between two continuous variables X1 and X2 can be derived:
I(X1, X2) = ∫ ∫
(p(x1, x2)−p(x1)p(x2))2dx1dx2. (7)
3.2 Problem Formulation
As we stated before, our objective is to realize an appropriate transformation on each feature-cluster. Each clusters’center is usually computed as the bary-center derived by the equation (1); whereWj =1n1j.
We look for a more appropriate transformationW∗, since the center is the representative feature of its cluster and it will be used as a new feature.
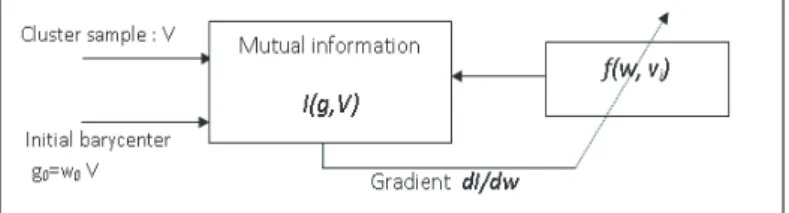
Since our objectif is to maximize the MI between each cluster Cj and its corresponding center
gj, we define the transformation f to apply on each feature vector vi ∈ Cj, by gij = f(w, vi), which maximizes I(gj, Vj) (MI betweenvi ∈Cj and gj) as described in figure 1.
By using(7) we obtain:
I(gj, Vj) =
∫ ∫
(p(gj, v)−p(gj)p(v))2dgjdv . (8) We have to developp(gj, v) to be able to compute (8).
Figure 1: Feature Extraction procedure Sf inal=Vj∪ {gj}.
p(gj, v) will be expressed by:
p(gj, v) =p(gj)p(gj/v) =p(gj)(p(v)−p(gj)). (9) We insert (9) in equation (8) and we get:
I(gj, Vj) =
∫ ∫
p(gj)4dgjdv . (10) We have used the Parzen window estimator to determinep(gj). By using the equation (5) for the obtained set constituted of nj+ 1 featuresSf =Vj∪ {gj}, the densityp(gj, v) can be expressed by: p(gj, v) = 1 n+ 1 n+1 ∑ i=1 Φ(gj−vj, σI). (11) We know that ∫ZcNx(µc,Σc)dx=Zc. Henceforth, the MI becomes:
I(g, V) = ∫ g ∫ v n∑+1 i=1 n+1 ∑ j=1 n+1 ∑ k=1 n∑+1 l=1 ∏ s=1 4Φg(µs,Σs)dgdv (12) = ∫ g ∫ v n∑+1 i=1 n+1 ∑ j=1 n+1 ∑ k=1 n∑+1 l=1 zΦg(µ,Σ)dgdv (13) = ∫ v n+1 ∑ i=1 n∑+1 j=1 n+1 ∑ k=1 n+1 ∑ l=1 zdv . (14) Where z= |2πΣd| 1 2 ∏4 s=1|2πΣd| 1 2 ∏ a<b exp(−1 2(µa−µb) TB ab(µa−µb)), Σd= ( ∑ s=1 4Σ−s1)−1, Σs=σ2I, Bab= Σ−s1ΣdΣ−s1
In figure 1, we have to maximize the MI I(g, v) to identify the optimal W∗ and to determine cluster centerg. We have used the gradient descent algorithm to find the solution which involves differentiating I(g, v): dI dw = dI dg dg dw = dI dgV . (15)
Table 1: Classification accuracy on Sonar Dataset
.
No. of features Classification accuracy (SVM)
PCA ICA FEMC (without MI) FEMC (with MI)
1 58.6 67.2 60.60 65.94 3 54.7 69.7 71.68 75.05 6 63.0 70.2 77.39 77.89 9 70.2 68.7 82.38 82.32 12 75.1 71.7 85.02 81.40 60 82.7
Table 2: Classification accuracy on Pima Dataset
.
No. of features Classification accuracy (SVM)
PCA ICA FEMC (without MI) FEMC(with MI)
1 66.3 73.2 68.08 67.80 2 75.1 76.7 69.72 69.85 3 75.5 76.8 75.72 75.72 5 75.5 77.2 76.80 82.32 60 78.0
4
Experimental Results
In this section, we have conducted FEMC (with and without using MI) for different bench-mark datasets from UCI machine learning repository [3]. We have compared the FEMC perfor-mances with conventional unsupervised Feature Extraction methods PCA and ICA for different extracted features. We have used SVM (given in Matlab toolbox) for binary classification task, the used kernel function is Gaussian kernel and the parameter σ is set after various tests. The K Nearest Neighbors (KNN) classifier is used for the multi-classification problem.
Sonar Dataset. We have used13 fold cross-validation in experiments, as presented in [13]. For SVM parameters, we have setσ = 1. The Table 1 shows classification accuracy for different number of extracted features. The performances of FEMC are far better than PCA and ICA except for the case when the dimension is 1, and ICA outperforms the others. Since the concept of our approach is to form groups of similar features; extracting a very low number of features means gathering all features in a few numbers of clusters. This could be delicate for some datasets. We note also that in the case of dimension 9 and 12, FEMC can get nearly by the initial accuracy rate of 82% which is far better than ICA and PCA. By using MI, FEMC reaches much better accuracy, especially for the case of dimension1, where it gets almost the same accuracy as ICA. Hence, MI increases the FEMC accuracy in the lower dimension like 1 and 3.
Pima Indian Diabetes Dataset. We have applied PCA, ICA and FEMC for comparison. A 10-fold cross strategy was used and σ = 10. Results are shown in Table 2. We can note that the classification accuracy of PCA and ICA becomes closer as the number of extracted features becomes larger. FEMC performs better than PCA and approaches the ICA accuracy for the dimensions: 3 and 5. But ICA still outperforms both PCA and FEMC for different numbers of features especially for the lower ones (dimension 1and 2). By using MI, the accuracy of FEMC has increased especially for the case of the dimension 5, where it outperforms PCA, ICA and surpasses the initial accuracy (78%) by getting 82.32%.
Table 3: Classification accuracy on Breast Cancer Dataset
.
No. of features Classification accuracy (SVM)
PCA ICA FEMC (without MI) FEMC(with MI)
1 85.8 85.1 96.72 96.86
2 94.7 90.3 96.57 96.71
3 95.9 91.3 94.71 94.28
6 96.6 94.3 85.11 85.11
9 96.6
Table 4: Classification accuracy on Ionosphere Dataset
.
No. of features Classification accuracy (SVM)
PCA ICA FEMC(without MI) FEMC(with MI)
1 64.07 61.28 72.09 76.09 3 85.21 81.80 75.20 83.50 6 84.79 86.05 85.21 85.49 9 84.83 86.52 87.52 87.80 12 86.31 88.04 89.20 89.20 34 91.73
Breast Cancer Dataset. A 10-fold cross-validation was used and σ = 0.01. Results of comparison are shown in Table 3. With only one extracted feature, FEMC can get the maximum classification accuracy (96.86%). So, for a larger number of extracted features, PCA outperforms both ICA and FEMC and gets the maximum classification accuracy with6features. In this case, MI slightly ameliorates FEMC performances.
Ionosphere Dataset. We have used a 10 fold cross-validation and σ = 0.01. The results of the comparison are shown in Table 4. With only one extracted feature, FEMC outperforms ICA and PCA. For larger numbers of extracted features, FEMC gets either similar or better performance than PCA and ICA, and achieves the best classification accuracy with12 features. In lower dimension, FEMC with MI reaches higher accuracy of 76.09% (better than PCA and ICA) especially in dimension 1.
Wine Dataset. We have used a 10-fold cross validation strategy and the K-nearest-neighbors (KNN) classifier to conduct classification task. The classification results for each Feature Extrac-tion method are summarized in Table 5. We must underline that the FEMC performances are far better than ICA and PCA for low dimensions. Although for the dimension 2 ICA outperforms FEMC, for larger dimension FEMC achieves the best classification accuracy and approaches the initial one of 80.27%. By using MI, FEMC can reache better accuracy especially for the dimension 3 where it gets 81.49% (better than the initial one).
5
Conclusion
This paper deals with the important problem of extracting relevant features for pattern classi-fication. Often, Feature Extraction techniques trust in some robust criterion to search for a lower dimensional representation. However, the true structure of the data is unknown, it is inherently ambiguous what constitutes a good low dimensional representation. This makes it difficult to define an appropriate criterion. We suggest a new Feature Extraction approach incorporating the idea of feature clustering. Similar features are recognized through analyzing their tendencies along the data set and a new similarity measure is then devised. The proposed approach FEMC
Table 5: Classification accuracy on Wine Dataset
.
No. of features Classification accuracy (SVM)
PCA ICA FEMC(without MI) FEMC(with MI)
1 67.93 67.42 71.02 71.88
2 71.94 73.84 72.36 76.25
3 72.48 75.22 78.19 81.49
5 75.74 91.01 79.92 80.45
13 80.27
applies clustering technique, based on the new similarity measure, into feature space to determine its underlying groups of features. An MIM schema is used to find an optimal transformation of features in each obtained cluster to compute corresponding centers. The obtained set of centers represents the extracted features used to characterize the patterns.
The performances of FEMC method have been assessed through several datasets obtained from the UCI machine learning repository. The complexity of the relationships nature between fea-tures increases as the dimension gets lower. The MI can effectively identify this relationship due to its powerful background. In this work, we can clearly notice that by using MIM to construct a new set of features, FEMC have remarkably increased the classifier accuracy especially in lower dimension case. More, this method manage to offer a better accuracy classification than ICA and PCA in almost cases. The main problem that would occur is time complexity in estimating and optimizing MI between features for bigger datasets. As the optimization schema of MI is done separably for each cluster, a multi-agent approach can be useful to tackle this problem. The greedy algorithm used in this work can be also replaced by a stochastic one.
Bibliography
[1] Baker, L.D. and McCallum, A.K.; Distributional clustering of words for text classification, Proc. 21st Ann. Int. ACM SIGIR Conf. on Research and Development in Information Re-trieval, 1998.
[2] Battiti R.; Using Mutual Information for Selecting Features in Supervised Neural Net Learn-ing,IEEE Trans. on Neural networks, 5: 537-550, 1994.
[3] Blake, C.L. and Merz C.J.; UCI repository of machine learning databases, http://archive.ics.uci.edu/ml/, Department of Information and Computer Science, University of California, Irvine, CA, 1998.
[4] Bonet, I., Saeys, Y., Grau Abalo, R., García, M., Sanchez, R. and Van de Peer, Y. (2006); Feature extraction using clustering of protein, Proc. 11th Iberoamerican Congress in Pattern Recognition CIARP, eds. Springer, LNCS 4225, 614-623, 2006.
[5] Charbonnier, S. and Gentil, S.; A trend-based alarm system to improve patient monitor-ing in intensive care units, Control Engineering Practice, 15:1039-1050, eds. Eds. Elsevier, Kidlington, ROYAUME-UNI, 2007.
[6] Cherkassky, V. and Mulier, F.;Learning from data: concepts, theory and methods, chapter 5, eds.John Wiley & Sons, 1998.
[7] EL Ferchichi, S., Zidi, S., Laabidi, K., Ksouri, M. and Maouche, S.; A new feature extraction method based on clustering for face recognition ,” Proc. 12th Engineering Applications of Neural Networks, eds. Springer, IFIP 363, 247-253, 2011.
[8] Fern, X.Z. and Brodley, C.E.; Cluster Ensembles for High Dimensional Clustering: an empirical study, Technical report, CS06-30-02, 2004.
[9] Fisher, J.W., Principe, J.C.; A methodology for information theoretic feature extraction, Proc. 17th Int’l Joint Conf. on Neural Networks, 1998.
[10] Guyon, I. , Elisseef, A.; An introduction to variable and feature selection,Journal of Machine Learning Research, 3: 1157-1182, 2003.
[11] Hild II, K.E., Erdogmus, D., Torkkola, K., and Principe, J.C.; Feature extraction using information-theoritic learning, IEEE Trans. on Pattern Analysis and Machine Intelligence, 28, 2006.
[12] Kwak, N., and Choi, C.; Feature extraction based on ICA for binary classification problems, IEEE Trans. on Knowledge and Data Engineering, 15: 1387-1388, 2003.
[13] Kwak, N., Feature selection and extraction based on mutual information for classification; Ph.D Thesis, Seoul National Univ., Seoul, Korea, 2003.
[14] Payne, T.R. and Edwards, P.; Implicit feature selection with the value difference metric, Proc. 13th European Conf. on Artificial Intelligence, 1998.
[15] Saul, L.K., Weinberger, K.Q., Sha, F., Ham, J. and Lee, D.D.;Spectral Methods for Dimen-sionality Reduction,Semi supervised Learning, eds. MIT Press Cambridge, MA, 2006. [16] Schaffernicht, E., Kaltenhaeuser, R.; On estimating mutual information for feature selection,
Proc. 17th Int’l Conf. on Artificial Neural Networks, eds. Springer, LNCS 6352, 362-367, 2010. [17] Slonim, N. and Tishby, N.; The power of word clusters for text classification, Proc. 23rd
European Colloquim on Information Retrieval Research, 2001.
[18] Suzuki, T., Sugiyama, M., and Kanamori, T.; A Least-squares Approach to Mutual Infor-mation EstiInfor-mation with Application in Variable Selection,JMLR 17th 3rd Workshop on New Challenges for Feature Selection in Data mining and Knowledge Discovery (FSDM 2008), 2008.
[19] Torkkola, K. and Campbell, W.M.; Mutual information in learning feature transformations, Proc. 17th Int’l Conf. on Machine Learning, 2000.
[20] Torkkola, K., Feature extraction by non-parametric mutual information maximization, Jour-nal of Machine Learning Research, 3: 1415-1438, 2003.
[21] Von Luxburg, U., Bubeck, S., Jegelka, S. and Kaufmann, M.; Consistent minimization of clustering objective functions,Neural Information Processing Systems NIPS, 2007.