Fuzzy clustering-based feature extraction method for mental task
classification
Akshansh Gupta.Dhirendra Kumar
Received: 3 May 2016 / Accepted: 22 August 2016 / Published online: 3 September 2016 The Author(s) 2016. This article is published with open access at Springerlink.com
Abstract A brain computer interface (BCI) is a communi-cation system by which a person can send messages or requests for basic necessities without using peripheral nerves and muscles. Response to mental task-based BCI is one of the privileged areas of investigation. Electroencephalography (EEG) signals are used to represent the brain activities in the BCI domain. For any mental task classification model, the performance of the learning model depends on the extraction of features from EEG signal. In literature, wavelet transform and empirical mode decomposition are two popular feature extraction methods used to analyze a signal having non-linear and non-stationary property. By adopting the virtue of both techniques, a theoretical adaptive filter-based method to decompose non-linear and non-stationary signal has been proposed known as empirical wavelet transform (EWT) in recent past. EWT does not work well for the signals having overlapped in frequency and time domain and failed to provide good features for further classification. In this work, Fuzzy c-means algorithm is utilized along with EWT to handle this problem. It has been observed from the experi-mental results that EWT along with fuzzy clustering out-performs in comparison to EWT for the EEG-based response to mental task problem. Further, in case of mental task classification, the ratio of samples to features is very small. To handle the problem of small ratio of samples to features, in this paper, we have also utilized three well-known
multivariate feature selection methods viz. Bhattacharyya distance (BD), ratio of scatter matrices (SR), and linear regression (LR). The results of experiment demonstrate that the performance of mental task classification has improved considerably by aforesaid methods. Ranking method and Friedman’s statistical test are also performed to rank and compare different combinations of feature extraction meth-ods and feature selection methmeth-ods which endorse the efficacy of the proposed approach.
Keywords Brain computer interfaceMental tasks classification Feature extractionEmpirical wavelet transform Fuzzy C-means clusteringFeature selection
1 Introduction
Brain computer interface (BCI) is a communication system by which a person can send messages or request for basic necessities via his or her brain signals without using peripheral nerves and muscles [1]. It is one of the areas which has contributed to the development of neuron-based techniques to provide solutions for disease prediction, communication, and control [2–4]. Three acquisition modalities have been discussed in the literature [5,6], viz, invasive (microelectrode array), semi-invasive [electro-corticography (ECoG)], and non-invasive (EEG) for cap-turing signals corresponding to brain activities. EEG is a widely preferred technique to capture brain activity for BCI system [7,4] as its ability to record brain signals in a non-surgical manner leading to low cost. Response to mental tasksis one of the BCI systems [8], which is found to be more pragmatic for locomotive patients. This system is based on the assumption that different mental activities lead to typical, distinguishable and task-specific patterns of
A. Gupta (&)
School of Computational and Integrative Sciences, Jawaharlal Nehru University, New Delhi 110067, India
e-mail: [email protected]
D. Kumar
School of Computer and Systems Sciences, Jawaharlal Nehru University, New Delhi 110067, India
EEG signal. The success of this BCI system depends on the classification accuracy of brain signals. Extraction of rel-evant and distinct features from EEG signal associated with different mental tasks is necessary to develop an efficient classification model.
In the literature, a number of analytic approaches have been employed by the BCI community for better repre-sentation of EEG signal such as band power [9], ampli-tude values of EEG signals [10], power spectral density
(PSD) [11–13], autoregressive (AR), and adaptive
autoregressive (AAR) parameters [14]. However, the
primary issue with AR modeling is that the accuracy of the spectral estimate is highly dependent on the selected model order. An insufficient model order tends to blur the spectrum, whereas an overly large order may create arti-ficial peaks in the spectrum. In fact, the frequency spec-trum of the EEG signal is observed to vary over time, indicating that the EEG signal is a non-stationary signal. As a consequence, such a feature extraction method should be chosen which can model the non-stationary effect in the signal for better representation.
The wavelet transform (WT) [15, 16] is an effective technique that can be used to analyze both time and fre-quency contents of the signal. However, WT uses some fixed basis mother wavelets, independent of the processed signal, which makes it non-adaptive. Another successful method for feature extraction, empirical mode decompo-sition (EMD) [17], represents the non-linear and non-sta-tionary signal in terms of modes that correspond to the underlying signal. EMD is a data-driven approach that does not use a fixed set of basis functions, but is self-adaptive according to the processed signal. It decomposes a signal into finite, well-defined, low-frequency and high-frequency components known as intrinsic mode functions (IMFs) or modes.
Due to multi-channel nature of EEG data, the dimen-sionality of extracted features is very large but the avail-able number of samples per class is usually small in such application. Hence, it suffers from curse-of-dimensionality problem [18], which also leads peaking phenomena in the phase of designing classifier [19]. To overcome this prob-lem, dimensionality reduction using feature selection is suggested in the literature [20].
In this paper, a two-phase approach has been used to determine a reduced set of relevant and non-redundant features to solve the above-mentioned issues. In the first phase, features in terms of eight different parameters are extracted from the decomposed EEG signal using empirical wavelet transform (EWT) or the proposed FEWT. In the second phase, the multivariate filter feature selection
approach is employed to select a set of relevant and non-redundant features. To investigate the performance of dif-ferent combinations of the two feature extraction and multivariate feature selection methods, experiments are performed on a publicly available EEG data [4].
The rest of the paper is organized as follows: The EWT have been discussed briefly in Sect. 2. The proposed fea-ture extraction technique for mental task classification and Fuzzy c-means (FCM) algorithm have been discussed in Sect.3. Multivariate feature selection methods are included in Sect.4. Description of experimental setup and results are discussed in Sect. 5. Finally, Sect. 6 includes conclusions and future work.
2 Empirical wavelet transform
The nature of the EEG is non-linear and non-stationary [21]. To deal this nature of the EEG signal, in recent past, a fixed basis function based on the WT [22, 23] and an adaptive filter-based EMD methods have been applied [24,25]. The major concern of EMD method is the lack of mathematical theory [26]. Combining properties of these two methods, recently Gilles [26] has proposed a new adaptive basis transform called EWT to extract the mode of amplitude-modulated–frequency-modulated (AM-FM) signal. The method to build a family of adaptive (empiri-cal) wavelets of the signal to be processed is the same as the formation of a set of bandpass filters in Fourier spec-trum. The idea to achieve the adaptability is the depen-dency of filter’s supports on the location of the information in the spectrum of the signal [26].
Let x denote the frequency, which belongs to a
seg-mented of N continuous segment, Fourier support, ½o;p.
Further xn denotes the limit between each segment
(x0¼0 andxN ¼pÞandKn¼½xn1;xn denotes a
seg-ment such thatSNn¼1Kn¼½0;p. It is assumed that the each
segment having a transition phase, which is centered aroundxn, of width 2sn in research work of Gilles [26].
The empirical wavelet can be define as a bandpass filter for eachKnby utilizing idea of both Littlewood-Paley amd
Meyer’s wavelets [15]. The empirical scaling function can be defined as
^
/nðxÞ ¼
1 ifjxj xnsn
cos p 2b
1 2sn
ðjxj xnsnÞ
ifxnsn jxj xnþsn
0 otherwise
8 > > < > > :
ð1Þ
The EWT of signal f(t), Wfeðn;tÞ, is defined the same as classic WT [26]. The detail coefficient is defined as
Wfeðn;tÞ ¼ hf;wni ¼
Z
fðsÞwnðstÞds ð3Þ
Wfeðn;tÞ ¼ hf;wni ¼ bfðxÞwnðxÞ
_
; ð4Þ
wherehidenotes inner product. Similarly, the approxima-tion coefficient is defined as
Wfeð0;tÞ ¼ hf;/1i ¼ Z
fðsÞ/1ðstÞds ð5Þ
Wfeð0;tÞ ¼ hf;/1i ¼ bfðxÞ/1ðxÞ
_
: ð6Þ
The reconstruction of the signalf(t) can be obtained as
fðtÞ ¼Wfeð0;tÞH/1ðtÞ þXWfeðn;tÞHwnðtÞ ð7Þ
fðtÞ ¼ Wcfeð0;xÞ/1ðxÞ þXWcfeðn;xÞwnðxÞ
_
: ð8Þ
3 Proposed feature extraction approach
Although EWT has been proposed by Gilles [26] for
building adaptive wavelet to represent the signal to be processed, the author, however, has mentioned that the proposed method might fail to decompose properly when the input signal, like EEG signal (due to nature of multiple channels), compose of more than one chirp which overlaps in both time and frequency domain. As the performance of the classification model is highly dependent on the extracted features, features obtained using EWT from EEG signals are not suitable to produce an efficient classification model due to the problem mentioned above. Keeping this point into consideration, a very familiar fuzzy clustering method has been employed in this paper. The proposed method is able to deal with the problem of EWT by re-assigning the extracted features from EWT to the more similar type of segment using FCM algorithm. And this final processed signal will be able to produce good clas-sification model. The brief description of FCM is given in the next subsection.
3.1 Fuzzy C-means
Fuzzy C-means algorithm [27] is a clustering technique based on fuzzy set theory. Basically, fuzzy set theory is developed by Zadeh [28] and is viewed in different pro-spects by some researchers such as Nguyen [29] and Tiwari and Srivastava [30]. The core idea of FCM is that one object can belong in more than one cluster on the basis of fuzzy membership value ( 0½ ;1) rather than on the ground of crisp value (f0;1g) as in k-means algorithm. The non-linear optimization problem for FCM can be given as
MinAmðU;V;X¼P p j¼1
Pc i¼1ðuijÞ
m
d2ðx
j;viÞÞ
suchthat Pci¼1uij¼1; 1jp 0uij1; 1jp; 1ic
0Pcj¼1uij\p; 8i
8 > > > > < > > > > : ; ð9Þ
where X¼ ðx1;x2; :::;xpÞ are p objects, cð1\c\pÞ is
number of the clusters, and mð1\m\1Þ is fuzzifier constant. uij is the degree value of membership of jth
object to belong in ith cluster. U¼ ðuijÞcp and V are
fuzzy partition and centroid matrix, respectively. Further, d2ðx
j;viÞdenotes the Euclidean distance betweenjth object
andith centroid.
The updation of the fuzzy membership value of the given object afterkiteration is given as
uijðkÞ ¼
1 Pc
r¼1
dðxj;viðkÞÞ
dðxj;vrðkÞÞ
2
m1: ð10Þ
Similarly, the centroid point can be updated as
viðkþ1Þ ¼
Pp j¼1u
m ijðkÞxj
Pp j¼1umijðkÞ
where 1ic: ð11Þ
3.2 Feature coding
The proposed approach of extracting features from EEG signal is carried out in three steps. In the first step, the decomposition of the signal into desire number of support (segment) through the EWT is made. FCM clustering algorithm is employed in the second step of the proposed approach to avoid overlapping segments obtained from the
^ wnðxÞ ¼
1 if xnþsn jxj xnþ1snþ1
cos p
2b 1 2snþ1
ðjxj xnþ1snþ1Þ
if xnþ1snþ1 jxj xnþ1þsnþ1
sin p 2b
1 2sn
ðjxj xnsnÞ
if xnsn jxj xnþsn
first step. To represent each segment more compactly, eight statistical or uncertainty parameters (root mean square, Lempel–Ziv complexity measure [31], shannon entropy, central frequency, maximum frequency, variance, skew-ness, and kurtosis) have been calculated in the third or final step of the proposed technique as every signal or data have the distinguishable property in terms of a set of statistical parameters associated with the signal or data. It may be possible that the two signals have same value associated with one or more statistical parameter. In this work, these eight parameters are selected empirically.
4 Feature selection
The feature vector from each channel obtained encloses all the features constructed with the above statistical parame-ters. The final feature vector obtained after concatenation of features from six channels is large, i.e., each feature vector
contains 144 parameters (3 EWT segments8
parame-ters6 channels). Hence, feature selection is carried out to exclude noisy, irrelevant, and redundant features.
Two major categories of feature selection methods are the filter method and the wrapper method. In filter method, the relevance of features is determined on the basis of inherent properties such as distance, consistency, and cor-relation without involving any classifier. Hence, it may not choose the most relevant feature set for the learning algo-rithm. Alternatively, the wrapper method [32] has a ten-dency to find relevant features subset, better suited to a given learning algorithm. However, wrapper method is computationally more costly since the classifier needs to be learned for each feature subset separately. On the other hand, filter feature selection method is computationally less intensive and bias free. Filter methods have a simple structure with straightforward search strategy like forward selection, backward selection, or the combination of both. Filter approach is further classified into two categories [20] as univariate (ranking) and multivariate (feature sub-set). A scoring function is used by feature ranking method for measuring the relevance of each feature individually. These methods are simple to compute. The research works have used univariate filter method in the BCI field [33–36]. It is noted that the reduced relevant features obtained from using univariate methods significantly improves the clas-sification accuracy. But it ignores the correlation among the features. Hence, the selected feature subset may have high redundancy among features and may not provide high discriminatory capacity.
In the wrapper approach [37,38], the seminal work of Keirn and Aunon [4] has used a combination of forward sequential feature selection and an exhaustive search to
obtain a subset of relevant and non-redundant features for the mental task classification. However, wrapper approach is not suitable for high-dimensional data as it is computa-tionally expensive.
On the other hand, efficient time multivariate filter method finds features which are relevant to the class and non-redundant among themselves. Thus, it overcomes the limitations of both univariate and wrapper approaches. Thus, we have preferred most widely used multivariate filter feature selection methods namely Bhattacharya dis-tance measure [39], ratio of scatter matrices [40], and LR [41] for selecting relevant and non-redundant features. Brief discussion of these techniques is given below.
4.1 Bhattacharyya distance
In the literature, BD is used as a dissimilarity measure between two probability distributions. It is a special case of Chernoff distance which measures the overlap between samples of two different probability distributions. For multivariate normal probability distribution, Chernoff dis-tance measure is given as [42]
Jc¼
1
2bð1bÞðl2l1Þ
T
½ð1bÞR1þbR21ðl2l1Þ
þ1 2log
ð1bÞR1þbR2
j j
R1
j j1bjR2jb
ð12Þ
whereliandRiare mean vector and covariance matrix for
classCi;respectively(i=1, 2).
When b = 1
2 then this distance is known as BD [39], which is given as
JB¼
1
8ðl2l1Þ
T R1þR2 2
1
ðl2l1Þ þ 1 2log
R1þR2
2
R1 j j12jR2j
1 2 :
ð13Þ
However, it suffers from the problem of singularity when the determinant of covariance for a given class takes zero value.
4.2 Ratio of scatter matrices
In the literature, a simple measure based on the scattered-ness of features in high-dimensional space is recom-mended, which is a ratio of the trace of the SR. The measure selects those relevant features which are well clustered around their class mean and the means of two different classes of data are well separated. The SR, within-class scatter matrices, Sw, and between class SR, Sb, are
defined as
Sw¼
Xc
i¼1
PiE½ðxliÞ T
Sb¼
Xc
i¼1
Piðlil0Þ
T
ðlil0Þ; ð15Þ
whereli,Pi;andl0are mean vector ofith class data, prior probability of ith class data, and global mean of data samples, respectively.
From the definitions of SR, the criterion value, which is to be maximized, is given as
JSR¼
traceðSbÞ
traceðSwÞ
: ð16Þ
JSRtakes high value when the inter-cluster distance is large and intra-cluster distance is small. The main advantage of this criterion is that it is independent of external parameters and assumptions of any probability density function. The measure JSR also has the advantage of being invariant under linear transformation.
4.3 Linear regression
Regression analysis is another well-established statistical method suggested in the literature that investigates the causal effect of independent variable upon dependent variable. The class label is used as the dependent variable (target), and the features that affect this objective are sought. The LR method attempts to find the linear relationship between a response variable and two or more explanatory variables by substi-tuting a linear equation to the observed data. Since many features can affect the class, therefore multiple regression model is more appropriate. A multiple regression model with kindependent variablesf1;f2;. . .;fkand a target variableyis
given by Park et al. [41]:
yi¼b0þb1fi1þ þbkfikþfi;i¼1;2;. . .;n; ð17Þ
whereb0;b1;. . .;bk are constants estimated by class label
y and observed values of X. The sum of squared error
(SSE) which is sum of the squared residuals is given by
SSE¼X
n
i¼1 ðyiy
p iÞ
2
; ð18Þ
whereyi and ypi are target and predicated values,
respec-tively. The smaller value of SSE shows better regression model. The total sum of squares (SSTO) is given by
SSTO¼X
n
i¼1
ðyiyÞ2; ð19Þ
whereyis the average value ofyi;i¼1;2;. . .;n. The
cri-terion valueJLR is given as
JLR¼1 SSE
SSTO: ð20Þ
The value ofJLRlies between 0 and 1. It considers a linear relationship between data and class labels. In a linear
regression analysis, the feature for which the value ofJLR is higher is selected.
5 Experimental setup and results
5.1 Dataset
For our experiment, we have used publicly available data for mental task classification (Keirn and Aunon, 1990). The original EEG dataset consists of recordings from seven subjects, but we utilized data from all subjects except subject-4 due to some missing information. Each subject performed five different mental tasks: the baseline task (B)(no task); the mental letter composing task (L); the non-trivial mathematical task (M); the visualizing counting of numbers written on a blackboard task (C); and the geo-metric figure rotation task (R). Each of the recording ses-sion consists of five trials of each of the five mental tasks. EEG recording was taken from six electrodes placed on the scalp at C3, C4, P3, P4, O1, and O2 referencing to two electrodes placed at electrically linked mastoid, A1, and A2, as shown in Fig. 1.
Each trial is of 10 s duration recorded with a sampling frequency of 250 Hz, which resulted into 2500 samples points per trial. More detail about the data can be found in the work of Keirn and Aunon [4].1
5.2 Construction of feature vector and classification
For feature construction, the data are decomposed into
half-second segments as some researchers have done [13],
yielding 20 segments per trial for each subject. Features are extracted from each signal using three steps: in the first step signal is decomposed from three number of supports using EWT, in the second step, FCM clustering algorithm (with
fuzzifier constant m=2) is employed to form
non-Fig. 1 Electrode placement of EEG recording adapted from [13]
1 http://www.cs.colostate.edu/eeg/main/data/1989_Keirn_and_
overlapping frequency bands and the final or third step the eight parameters are calculated. A total of 24 (38) fea-tures are obtained from each channel. Combining feafea-tures of all six channels, each signal is represented in terms of 144 values. Further, it was observed during experiment that not all features were accountable for distinguishing two different mental tasks (see Fig.2), and therefore, we have applied multivariate filter feature selection (BD, LR, and
Ratio of SR) approach to select a set of relevant and non-redundant features.
For all the multivariate filter methods, the top 25 fea-tures were incrementally included one by one to develop the decision model of support vector classifier (SVC) using 10-fold cross-validation. We have used Gaussian Kernel. Grid search is used to find optimal choice of regularization
constantCand gamma.
Fig. 2 Eight features obtained for different tasks for channel 1 from segment 1 using FEWT for subject-1
5.3 Results
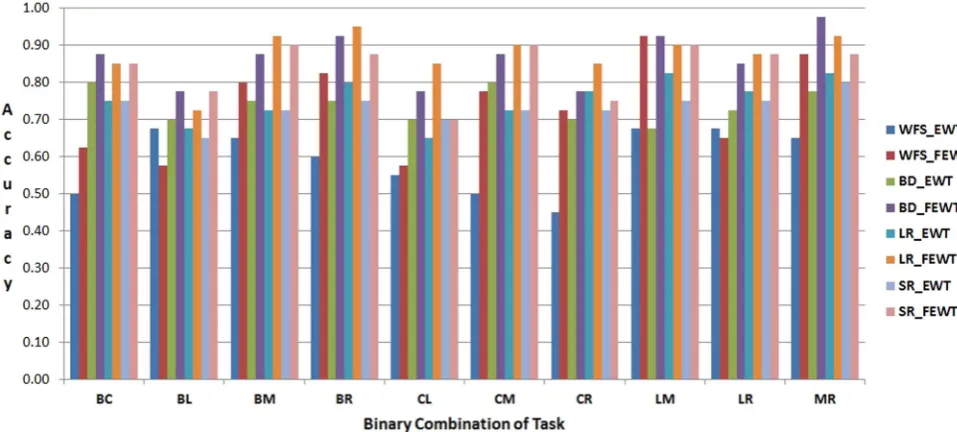
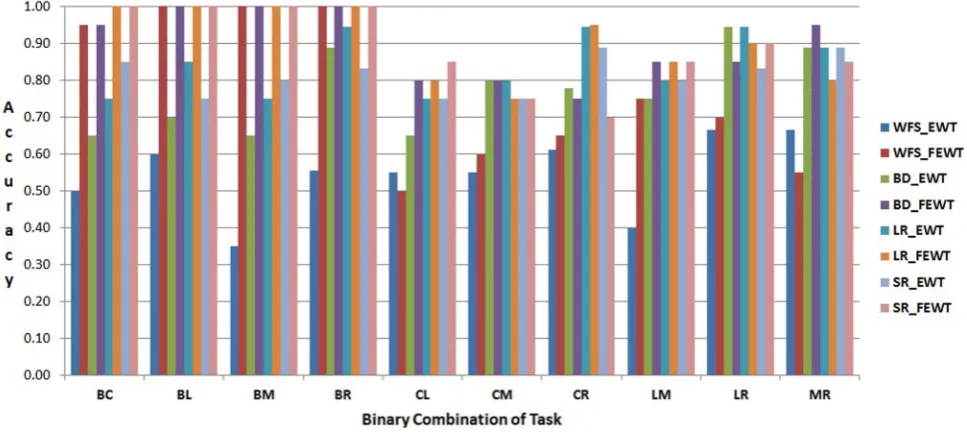
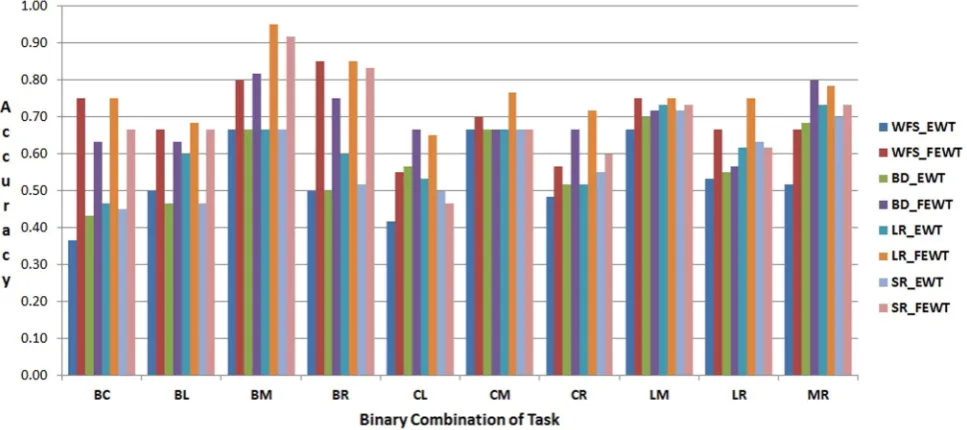
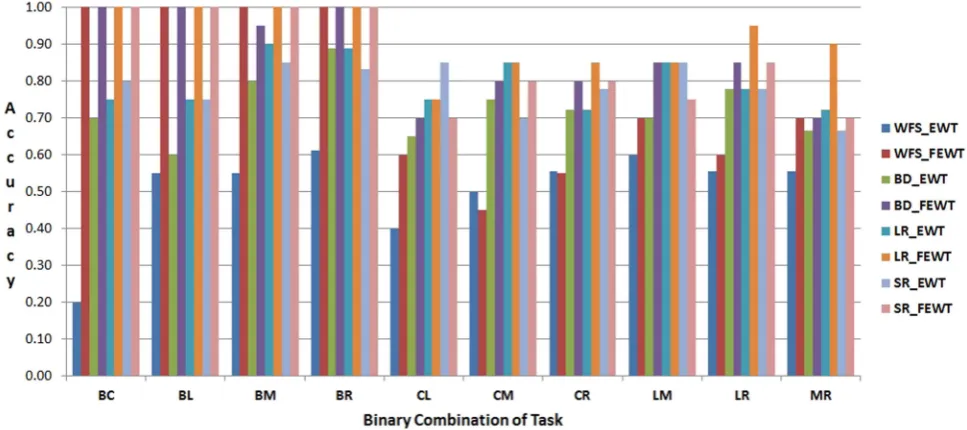
The proposed FEWT methods is compared with the EWT method through the experimental setup as described above for binary mental task classification. Figures 3, 4, 5, 6,
7 and 8 show the classification accuracy taken overall average for the 10 binary combination of the five mental tasks for 1, 2, 3, 5, subject-6, and subject-7, respectively. From these figures, the fol-lowing observations can be noted:
• The performance of classification model has significantly improved after incorporating the fuzzy clustering method along with the EWT compare to EWT alone irrespective of with or without feature selection method for all the binary combination mental tasks for all mentioned subjects. • The classification accuracy of a given classifier has
drastically increased with the application of feature selection methods (BD, LR, and SR) as compared to without feature selection (WFS) irrespective of feature extraction methods.
Fig. 4 Performance of SVC for subject-2
• From Figs. 4 and 8, for some binary combination of mental tasks 100 % classification accuracy for subject-2 and subject-7 is achieved.
5.4 Ranking of various combinations of feature selection methods with proposed FEWT method
We have applied a robust ranking approach utilized by Gupta et al. [43], to study the relative performances of various combinations of feature selection methods with the proposed feature extraction method, i.e., FEWT with
respect to EWT. To rank various combinations, the basis of percentage gain in classification accuracy with respect to maximum classification accuracy obtained using EWT feature extraction method with combination of various feature selection methods has been chosen.
A mathematical description of this ranking procedure is as follows:
Ifi=0, then no feature selection is used; otherwiseith feature selection is used. aiFEWT
t denotes classification
accuracy ofith feature selection method in combination with FEWT feature extraction method fortth task combination.
Fig. 6 Performance of SVC for subject-5
amaxEWT
t ¼maxfa
0 EWTt;a
1 EWTt;a
2
EWTt;. . .;a
i
EWTt;. . .;a
n
EWTtg
ð21Þ
PiFEWT t ¼
aiFEWT ta
max EWTt amax
EWTt
!
100: ð22Þ
Then the average (over all task combination) percentage gain in accuracy forsth technique is given by
PiFEWT¼1 nt
Xnt
t¼1
PiFEWTt; 8i¼0;1;2; :::;ns: ð23Þ
Finally, the rankrs of eachith combination is assigned in such a way that
rarb if papb: ð24Þ
Figure 9 shows four combinations of the feature selection and FEWT extraction methods compared against each other on the basis of percentage gain in accuracy. From Fig. 9, we can see the combination LR with FEWT acquires highest percentage classification accuracy gain with respect to the best combination of EWT with or without feature selection.
5.5 Friedman statistical test
In order to determine the significant difference in various combinations of feature selection and EWT or FEWT statistically, we have applied a two-way [44] and non-parametric statistical test known as Friedman test [45]. Our null hypothesisH0 was that there is no difference in per-formance among all combinations of feature extraction and feature selection. The alternative hypothesis H1 was that
there are differences among combinations. The H0 was
rejected at significant levelp =0.05. From Table 1, it can be noted that the combination of FEWT feature extraction and LR feature selection is the winner among all combi-nations of feature extraction and feature selection.
Fig. 8 Performance of SVC for subject-7
Fig. 9 Ranking of combinations of feature selection methods with FEWT extraction method
Table 1 Friedman ranking of different combinations of fea-ture selection and extraction methods
Combination Ranking
LR_FEWT 1
BD_FEWT 2.4
SR_FEWT 2.95
LR_EWT 4.3
WFS_FEWT 5.25
SR_EWT 5.75
BD_EWT 6.35
6 Conclusion and future work
A theoretical adaptive transform, EWT, has been proposed in recent past to analyze signal on its content basis. EWT would fail to handle the signal which is overlapped in time and frequency domain as the case with the EEG signals from multiple channels. This work has suggested employ-ment of FCM followed by EWT for better representation of EEG signal for further classification of mental task. It can be concluded from experimental results that the proposed approach outperforms as compared with the original EWT technique. It is also noted that the features from multiple channels generate a large size of the feature vector, but the available number of samples is small. Under such a situ-ation, the performance of the learning model degrades in terms of classification accuracy and learning time. To overcome this limitation, this paper has investigated and compared three well-known multivariate filter methods to determine a minimal subset of relevant and non-redundant features. Experimental findings endorse that the employ-ment of feature selection enhances the performance of learning model. Ranking mechanism and Friedman statis-tical test have also been performed for the strengthening the experimental findings.
As the employment of FCM enhances the performance of EWT technique for the mental task classification, it would be better to explore some other fuzzy-based clus-tering which has been explored in image segmentation [46]. It will also be interesting to explore whether the FEWT would work in other type of BCI such as motor imagery and multi-mental task classification.
Acknowledgments Both the authors express their gratitude to the Council of Scientific and Industrial Research (CSIR), India, for the obtained financial support in performing this research work. The first author is also thankful to the Grant Number BT/BI/03/004/2003(C) of Bioinformatics Division, Department of Biotechnology, Ministry of Science and Technology, Government of India. The authors are also thankful to the anonymous reviewers for their constructive suggestions.
Open Access This article is distributed under the terms of the Creative Commons Attribution 4.0 International License (http://crea tivecommons.org/licenses/by/4.0/), which permits unrestricted use, distribution, and reproduction in any medium, provided you give appropriate credit to the original author(s) and the source, provide a link to the Creative Commons license, and indicate if changes were made.
References
1. Graimann B, Allison B, Pfurtscheller G (2010) Brain–computer interfaces: a gentle introduction. Springer, Berlin, pp 1–27 2. Anderson CW, Stolz EA, Shamsunder S (1998) Multivariate
autoregressive models for classification of spontaneous
electroencephalographic signals during mental tasks. IEEE Trans Biomed Eng 45(3):277–286
3. Babiloni F, Cincotti F, Lazzarini L, Millan J, Mourino J, Varsta M, Heikkonen J, Bianchi L, Marciani M (2000) Linear classifi-cation of low-resolution EEG patterns produced by imagined hand movements. IEEE Trans Rehabil Eng 8(2):186–188 4. Keirn ZA, Aunon JI (1990) A new mode of communication
between man and his surroundings. IEEE Trans Biomed Eng 37(12):1209–1214
5. Ku¨bler A (2000) Brain computer communication: development of a brain computer interface for locked-in patients on the basis of the psychophysiological self-regulation training of slow cortical potentials (SCP). Schwa¨bische Verlags-Gesellschaft, Baltimore 6. Schalk G (2008) Brain-computer symbiosis. J Neural Eng 5(1):P1 7. Akram F, Han H-S, Kim T-S (2014) A P300-based brain com-puter interface system for words typing. Comput Biol Med 45: 118–125
8. Bashashati A, Fatourechi M, Ward RK, Birch GE (2007) A survey of signal processing algorithms in brain-computer inter-faces based on electrical brain signals. J Neural Eng 4(2):R32 9. Pfurtscheller G, Neuper C, Flotzinger D, Pregenzer M (1997)
EEG-based discrimination between imagination of right and left hand movement. Electroencephalogr Clin Neurophysiol 103(6): 642–651
10. Kaper M, Meinicke P, Grossekathoefer U, Lingner T, Ritter H (2004) BCI competition 2003–data set IIB: support vector machines for the P300 speller paradigm. IEEE Trans Biomed Eng 51(6):1073–1076
11. Chiappa S, Donckers N, Bengio S, Vrins F (2004) HMM and IOHMM modeling of EEG rhythms for asynchronous BCI sys-tems. ESANN 193–204
12. Moore MM (2003) Real-world applications for brain-computer interface technology. IEEE Trans Neural Syst Rehabil Eng 11(2):162–165
13. Palaniappan R, Paramesran R, Nishida S, Saiwaki N (2002) A new brain-computer interface design using fuzzy artmap. IEEE Trans Neural Syst Rehabil Eng 10(3):140–148
14. Penny WD, Roberts SJ, Curran EA, Stokes MJ et al (2000) EEG-based communication: a pattern recognition approach. IEEE Trans Rehabil Eng 8(2):214–215
15. Daubechies I et al (1992) Ten lectures on wavelets, vol 61. SIAM, Philadelphia
16. Mallat SG (1989) A theory for multiresolution signal decompo-sition: the wavelet representation. IEEE Trans Pattern Anal Mach Intell 11(7):674–693
17. Huang NE, Shen Z, Long SR, Wu MC, Shih HH, Zheng Q, Yen NC, Tung NC, Tung CC, Liu HH (1998) The empirical mode decomposition and the hilbert spectrum for nonlinear and non-stationary time series analysis. Proc R Soc Lond 454(1971): 903–995
18. Bellman RE (1961) Adaptive control processes: a guided tour, vol 4. Princeton University Press, Princeton
19. Jain AK, Duin RPW, Mao J (2000) Statistical pattern recognition: a review. IEEE Trans Pattern Anal Mach Intell 22(1):4–37 20. Guyon I, Elisseeff A (2003) An introduction to variable and
feature selection. J Mach Learn Res 3:1157–1182
21. Berger H (1929) U¨ ber das elektrenkephalogramm des menschen. Eur Arch Psychiatry Clin Neurosci 87(1):527–570
22. Gupta A, Agrawal R, Kaur B (2012) A three phase approach for mental task classification using EEG. In: Proceedings of the International conference on advances in computing. ACM, Communications and Informatics, pp 898–904
24. Diez PF, Mut V, Laciar E, Torres A, Avila E (2009) Application of the empirical mode decomposition to the extraction of features from EEG signals for mental task classification. In: Annual International conference of the IEEE engineering in medicine and biology society 2009. IEEE, pp 2579–2582
25. Gupta A, Agrawal R (2012) Relevant feature selection from EEG signal for mental task classification. In: Advances in knowledge discovery and data mining. Springer, Berlin, pp 431–442 26. Gilles J (2013) Empirical wavelet transform. IEEE Trans Signal
Process 61(16):3999–4010
27. Bezdek JC, Ehrlich R, Full W (1984) FCM: the fuzzy c-means clustering algorithm. Comput Geosci 10(2–3):191–203
28. Zadeh LA (1965) Fuzzy sets. Inf Control 8(3):338–353 29. Nguyen HT (1978) A note on the extension principle for fuzzy
sets. J Math Anal Appl 64(2):369–380
30. Tiwari PK, Srivastava AK (2014) Zadeh extension principle: a note. Ann Fuzzy Math Inform 9(1):37–41
31. Lempel A, Ziv J (1976) On the complexity of finite sequences. IEEE Trans Inf Theory 22(1):75–81
32. Kohavi R, John GH (1997) Wrappers for feature subset selection. Artif Intell 97(1):273–324
33. Guerrero-Mosquera C, Verleysen M, Vazquez AN (2010) EEG feature selection using mutual information and support vector machine: a comparative analysis. In: 2010 Annual International conference of the IEEE engineering in medicine and biology society (EMBC). IEEE, pp 4946–4949
34. Koprinska I (2010) Feature selection for brain-computer interfaces. In: Washio SC, Tsumoto SI, Yamada TO, Inokuchi A (eds) New frontiers in applied data mining. Springer, Berlin, pp 106–117 35. Murugappan M, Ramachandran N, Sazali Y et al (2010)
Classi-fication of human emotion from EEG using discrete wavelet transform. J Biomed Sci Eng 3(04):390
36. Rodriguez-Bermudez G, Garcia-Laencina PJ, Roca-Dorda J (2013) Efficient automatic selection and combination of EEG features in least squares classifiers for motor imagery brain-computer interfaces. Int J Neural Syst 23(4):1350015
37. Bhattacharyya S, Sengupta A, Chakraborti T, Konar A, Tibare-wala D (2014) Automatic feature selection of motor imagery EEG signals using differential evolution and learning automata. Med Biol Eng Comput 52(2):131–139
38. Dias NS, Kamrunnahar M, Mendes PM, Schiff S, Correia JH (2010) Feature selection on movement imagery discrimination and attention detection. Med Biol Eng Comput 48(4):331–341
39. Bhattacharyya A (1946) On a measure of divergence between two multinomial populations. Sankhya¯: Indian J Stat 7(4):401–406 40. Devijver PA, Kittler J (1982) Pattern recognition: a statistical
approach, vol 761. Prentice-Hall, London
41. Park HS, Yoo SH, Cho SB (2007) Forward selection method with regression analysis for optimal gene selection in cancer classifi-cation. Int J Comput Math 84(5):653–667
42. Chernoff H (1952) A measure of asymptotic efficiency for tests of a hypothesis based on the sum of observations. Ann Math Stat 493–507
43. Gupta A, Agrawal R, Kaur B (2015) Performance enhancement of mental task classification using EEG signal: a study of multivariate feature selection methods. Soft Comput 19(10):2799–2812 44. Derrac J, Garcı´a S, Molina D, Herrera F (2011) A practical
tutorial on the use of nonparametric statistical tests as a methodology for comparing evolutionary and swarm intelligence algorithms. Swarm Evolut Comput 1(1):3–18
45. Friedman M (1937) The use of ranks to avoid the assumption of normality implicit in the analysis of variance. J Am Stat Assoc 32(200):675–701
46. Verma H, Agrawal RK, Kumar N (2014) Improved fuzzy entropy clustering algorithm for MRI brain image segmentation. Int J Imaging Syst Technol 24(4):277–283
Dr. Akshansh Guptais currently a postdoctoral research fellow in the school of Computational and Integrative Sciences at Jawaharlal Nehru University (JNU), New Delhi, India. He received his master and Ph.D. degree from the school of Computer and Systems Sciences, JNU, in the year 2010 and 2015 respectively. His research interests include signal processing, brain-computer interface, cognitive science, and healthcare.
![Fig. 1 Electrode placement of EEG recording adapted from [13]](https://thumb-us.123doks.com/thumbv2/123dok_us/815245.1578920/5.595.332.498.56.193/fig-electrode-placement-eeg-recording-adapted.webp)