Sección Especial: Optoel’11 / Special Section: Optoel’11
Tomography
of
the
modulus
and
phase
of
an
infrared
focused
beam
for
nanophotonic
characterization
measurements
Tomografía
del
modulo
y
la
fase
de
un
haz
focalizado
de
infra
‐
rojo
para
medidas
de
caracterización
nanofotónica
Manuel Silva‐López
(1,*), José María Rico‐García
(2), Javier Alda
(1,S)1. Departamento de Óptica I, Escuela Universitaria de Óptica, Av, Arcos de Jalón 117, Madrid, Spain. 2. Sección Departamental de Matemática Aplicada, Escuela Univ. de Óptica, Av. Arcos de Jalón 117 Madrid, Spain.
(*) Email: [email protected] S: miembro de SEDOPTICA / SEDOPTICA member
Recibido / Received: 29/09/2011. Revisado / Revised: 20/02/2011. Aceptado / Accepted: 21/02/2012.
ABSTRACT:
The amplitude and phase spatial maps around the focal plane of a laser beam are recovered. Irradiance maps are obtained using a tomographic method based on the knife‐edge technique, and the beam phase is obtained by means of an algorithm based on the Irradiance Transport Equation (ITE). Information on the amplitude and phase distribution of an incoming beam is useful for characterization of nanophotonic devices (such as antenna‐couple detectors) that are sensitive to these parameters. This method avoids the use of image‐forming devices which are not suitable under low spatial resolution conditions.
Key words: Phase Retrieval, Tomography, Nanophotonics.
RESUMEN:
En esta contribución se presentan los mapas de intensidad y fase de un haz láser en las cercanías del plano focal de una lente. Los mapas de irradiancia se obtienen a través de un método tomográfico basado en la técnica knife‐edge, y los mapas de fase se extraen usando un algoritmo basado en la ecuación de transporte de irradiancia. Conocer la distribución de la amplitud y la fase del haz incidente es importante para la caracterización de dispositivos nanofótonicos (como detectores basados en antenas), sensibles a estos parámetros. Este método evita el uso de cámaras en condiciones de baja resolución.
Palabras clave: Recuperación de Fase, Tomografía, Nanofotónica.
REFERENCIAS Y ENLACES / REFERENCES AND LINKS
[1]. R. Olmon, M. Rang, P. Krenz, B. Lail, L. Saraf, G. Boreman, M. Raschke, “Determination of electric‐field, magnetic‐field, and electric‐current distributions of infrared optical antennas: A near‐field optical vector network analyzer”, Phys. Rev. Lett. 105, 167403 (2010).
[2]. R. Olmon, P. Krenz, A. Jones, G. Boreman, M. Raschke, “Near‐field imaging of optical antenna modes in the mid‐infrared”, Opt. Express 16, 20295‐20305 (2008).
[3]. S. Cherukulappurath, D. Heinis, J. Cesario, N. F. van Hulst, S. Enoch, R. Quidant, “Local observation of plasmon focusing in Talbot carpets”, Opt. Express 17, 23772‐23784 (2009).
[4]. S. Y. Suck, S. Collin, N. Bardou, Y. De Wilde, G. Tessier, “Imaging the three‐dimensional scattering pattern of plasmonic nanodisk chains by digital heterodyne holography”, Opt. Lett. 36, 849‐851 (2011).
[5]. P. Mühlschlegel, H.‐J. Eisler, O. J. F. Martin, B. Hetch, D. W. Pohl, “Resonant optical antennas”, Science
[6]. J. Alda, C. Fumeaux, I. Codreanu, J. A. Schaefer, G. D. Boreman, “Deconvolution method for two‐ dimensional spatial‐response mapping of lithographic infrared antennas”, Appl. Opt. 38, 3993‐4000 (1999).
[7]. J. M. Rico‐García, L. M. Sánchez‐Brea, J. Alda, “Application of tomographic techniques to the spatial‐ response mapping of antenna‐coupled detectors in the visible”, Appl. Opt. 47, 768‐775 (2008). [8]. L. M. Sánchez‐Brea, P. Siegmann, “Analytical determination of the uncertainty and the optimum
sampling frequency for one‐dimensional images with noise”, Appl. Opt. 47, 6350‐6356 (2008). [9]. R. Dorn, S. Quabis, G. Leuchs, “Sharper focus for a radially polarized light beam”, Phys. Rev. Lett. 91,
233901 (2003).
[10]. M. R. Teague, “Deterministic phase retrieval: A Green's function solution”, J. Opt. Soc. Am. 73, 1434– 1441 (1983).
[11]. T. E.Gureyev, A.Roberts, K. A.Nugent, “Phase retrieval with the transport‐of‐intensity equation: Matrix solution with use of Zernike polynomials”, J. Opt. Soc. Am. A 12, 1932‐1942 (1995).
[12]. A. Savitzky, M. J. E. Golay, “Smoothing and differentiation of data by simplified least squares procedures”, Anal. Chem. 36, 1627–1639 (1964).
1.
Introduction
It is commonplace to measure both phase and intensity in nanophotonics applications to precisely determine the response of the incoming light of the devices under study [1‐4]. Typically, such measurement entails an interferometer arrangement and an image‐ forming device. An example of this approach is the response characterization of optical antennas [5,6]. The footprint of these components is at best only a few wavelengths in size with features well below the wavelength of the received or emitted optical radiation. Hence, subwavelength spatial resolution is a must in their characterization.
The light beam used as probe for these nano‐ elements also requires a detailed measurement of its properties [6] Most of the beam characterization techniques rely on the map irradiance determination using image forming systems. In our case, when nano‐devices are under test, the beams have to be focused very tightly and their lateral extension is only a very few wavelengths, below the spatial resolution of formers. Even the commercial solutions based on dynamic knife edge measurement cannot provide accurate measurements of the beam. On the other hand, when the elements under test may respond to the phase distribution of the beam, as it happens with optical resonant structures such as optical antennas, which needs to be evaluated and taken into account to properly characterize the devices.
In a previous work it has been demonstrated the use of knife‐edge techniques aided by tomographic reconstruction algorithms to retrieve the beam irradiance map [7], where there is no need of image‐forming devices. This tomographic reconstruction has a better reliability in regard to those measurements based on theoretical models of the beam. The technique uses a collection of knife‐edge measurements obtained with a high spatial resolution. The knife‐edge data set, known as sinogram, is mathematically the Radon transform of the beam intensity pattern at the work plane, which is taken orthogonal to the optical axis. Consequently, the inversion of the sinogram provides with a full reconstruction of the intensity pattern. However, noise level in the former prevents from a direct inversion, and the data needs to be filtered using several techniques as Golay filters or kriging methods [8,9].
This contribution describes a technique to measure both phase and intensity without camera or interferometric arrangement. We have implemented a phase retrieval algorithm that uses the irradiance maps obtained via knife‐ edge technique [10,11], it allows a faithful reconstruction of the complex amplitude of the electromagnetic field of a tightly focused laser beam. Section 2 is devoted to the description of the experimental setup. The data analysis, processing and the results are presented in sections 3, 4 and 5. Finally, section 6 summarizes the main conclusions of this contribution.
2.
Experimental
set
‐
up
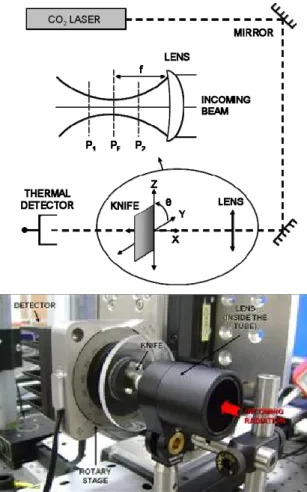
Figure 1 shows the experimental set up prepared to obtain the maps of irradiance. A power‐stabilized CO2 laser (LASY‐5 Access
Laser) is used as a light source. It has an output continuous power of 5 W maximum at a 10.6 µm wavelength. The beam is directed to a suitable IR lens (ULO Optics) with an = 25.4 mm of focal length. The knife edge is located near the waist of the beam, at plane PF, and by means of DC‐ motor stages it can be moved in any , and direction. The knife is also attached to a rotary stage. This allows a change in its orientation, around ‐axis, so that the beam can be cut from any angle . Intensity variations, due to the obstructing knife, are observed in a thermopile based detector.
As the knife gets away from the beam path, the intensity goes up again. This process is repeated, however, by means of the rotary stage the knife is removed from a different direction (defined by the angle). A set of normalized measurements are illustrated in Fig. 2. There are 9 profiles obtained with a 20° separation. If the beam was a perfect Gaussian beam all the plots would overlap completely. Since the detector is a slow thermal sensor (~2.5 s rise time) the knife edge must move accordingly. The speed was thus set to 8.5 µm/s and each measurement took around 30 s.
The knife‐edge technique used here is valid only when the spatial resolution is high enough to provide a good reconstruction of the irradiance map. As far as the phase retrieval algorithm, which will be explained below, it is based on the irradiance distribution given at several planes along the propagation axis. The three spatial coordinates, along with a angular rotation, need to be controlled and monitored with high accuracy.
3.
Data
processing
The integrated profiles of the beam along the different orientation are used in the tomographic reconstruction algorithm. As far as the actual movement is not perpendicular to the knife‐edge orientation, a cosine projection factor
Fig. 1: Top: Diagram of the experimental set‐up. Bottom: Picture of the detection area..
Fig. 2: Normalised knife‐edge beam profiles at different angles.
is included in the calculation. The experimental results also need to be aligned with a given reference position. This reference is given by calculating the median of the normalized distribution. This median has to be coincident with the location of the “center of mass” of the
irradiance distribution. This is why the data presented in Fig. 2 intersect at the 0.5 value. The integrated profile can be obtained by deriving the knife‐edge profiles with respect to the movement of the knife‐edge. The transfer function of the detector is taken into account to produce a reliable set of data.
Then, in order to recover the beam intensity profile, a derivative process is applied to the curves shown in Fig. 2. The derivation procedure reveals an important contribution of noise that needs to be filtered out from the data. This is done by using a Golay filter [12]. Figure 3 shows the derivatives of the cumulative intensity after filtering. In our case the application of this filter has been enough to obtain a good reconstruction of the beam. 9 curves are shown together, they correspond to the profiles ( , ) after the filtering process, where u is the knife‐edge displacement and θ refers to the cut orientation. I. e. they correspond to the intensity profiles at different angles (slices), necessary for a good spatial reconstruction of the beam.
Once filtered, the data is arranged in the so‐ called sinogram, illustrated in Fig. 4. The intensity is plotted in the vertical axis and the angles in the horizontal axis.
As the derivatives of the cumulative intensity data are the integrated profiles along the set of straight lines,
cos sin , 1
where is a constant, they can be identified with the Radon transform of the intensity pattern [7]. The direct Radon transform is the sinogram, and it depends both on the cut angle and the position along the line given by . Alternatively the sinogram can be inverted to get the intensity pattern ( , ) according to the following expression:
, ,
| | ,
. 2
This procedure is known as tomography, and accounts for reconstruction of a 2D function in terms of their integrated profiles (slices) in 1D. Fig. 3: Derivatives of the intensity profiles after filtering. Fig. 4: Sinogram of the derivatives.
4.
Phase
retrieval
The theoretical tool allowing the phase reconstruction is the irradiance transport equation (ITE) [10,11]:
∙ ∙ . 3
If the beam irradiance at different transversal planes to the optical axis is known, the retrieval of the beam phase or wavefront at those planes is feasible, provided that the paraxial approximation holds. Such an approximation is valid if the focusing lens is not too fast. A
solution of (3) can be expressed as an algebraic system, where the / derivative is estimated through finite differences from data of the focus neighbouring planes and decomposed in unknown Zernike coefficients. These equations are:
. 4
The matrix depends on the intensity at the focus plane, is the pupil radii whereas is computed from data at the neighbouring planes. The vector is formed by Zernike coefficients used in the phase retrieval. Details about all the quantities involved in the computation can be found in [11].
5.
Results
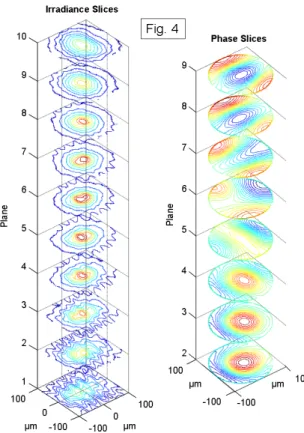
Ten irradiance maps have been recovered after processing the beam cuts at different angles using the inverse Radon transform. They are shown in Fig. 5 (left). The planes are around the focal point and are separated 85µm. Within the Gaussian beam behaviour some aberrations are also noticeable; both at the focus and out‐of focus planes. They are probably due to system misalignments or introduced by the lens.
The beam wavefront has been recovered at 8 planes. In Fig. 5 (right), the phase evolves along the axis, with values ranging from ‐0.33 radians (blue) to 0.39 radians (red) (within the Rayleigh range ~3mm). Astigmatism and defocus govern the wavefront propagation. It is noticeable the Gouy phase effect: the phase crossing the focus jumps from positive to negative (see neighbouring planes to that of focus) accordingly to theory.
6.
Conclusions
In this contribution a method to evaluate the amplitude and phase of a laser beam is described. This allows beam characterization when image‐forming systems are not available or suitable. Besides, no interferometric measurements are necessary. The method is
Fig. 5. Beam intensity and phase maps. Left: normalized intensity planes around the focal point. Right: corresponding phase maps calculated.
based on a multi‐angle knife‐edge set of measurements that are filtered and arranged in a sinogram, which is the inverse Radon transform of the intensity distribution. Upon inversion, the irradiance maps obtained along the propagation axis are processed by the irradiance transport equation. That yields phase maps at several planes around the focal plane, so that a complete description of the electromagnetic field is available.
Proper light beam description is fundamental in the characterization of phase sensitive nanophotonic devices, such as optical antennae.
Acknowledgements
This work has been supported by project ENE2009‐14340 from the Spanish Ministry of Science and Innovation.