Christian Riedel1 , David A. Minton2 , Gregory Michael1 , Csilla Orgel1 , Carolyn H. van der Bogert3 , and Harald Hiesinger3
1Institute of Geological Sciences, Planetary Sciences, and Remote Sensing, Freie Universität, Berlin, Germany, 2Department of Earth, Atmospheric, and Planetary Sciences, Purdue University, West Lafayette, IN, USA,3Institut für
Planetologie, Westfälische Wilhelms‐Universität Münster, Münster, Germany
Abstract
The crater record of a planetary surface unit is often analyzed by its cumulative size‐frequency distribution (CSFD). Measuring CSFDs involves traditional approaches, such as traditional crater counting (TCC) and buffered crater counting (BCC), as well as geometric corrections, such as nonsparseness correction (NSC) and buffered nonsparseness correction (BNSC). NSC and BNSC consider the effects of geometric crater obliteration on the CSFD. On the Moon, crater obliteration leads to two distinct states in which obtained CSFDs do not match the production CSFD—crater equilibrium and nonsparseness. Crater equilibrium occurs when each new impact erases a preexisting crater of the same size. It is clearly observed on lunar terrains dominated by small simple craters with steep‐sloped production CSFDs, such as Imbrian to Eratosthenian‐era mare units. Nonsparseness, on the other hand, is caused by the geometric overlap of preexisting craters by a new impact, which is also known as“cookie cutting.”Cookie cutting is most clearly observed on lunar terrains dominated by large craters with shallow‐sloped production CSFDs, such as the pre‐Nectarian lunar highlands. We use the Cratered Terrain Evolution Model (CTEM) to simulate the evolution of a pre‐Nectarian surface unit. The model was previously used to simulate the diffusion‐induced equilibrium for small craters of the lunar maria. Wefind that relative to their size, large craters contribute less to the diffusion of the surrounding landscape than small craters. Thus, a simple scale dependence cannot account for the per‐crater contribution to degradation by small simple and large complex craters.Plain Language Summary
Impact cratering is the dominant surface process on the Moon due to the absence of an atmosphere and limited geological activity. On most lunar terrains, the degradation and erasure of craters are caused by new impacts. Most small craters degrade differently than very large craters. Fresh, small craters have a bowl‐shaped form, and they get shallower over time until they cannot be seen anymore. This process is called diffusive degradation and is caused by the cumulative effects of craters that form in the surrounding area. Small craters are only rarely removed by the direct overlap of larger craters, known as“cookie cutting.”In contrast, large craters are more likely to be lost by cookie cutting. We use a computer model to simulate an old lunar surface with many large craters, where small and large craters have the same relative influence on the diffusive degradation of the surrounding terrain. The same model has been used to simulate how small craters degrade. When we apply this model to terrains dominated by very large craters, wefind that the simple scaling no longer holds and, proportional to their size, small craters contribute more to diffusive degradation of the surrounding area than large craters.1. Introduction: The Evolution of Lunar Surface Units
The surface evolution of the Moon is largely controlled by impact cratering. Its surface provides a well‐preserved cratering record that has long been used to also understand the surface evolution of planetary bodies in the inner solar system (e.g., Baldwin, 1964; Hiesinger et al., 2012; Neukum, 1983; Neukum et al., 2001; Öpik, 1960; Stöffler et al., 2006; Stöffler & Ryder, 2001). One big challenge, however, is that the impact record of the most ancient lunar terrains is incomplete due to crater degradation and erasure pro-cesses. This circumstance has led to a long debate about the bombardment history of the Moon, particularly during the Nectarian and pre‐Nectarian periods. Investigations on such ancient lunar surface units showed a change in the cumulative size‐frequency distribution (CSFD) slope, which has been attributed to the ©2020. The Authors.
This is an open access article under the terms of the Creative Commons Attribution License, which permits use, distribution and reproduction in any medium, provided the original work is properly cited.
Key Points:
• We model the surface evolution for a pre‐Nectarian lunar surface unit
• Relative to their size, large craters are less destructive to the surrounding terrain than small simple craters
• A simple scale dependence from small to large craters does not explain the per‐crater contribution to topographic diffusion of large craters Supporting Information: •Supporting Information S1 Correspondence to: C. Riedel, christian.riedel@fu‐berlin.de Citation:
Riedel, C., Minton, D. A., Michael, G., Orgel, C., van der Bogert, C. H., & Hiesinger, H. (2020). Degradation of small simple and large complex lunar craters: Not a simple scale dependence.
Journal of Geophysical Research: Planets,125, e2019JE006273. https:// doi.org/10.1029/2019JE006273 Received 8 NOV 2019 Accepted 27 MAR 2020
presence of multiple impactor populations that hit the lunar surface (e.g., Fassett et al., 2012; Marchi et al., 2012; Strom et al., 2005; Strom et al., 2015).
Strom et al. (2005), Marchi et al. (2012), and Strom et al. (2015) proposed that the crater populations prior to the Eratosthenian were distinct from those more recent and were part of a putative lunar cataclysm (Tera et al., 1974). During this cataclysm, projectiles with different impactor characteristics hit the lunar sur-face during a period of intense bombardment. Thus, the ancient lunar highland was postulated to have been bombarded by an impactor population different from the one that shapes the lunar surface since the empla-cement of the maria. However, the hypothesis that there was a distinct impactor population in the cataclysm is disputed. Neukum and Ivanov (1994), Hartmann (1995), and Neukum et al. (2001) argued that a single‐production population can entirely explain the lunar cratering record. The CSFD slope on ancient lunar terrain is therefore not due to different impactor populations but to geologic resurfacing effects. Marchi et al. (2012) proposed that an observed change in the CSFD of craters from the pre‐Nectarian onward could be explained by an increase in the average impactor velocity over time. They attributed this change to the dynamical evolution of objects destabilized from the main asteroid belt or an inner extension of the main asteroid belt during the Nice model giant planet instability (Bottke et al., 2012; Gomes et al., 2005). However, investigations by Orgel et al. (2018) suggest that the change in the observed crater size‐frequency distribution noted by Marchi et al. (2012) and in earlier work could instead be a natural consequence of the cratering pro-cess. Because each new crater causes a geologic resurfacing of the preexisting surface, as craters accumulate, the geometric obliteration of preexisting small craters by larger ones causes a size‐dependent change in the number of observed craters relative to the production population. This effect would be more pronounced for more heavily cratered terrains, thus would only appear to be a change in the CSFD through time. A number of recent studies (summarized by Hartmann, 2019) have led to the revision of the lunar cataclysm theory. Michael et al. (2018) and Liu et al. (2019) argue that the radioisotopic dating of lunar rock samples, on which the theory of the lunar cataclysm is based, is affected by a sample bias caused by the transport of Imbrian impact melt. Biases in samples dated by the 40Ar/39Ar method may also give the appearance of a cataclysm when none occurred (Boehnke & Harrison, 2016). Therefore, it is possible that the change in the CSFD slope on ancient lunar surface units was not influenced by a cataclysm but by crater degradation pro-cesses. Thus, to properly interpret ancient crater populations, we must better quantify how craters have been degraded and erased over time.
Except in the limited regions affected by mare volcanism, the primary contribution to crater erasure on the Moon has been from impact cratering itself (e.g., Öpik, 1960; Ross, 1968). As cratering progresses on a sur-face unit, the cratering record typically reaches a state where on average every new impact erases a preexist-ing crater of the same size. In this condition, the crater density of craters smaller than a certain size does not increase anymore despite ongoing cratering. This condition is called crater equilibrium (e.g., Gault, 1970; Melosh, 1989; Woronow, 1977). The largest crater diameter that is affected by this condition is called equili-brium onsetDeq. When the CSFD of crater populations in equilibrium is compared to a function of crater production (e.g., Neukum, 1983; Neukum et al., 2001), the obtained cumulative crater frequencies (Crater Analysis Techniques Working Group, 1979) typically do not follow a function of crater production but a power law of the form
Neqð Þ ¼D aDb; (1)
whereais a coefficient constant andbis the equilibrium slope. Lunar surface investigations suggest that the slope for populations of small simple craters (D< 1 km) in equilibrium is relatively constant atb~−2 (e.g., Gault, 1970; Hartmann, 1984; Hirabayashi et al., 2017; Minton et al., 2019; van der Bogert et al., 2017; Xiao & Werner, 2015).
Crater populations in equilibrium, wherein the CSFD follows a power law in the form of equation 1, origi-nate from a steep‐sloped (b< −2) crater production CSFD in which degradation is dominated by small cra-ters (e.g., Hirabayashi et al., 2017; Melosh, 1989; Richardson, 2009; Xiao & Werner, 2015). Hirabayashi et al. (2017) found that in such an environment, the slope for crater populations in equilibrium is indepen-dent of the slope of the crater production CSFD and that degradation processes on the surface determine the equilibrium state. For shallow production CSFDs (b> −2), in which degradation is dominated by large cra-ters, it is expected that the slope of the production population would be maintained in equilibrium
(Hirabayashi et al., 2017; Melosh, 1989). As a result, both the evolution of the equilibrium state and the CSFD of crater populations in equilibrium are expected to differ from a small crater‐induced equilibrium. It has been suggested that the slope of the production CSFD would also be maintained in equilibrium for production CSFDs that have both steep and shallow branches, such as is seen in theD> 20 km population of craters of the ancient lunar highlands (Chapman & McKinnon 1986; Richardson, 2009). However, Minton et al. (2019) showed that even in the case of the steep slopedD< 100 m crater population of the mare, the equilibrium parametersaandbhave a complicated dependence on how new craters of different sizes con-tribute to the degradation of old craters via process like distal secondary formation, and also on and how the visibility of craters to a human crater counter depends on size and accumulated degradation. These processes are poorly constrained forD> 20 km scale craters, and thus whether or not the lunar highlands are in a state of equilibrium and what an equilibrium CSFD looks like for the highlands remain open questions. The equi-librium onset occurs when the spatial number density of craters of a particular size reaches that of equili-brium. It is typical to specify the spatial number density of craters in equilibrium relative to that of geometric saturation (Melosh, 1989). Geometric saturation describes a theoretical case of maximum crater density at which circular features are arranged in a rim‐to‐rim configuration (Gault, 1970). The CSFD of a geometrically saturated crater population is represented by a power law with a = 1.54 andb = − 2 (Gault, 1970; Xiao & Werner, 2015). It is common to represent the density levels of craters in equilibrium as a fraction of the maximum possible crater configuration. On the lunar surface, CSFD observations suggest that equilibrium for small simple craters occurs at 1–10% of geometric saturation (e.g., Gault, 1970; Xiao & Werner, 2015). However, Povilaitis et al. (2018) investigated lunar surface units where the configuration of large cratersD> 40 km reaches more than 10% geometric saturation, without being in an equilibrium state. Thus, it has been suggested that an arbitrary saturation level alone cannot evaluate the presence of crater equilibrium (Povilaitis et al., 2018; Xiao & Werner, 2015), because crater degradation is likely a size‐dependent process (e.g., Fassett & Thomson, 2014; Hirabayashi et al., 2017; Povilaitis et al., 2018; Minton et al., 2019).
Modeling and CSFD observations suggest that crater degradation for small simple craters is dominated by the topographic diffusion of impact craters (e.g., Craddock & Howard, 2000; Fassett & Thomson, 2014; Hartmann & Gaskell, 1997; Minton et al., 2019; Soderblom, 1970). In a diffusion‐dominated degradation environment, impact craters become shallower over time until they can no longer be distinguished from the surrounding terrain. This process is mainly caused by continuous diffusive topographic degradation, also known as soil creep. In this form of degradation, the crater rims are slowly eroded, and the inner bowlsfilled in as surface material accumulate due to the preferred downslope transport of the loose material (e.g., Ross, 1968; Soderblom, 1970). This mechanism, where small craters erode larger ones, is also referred to as sandblasting (e.g., Hartmann & Gaskell, 1997; Hirabayashi et al., 2017; Minton et al., 2019; Richardson, 2009). Minton et al. (2019) concluded that sandblasting by primary impactors alone is not effec-tive enough to induce the equilibrium CSFD to be <5% of geometric saturation as observed for simple, post-mare craters. Instead, they concluded that the cumulative effects of energetic distal ejecta deposition, which includes the formation of secondary craters, dominate diffusive crater degradation on the lunar maria. The diffusion‐dominated equilibrium that characterizes the populations ofD< ~100 m postmare craters results in a very sparse spatial distribution of similar‐sized craters. On the other hand, craters with D> 20 km on the oldest lunar surface units reveal an effect of nonsparse cratering (Kneissl et al., 2016; Orgel et al., 2018; Riedel et al., 2018), where the number of visible craters is lower than the number of pro-duced craters as well. In contrast to a diffusion‐dominated crater equilibrium, the number of visible craters continues to increase with ongoing cratering and CSFDs do not follow an equilibrium power law (e.g., Fassett et al., 2012; Orgel et al., 2018). Furthermore, crater density rates on the lunar highlands can reach geometric saturation levels of 10% or more (Povilaitis et al., 2018), which is higher than the geometric satura-tion rates at which crater equilibrium (wherein the CSFD follows an equilibrium power law) typically occurs for smaller craters (Xiao & Werner, 2015). The nonsparseness effect is caused by the geometric overlap of existing craters by a larger impact. This process is also referred to as cookie cutting (e.g., Hirabayashi et al., 2017; Minton et al., 2019; Richardson, 2009; Woronow, 1977). Due to the erasure of the previously existing crater record, the new impact contributes to a partial resurfacing of the smaller craters on the sur-face unit. Thus, the observed crater densities are lower than the total number of produced craters. Orgel
et al. (2018) investigated this effect for craters withD> 20 km on the remnants of lunar basins. They found that by excluding areas of crater obliteration from the crater count area via nonsparseness correction (NSC) or buffered nonsparseness correction (BNSC) methods (Kneissl et al., 2016; Riedel et al., 2018), the mismatch between the CSFD and crater production function on the heavily cratered Nectarian and pre‐Nectarian surface units can be corrected (Figure 1b). Traditional CSFD measurement techniques like traditional crater counting (TCC; used, e.g., by Neukum, 1983, and Hiesinger et al., 2012) or buffered crater counting (BCC; used, e.g., by Tanaka, 1982, and Fassett et al., 2012) do not correct this effect.
Investigations on diffusive crater degradation and nonsparse cratering suggest that crater degradation affects the evolution of sparsely and heavily cratered surfaces on the Moon differently. In this work, we use a three‐dimensional surface evolution model to investigate how the most ancient lunar terrain evolved under the influence of both topographic diffusion arising from distal energetic ejecta as well as cookie cutting. To this end, we apply diffusion models that were previously constrained from simulations of the evolution of a terrain dominated by small simple craters that reach a state of equilibrium (Minton et al., 2019). We model the evolution of a pre‐Nectarian surface unit to investigate whether the per‐crater contribution to topo-graphic diffusion scales in an environment in which the nonsparseness effect occurs.
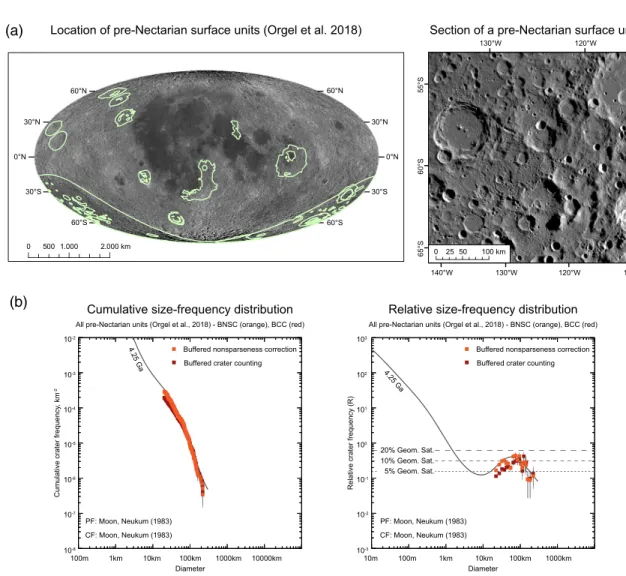
Figure 1.Pre‐Nectarian surface observations by Orgel et al. (2018). The authors conducted crater size‐frequency distribution measurements of craters with a diameter of 20–200 km, which are located on the remnants of lunar basins. Those units in which the absolute model age is older than the Nectaris unit (4.17 Ga) were considered pre‐Nectarian. Figure 1a shows the location of the pre‐Nectarian surface units as identified by Orgel et al. (2018) and a section of such surface unit. Figure 1b shows the obtained crater size‐frequency distributions from BCC (red) and BNSC (orange) measurements on pre‐Nectarian surface units. The crater size‐frequency distribution obtained with BNSC is in a better agreement with the lunar production function by Neukum (1983) (gray) than the crater size‐frequency distribution obtained with the BCC technique.
2. Modeling Surface Evolution With CTEM
2.1. Modeling Crater Degradation
We use the Cratered Terrain Evolution Model (CTEM) (Minton et al., 2015; Minton et al., 2019; Richardson, 2009) to simulate the evolution of a cratered surface on the Moon. CTEM uses a user‐defined impactor population to form craters on a planetary surface unit over time. Unlike other codes to study sur-face evolution (e.g., Hartmann & Gaskell, 1997; Marchi et al., 2012; Woronow, 1985), CTEM generates a three‐dimensional surface model with human‐calibrated crater counts (Minton et al., 2015; Minton et al., 2019). CTEM simulations have been used to study cratering‐related processes on the Moon such as the crater equilibrium of large highland craters (Richardson, 2009), theflux of ancient lunar impactors (Minton et al., 2015), and the effects of distal ejecta on both surface mixing (Huang et al., 2017) and small crater equilibrium (Minton et al., 2019). In this context, the surface evolution models in CTEM have under-gone some modifications over time. For our study, we use the surface evolution models that Minton et al. (2019) implemented into the CTEM code. In this model, four processes contribute to the erasure of existing craters by new impacts: cookie cutting, low‐velocity proximal ejecta blanketing, sandblasting by pri-mary impacts, and sandblasting by high‐velocity distal ejecta (secondary impacts parameterized with a topo-graphic diffusion model). When describing the degradation models, we differentiate between existing craters with radiusrthat experience degradation and a new impact with radiusřthat contributes to the degradation of the preexisting landscape.
2.2. Cookie Cutting
Cookie cutting describes a geometric crater obliteration process, where a new crater superposes smaller cra-ters during impact. All cracra-ters whose rims are located within the rim of the new, larger crater are erased. Cookie cutting can cause large‐scale resurfacing of the preexisting terrain.
2.3. Proximal Ejecta Blanketing (Low‐Energy Ejecta Deposition) and Sandblasting
When a new impact forms on the CTEM‐generated surface, the excavated material forms a continuous blan-ket around the crater rim. The ejecta thicknesshis approximated by a function of distancedfrom the rim of a fresh crater with radiusř:
h¼hrim d ̌ r −3 : (2)
hrimdescribes the ejecta thickness at the rim and is determined by hrim¼0:14*ř 0:74
(Fassett et al., 2011; McGetchin et al., 1973). The proximal ejecta blanket is geometrically similar for craters of all sizes and there-fore represented in a simplified manner.
When a fresh crater forms on a slope, the proximal ejecta deposits preferably move in downslope direction (e.g., Ross, 1968; Soderblom, 1970). This leads to a crater obliteration process called sandblasting, where small craters degrade the slopes of larger craters and slowly fill the large crater with proximal ejecta. Proximal ejecta also degrades craters by burying them (e.g., Fassett et al., 2011). The efficiency with which ejecta of a given thickness buries craters of a given depth is determined using a topographic diffusion model (see section 2.2).
2.4. Distal Ejecta Blanketing (High‐Energy Ejecta Deposition)
In addition to the low‐energy proximal ejecta, an impact excavates high‐energy secondary projectiles that are deposited at a great distance from the crater rim (e.g., Speyerer et al., 2016). The secondary projectiles hit the surface and contribute to proximal ejecta blanketing and sandblasting in the same way as the primary impactors. Minton et al. (2019) concluded that this distal energetic ejecta deposition dominated the degrada-tion of simple craters. For simplicity reasons in this work, we ignore the spatial complexity of distal ejecta rays (e.g., Elliott et al., 2018; Huang et al., 2017; Minton et al., 2019) in the simulations. Instead, we assume that the distal ejecta is deposited uniformly over a circular region. Although Minton et al. (2019) placed con-straints on the strength of energetic distal ejecta degradation needed to produce the observed equilibrium of postmare craters, we allow the strength to vary as a parameter in our simulations for the ancient lunar terrains.
2.5. Modeling Topographic Diffusion With CTEM
In the CTEM models by Minton et al. (2019), topographic diffusion from new impacts is modeled as a linear accumulation of a degradation stateK. Under a classical diffusion model in which the diffusivity,κ, is con-stant over time,t, the degradation state is given byK=κt. In a diffusion‐dominated degradation mode, the moreKa crater accumulates, the shallower it appears. There are two functions to quantify the degradation state of a crater: a visibility functionKv(r) and a degradation functionKdř
. The visibility function quantifies how much degradation is required to fully degrade a crater.
The degradation function, on the other hand, determines how much a single impact event contributes to the degradation of the surrounding surface. Here, each new crater of a radiusřcontributes a certain amount to the degradation stateKof the existing landscape. Geometric crater obliteration, or cookie cutting, can also be described using the degradation state framework. When a large crater completely overlaps a smaller crater, it producesKd ř ¼Kvð Þr .
The area around a new impact that is affected by topographic diffusion from high‐energy ejecta deposits from the formation of a new crater isfinite. In the simulations, we model this in a simplified way using a circular region of radiusfrě, where the extent is controlled by the size of a new crater and the scale factor
fe. Here, the per‐crater contribution to topographic diffusion is spatially averaged and uniformly distributed
across the degradation region (Figure 2). The intensity with which each new impact contributes to the dif-fusive degradation of the preexisting landscape is determined by the degradation function:
Kd ř ¼Kd;1ř ψ
: (3)
The coefficientKd,1 regulates the strength of diffusive degradation, and the slopeψ controls how the per‐crater contribution to topographic diffusion scales with crater size. In this work we setψ= 2 for all the simulations. BecauseKdhas units of m2,ψ= 2 represents a case whereKd,1contains no information Figure 2.This image shows how crater degradation from cookie cutting, proximal ejecta blanketing, and distal ejecta blanketing is modeled in the simulations. In this example, there arefive craters A–E with various degradation states on the modeled surface (Figure 2a). Black indicates that a crater is fresh; light gray means that a crater is highly degraded from diffusive degradation processes. After a new impact of radiusř occurs, some of the preexisting craters are subject to crater degradation (Figure 2b). Here, Crater E is erased due to cookie cutting. The impact craters within the circular degradation region of radiusfeř, C and D, experience diffusive degradation from proximal (Kd,ej) and distal (Kd ř ) ejecta. Dark areas represent a higher contribution to topographic diffusion than bright
areas.Kd ř is uniformly distributed over the degradation region. The influence of proximal ejecta blanketing on topographic diffusion decreases rapidly
about scale. This implies that there is a simple scale dependence in the per‐crater contribution to graphic diffusion. In other words, a tenfold increase in diameter increases a crater's contribution to topo-graphic diffusion by a hundredfold. In such an environment, impact craters exhibit geometric similarity. Accordingly, the relative contribution to topographic diffusion of small craters equals that of large craters. The amount that low‐energy ejecta deposition contributes to diffusive crater degradation depends on the ejecta thicknessh, given by equation 2. Compared to the contribution of diffusive degradation by distal ejecta, proximal ejecta blanketing has little influence on diffusive crater degradation.
Kd;ej¼1:5h2 (4)
When a new impact forms on the modeled terrain, the preexisting craters of radiusrwithin the degradation region accumulate an amount ofKaccording to equations 3 and 4. A crater can accumulate a certain amount ofKbefore it is considered too degraded to be observed and, thus, not countable anymore. The maximum amount ofKthat a crater can accumulate is determined by the visibility function:
Kvð Þ ¼r Kv;1rγ: (5)
The visibility function is calibrated by investigating the depth‐to‐diameter (d/D) ratio of simple craters on a CTEM‐generated surface unit. Minton et al. (2019) used human crater counts to determine a minimumd/D ratio at which diffusively degraded craters are typically not recognized by visual interpretation anymore. By normalizing the minimumd/D ratio with respect toK, they determined a visibility function with the coefficientKv,1= 0.17 and a slopeγ= 2 that describes the maximum amount ofKthat craters can assemble before they are fully degraded. As in theψ= 2 case mentioned above,γ= 2 represents a condition where craters exhibit geometric similarity, sinceKvhas units of m2. This indicates that a tenfold increase in
dia-meter requires a hundredfold increase inKto fully degrade it.
3. Modeling Pre
‐
Nectarian Lunar Surface Evolution Under Various Intensity
Levels of Diffusive Degradation
Minton et al. (2019) applied the diffusion models to investigate the influence of distal ejecta from small sim-ple craters on crater equilibrium. The simulations were conducted under the assumption that craters exhibit geometric similarity. However, because large complex craters are morphologically different from small sim-ple ones (e.g., Kalynn et al., 2013; Pike, 1977; Williams & Zuber, 1998), it is not clear how well geometric similarity approximates both the per‐crater contribution to topographic diffusion as well as the required amount of diffusive degradation to erase a crater.
In order to investigate how topographic diffusion contributes to lunar surface evolution, we model the evo-lution of a pre‐Nectarian surface unit that contains larger craters than those investigated by Minton et al. (2019)—with diameters between 15.4 and 905 km. However, the diffusive effects of craters at all scales down to 12μm in diameter are taken into account during surface evolution (Minton et al., 2019). The model impactor population reproduces the Neukum et al. (2001) crater production function.
For the simple mare craters, Minton et al. (2019) used a“cutoff”value ofd/D= 0.05 as a proxy for a fully degraded simple crater. However, thed/Dof fresh complex craters is shallower than that of small simple cra-ters, such that fresh craters withD> ~80 km would haved/D< 0.05 (Pike, 1977). Clearly, a constantd/D cutoff value is an imperfect proxy for degradation state. Also, currently, CTEM does not model the full mor-phological complexity of complex craters, such as terraced walls and central peaks/peak rings. Thus, it is more difficult to calibrate the crater counting algorithm in a realistic way for complex craters relative to their simple counterparts.
Qualitatively, the shallower initiald/Dand morphological complexity suggest that it would require rela-tively less‐accumulated degradationKto render a complex crater uncountable compared to a simple crater. However, for simplicity, in this study we assume instead that the visibility function parameters are the same for complex craters as simple ones (Kv,1= 0.17 and a slopeγ= 2) and compute the resultingd/Dcutoff value for complex craters as a function of crater size. This should result in somewhat higher observed crater
number densities in our simulations compared to a more realistic treatment, though our results are much more strongly influenced by the degradation function than the visibility function (see the supporting information).
We assume geometric similarity for the degradation function (ψ= 2) and apply three different values forKd,1 to vary the strength of the per‐crater contribution to topographic diffusion. For simplicity, the diffusion from high‐velocity ejecta occurs over a circular degradation region withfe= 10. The modeled surfaces have a
square dimension of 2,000 × 2,000 pixels, with 6,160 km on each side and a resolution of 3.08 km/pixel. Craters smaller than the resolution limit (D< 15.4 km) are not modeled as individual craters but still con-tribute to diffusive degradation. For each pixel, their contribution to topographic diffusion is determined and scaled to the pixel area (Minton et al., 2019). We analyze the crater densities on the modeled surface units and compare the results to observations on pre‐Nectarian surface units in section 4.
3.1. Simulation 1: Strength ofKd,1Corresponds to Mare Observations (Kd,1= 0.003)
Minton et al. (2019) usedKd,1= 0.003,fe= 10, andψ= 2 to model a surface unit that reproduces the crater
equilibrium of the Apollo 15 landing site. In this simulation, we investigate how well the parameterization of the diffusion model scales with increasing crater size and surface age.
3.2. Simulation 2: Strength ofKd,1Is Reduced to 1/30th of the Mare Intensity (Kd,1= 0.0001) In the second simulation, we reduced the strength of the degradation function by a factor of 30 to Kd,1= 0.0001. Here, we investigate how precisely CTEM models a pre‐Nectarian surface unit when the effect of topographic diffusion from secondary impacts is reduced. In this simulation, the relative contribution of cookie cutting and proximal ejecta blanketing to surface evolution is higher than in Simulation 1. 3.3. Simulation 3: No Extra Diffusion From High‐Energy Ejecta Deposits (Kd,1= 0)
We applyKd,1= 0 to investigate the evolution of a pre‐Nectarian surface unit when no topographic diffusion from secondary craters contributes to crater erasure. In this simulation, only the accumulation of proximal ejecta is modeled as a diffusive process. Hence, cookie cutting and proximal ejecta blanketing dominate cra-ter erasure in the third simulation.
4. Results
We simulate the surface evolution of a pre‐Nectarian surface unit in order to constrain how distal topo-graphic diffusion influences the evolution of large craters on the most ancient lunar terrain. To this end, we conduct CSFD measurements on the modeled surfaces and compare the obtained results to lunar surface observations. Because we constrain the production CSFD to be that of the Neukum production function (Neukum et al., 2001), any deviations in the observable CSFD of simulated craters must be the result of size‐dependent crater degradation processes. We consider a modeled surface to be similar to that of a pre‐Nectarian surface unit when (1) the obtained CSFDs do not follow an equilibrium power law, (2) a nota-ble nonsparseness effect is present, and (3) the crater spatial number density is at about 10% geometric saturation (Fassett et al., 2012; Kneissl et al., 2016; Orgel et al., 2018; Povilaitis et al., 2018; Xiao & Werner, 2015).
We use a modified version of CSFD Tools (Riedel et al., 2018) to allow CSFD measurements on the CTEM‐generated Cartesian plane with a repeating boundary condition. The CSFDs of visible craters are measured using the TCC and NSC techniques (Kneissl et al., 2016; Riedel et al., 2018). We consider the non-sparseness effect to be significant when there is a prominent difference between obtained CSFDs from the TCC and NSC approaches. In the NSC approach, we consider only the area within the crater rim as relevant for crater erasure. We do not consider any proximal ejecta blanket in the geometric overlap of preexisting craters.
We use Craterstats (Michael & Neukum, 2010) to analyze the obtained CSFDs in terms of nonsparseness effects, crater equilibrium conditions, and geometric saturation levels. A population is considered to be in equilibrium when the small crater CSFD largely does not follow the CSFD of the produced craters, but a power law function of the form of equation 1. When a population is in equilibrium, we use a least squares fit to determine the parametersaandbof the equilibrium power law. Geometric saturation rates are derived
by comparing the CSFDs and equilibrium functions to a power law witha= 1.54 andb= −2, which describes a geometrically saturated crater population (Gault, 1970; Xiao & Werner, 2015).
4.1. Simulation 1: Strength ofKd,1Corresponds to Mare Observations (Kd,1= 0.003)
In this simulation, we investigate how the degradation parameters that successfully reproduced the surface evolution for the Apollo 15 landing site (Minton et al., 2019) scales with size. Because we assume geometric similarity, craters of all sizes share the same relative contribution to surface degradation and also share the same relative relationship between accumulated degradation and visibility.
Figure 3a shows how the lunar surface would look if large complex craters on the lunar highlands shared the same relative contribution to topographic diffusion as small simple craters on the lunar maria. The modeled terrain appears very smooth with various highly degraded craters. This implies that topographic diffusion has a strong influence on the surface evolution. This is also evident in the obtained CSFDs. Because there is hardly any difference between the SFDs from the TCC and NSC approaches, the nonsparseness effect is negligible. Accordingly, the influence of cookie cutting on crater erasure is low, compared to diffusive processes.
The strong influence of topographic diffusion in combination with the variable sloped CSFD of the produc-tion populaproduc-tion also causes the observed CSFD to reach an equilibrium state that is quite different from what is observed on the lunar surface. For craters smaller than 600 km in diameter, the CSFD follows an equili-brium power law witha= 2.45 * 10−3and a slope ofb=−1.09. This is much shallower than the crater equi-librium for small simple craters on the lunar maria (e.g., Gault, 1970; Hartmann, 1984; Xiao & Werner, 2015). The equilibrium onsetDeq = 600 km occurs at 5.4% geometric saturation. Craters with D= 15 km only exhibit 0.2% geometric saturation.
Overall, both the crater spatial density and the morphology of the modeled surface differ from that on pre‐Nectarian surface units. Figure 4 shows the geometric saturation rates on both the modeled surfaces and the pre‐Nectarian units that Orgel et al. (2018) investigated. In the data set that Orgel et al. (2018) used, craters appear in the densest configuration at diameters of 55–70 km. Here, the crater configuration exceeds 8% geometric saturation (BCC) and 10% geometric saturation (BNSC), respectively. On the modeled terrain, such dense crater configurations do not occur. The crater spatial distribution is densest atDeq= 600 km and becomes less dense with decreasing crater diameter. When we compare the results from this simulation to CSFD analyses on the lunar surface (Fassett et al., 2012; Orgel et al., 2018; Povilaitis et al., 2018), it becomes evident that the influence of topographic diffusion on the evolution of a pre‐Nectarian surface unit is strongly overestimated in this simulation. Accordingly, when normalized by crater size, the relative contri-bution to topographic diffusion from secondary impacts must be lower for larger crater diameters than it is for the small simple craters that Minton et al. (2019) investigated.
4.2. Simulation 2: Strength ofKd,1Is Reduced to 1/30th of the Mare Intensity (Kd,1= 0.0001) Because the per‐crater contribution to topographic diffusion was overestimated in Simulation 1, we next investigate a scenario in which we reduce the strength of the contribution of distal degradation. In afirst study, we reduced the degradation function coefficient by 1 order of magnitude to make the scaling more intuitive. However, we found that the surface evolution models were still strongly dominated by topographic diffusion. For this reason, we further reducedKd,1by 1/30th of the value of Simulation 1.
Figure 3b shows that the modeled terrain of Simulation 2 has a rougher surface than that of Simulation 1 (Figure 3b). However, the obtained SFDs from NSC and TCC continue to coincide. This indicates that the nonsparseness effect is still negligible and that the effects of topographic diffusion continue to dominate cra-ter erasure. For cracra-ters withD< 150 km, the obtained SFDs transition into an equilibrium state where the SFDs follow a function with a discontinuous slope.
The CSFDs of large craters follow a steeper equilibrium power law than the CSFDs of smaller craters. We approximate the equilibrium condition by fitting two power law functions to the CSFD. One function approximates the steeper part of the CSFD for craters between 40 and 150 km in diameter. A second function approximates the shallower part of the CSFD for craters with 15 to 40 km in diameter. We determined a power law function witha= 7.94 * 10−3andb= −1.46, which describes the steep part and a function with a= 3.55 * 10−4andb=−0.6, which describes the shallow part of the CSFD in equilibrium. Both slopes are
much shallower than those observed for crater equilibrium on the lunar maria (e.g., Hartmann, 1984; Xiao & Werner, 2015). The equilibrium onsetDeq= 150 km occurs at 7.7% geometric saturation. The transition to the shallower equilibrium power law atDeq= 40 km occurs at 4% geometric saturation. Craters with a dia-meter of 15 km appear in a configuration of 1% geometric saturation. Here, craters occur at a denser Figure 3.Modeled terrains with obtained cumulative and relative size‐frequency distributions. Each row represents the results of one simulation. The results of (a) Simulation 1:Kd,1= 0.003; (b) Simulation 2:Kd,1= 0.0001; and (c) Simulation 3:Kd,1= 0. The CSFDs are illustrated in a log binning. SFDs of produced craters (gray) follow an isochron of the Neukum et al. (2001) production function that corresponds to a model age of 4.25 Ga. Note that the scale of the modeled terrain is different than in Figure 1a.
configuration than in Simulation 1. However, the crater saturation levels on the modeled terrain are different from the pre‐Nectarian surface units that Orgel et al. (2018) investigated (see Figure 4). In this simulation, craters larger than 100 km in diameter are in a much denser configuration than those observed on pre‐Nectarian units. Craters of 15–100 km in diameter, on the other hand, are in a less‐dense configuration. This indicates that the topographic diffusion by distal ejecta continues to dominate crater erasure. Therefore, the relative contribution to topographic diffusion for craters larger than 15 km in diameter must be less than 1/30th of that of small simple craters.
4.3. Simulation 3: No Extra Diffusion From High‐Energy Ejecta Deposits (Kd,1= 0)
Kd,1= 0 represents a scenario in which no topographic diffusion from distal ejecta contributes to the evolu-tion of a pre‐Nectarian surface unit. Hence, cookie cutting and proximal ejecta blanketing are the only pro-cesses that lead to crater erasure. Since there is only little smoothening from diffusive propro-cesses through proximal ejecta blanketing, the modeled terrain appears very rugged (Figure 3c). This indicates that cookie cutting dominates crater erasure in this simulation.
The strong influence of cookie cutting is also apparent in the obtained SFDs. Here, the application of NSC leads to an increase in crater frequencies and to a better representation of crater production over the TCC approach. This is consistent with the observations by Orgel et al. (2018) and shows that a cookie cutting‐dominated crater degradation environment causes the nonsparseness effect. In this regime, the num-ber of visible craters is lower than the numnum-ber of produced craters. In contrast to crater equilibrium, however, the crater densities continue to increase as the bombardment progresses. For this reason, craters on the simu-lated terrain are in a much denser configuration compared to Simulations 1 and 2 (Figure 4). Craters of 15– 200 km in diameter are at a spatial number density of 9.1–16.4% (TCC) and 9.6–21.8% (NSC) geometric saturation. The crater configuration is densest for craters around 40 km (TCC) and 30 km in diameter (NSC). This roughly corresponds to the diameter range in which the crater density in the areas studied by Orgel et al. (2018) is highest. However, the crater density on pre‐Nectarian surface units is lower than in this simulation (Orgel et al., 2018; Povilaitis, 2018). Accordingly, craters on the modeled surface unit persist much longer than on the Moon. This implies that although we can simulate a surface evolution that reproduces the nonsparseness effect and no crater equilibrium, we clearly underestimate the intensity of crater degradation when we ignore the diffusive effects of high‐velocity ejecta on lunar surface evolution.
5. Interpretations
The simulations in this work, together with lunar surface investigations, reveal that there are two different crater degradation environments on the Moon. In one regime, topographic diffusion dominates the Figure 4.Geometric saturation levels of craters on simulated and observed pre‐Nectarian surface units. Crater densities determined using traditional CSFD measurement techniques (TCC and BCC) are represented in a darker hue than their comparative populations, which were determined using geometric corrections (NSC and BNSC).
degradation of existing craters; in another regime, cookie cutting dominates the erasure of preexisting cra-ters. The former causes the CSFDs to follow an equilibrium power law; the latter leads to the nonsparseness effect, where the application of NSC results in a better recovery of the production function. Crater equili-brium, wherein the CSFD follows an equilibrium power law withb~−2, has been observed for small simple craters (e.g., van der Bogert et al., 2017 Gault, 1970; Hartmann, 1984; Xiao & Werner, 2015). Nonsparseness, on the other hand, affects large craters on pre‐Nectarian surface units (Kneissl et al., 2016; Orgel et al., 2018; Riedel et al., 2018). This indicates that the different crater degradation environments depend on both crater size and surface age. When Minton et al. (2019) concluded that the high‐energy deposition of distal ejecta is the primary process that causes crater equilibrium, they modeled the surface evolution for craters with D≤200 m. Craters in this size range are morphologically similar (Pike, 1977) and may be expressed by a sim-ple scale dependence where craters exhibit geometric similarity. When we applied the same parameteriza-tion to craters withD> 15 km in Simulation 1, we did not generate a surface that is consistent with a pre‐Nectarian surface unit with nonsparseness. Instead, we generated a surface unit in which the CSFD fol-lows an equilibrium power law. The same happened when we reduced the per‐crater contribution to topo-graphic diffusion to 1/30th compared to thefirst simulation.
Only when we ignored the effects of distal ejecta on topographic diffusion were we able to simulate a pre‐Nectarian surface unit that is to some extent consistent with the observations by Orgel et al. (2018). This illustrates that the simple scale dependence that controls diffusive crater degradation, indicated by
ψ= 2, cannot account for lunar surface evolution of both small and large craters alike. In other words, rela-tive to their size, large complex craters are less destrucrela-tive to the surrounding terrain than small simple cra-ters, as postulated by Povilaitis et al. (2018). Minton et al. (2019) used ψ = 2 to model the per‐crater contribution to the degradation state K for craters withD≤200 m. The investigations by Xie et al. (2017) and Fassett et al. (2018) suggest that the size‐dependent diffusivityκ that mare craters with diameters 800 m≤D≤2 km experienced over time goes asκ∝D~0.9. In an environment where the production and degradation function can be approximated by a power law with a constant slope, this corresponds to a sce-nario in which the average per‐crater contribution to the degradation state K can also be approximated by
ψ= 2 (see the supporting information).
The simulations presented in this paper, in turn, show that the surface evolution of craters withD> 15 km corresponds most closely to a pre‐Nectarian surface unit when the extra diffusion caused by distal ejecta is significantly reduced. This scenario is equivalent to a diffusivity exponent ofψ< 2. Thus, as the relative per‐crater contribution to diffusive degradation decreases with increasing crater size, the exponentψmust be scale dependent. In order to determine a scale‐dependentψthat is equally valid for small and large cra-ters, further studies of the lunar surface, particularly on the transition between the cookie cutting and the diffusion‐dominated crater degradation environments, are required. The same applies to the slope of the vis-ibility functionγ. In theγ= 2 case, the relative amount of accumulatedKthat is needed to fully degrade a crater is the same for craters of any size. Such simple scale dependence does not take into account the mor-phologic differences of simple and complex craters, such asd/Dratios (Pike, 1977). It can be expected that the size‐dependent morphological properties influence the amount ofKthat is needed in order to completely degrade a crater. As the visibility of a crater depends on itsd/Dratio, it is very likely thatγis scale dependent as well. However, this requires further studies on thed/Drelated crater visibility of complex craters.
6. Conclusions
In this work, we simulated the surface evolution of a pre‐Nectarian surface unit to investigate how topo-graphic diffusion affects the evolution of the earliest lunar terrains. We used a simple scale dependence to describe both the per‐crater contribution to diffusion and the per‐crater requirement for erasure by diffusion. We conclude that such simple scale dependence cannot account for crater erasure of small simple and large complex craters alike and that, relative to their size, large craters are less destructive to their environment than small craters. This circumstance leads to a diffusion‐dominated degradation regime for small craters and a cookie cutting‐dominated degradation regime for large craters. Thus, the exponent, which controls dif-fusion in our simulations, must be scale dependent. A simple scale dependence in the per‐crater contribution to topographic diffusion (indicated byψ= 2) can only account for the evolution of a diffusion‐dominated crater equilibrium, which typically affects small simple craters. Thus, we assume that the diffusion
exponent must decrease with increasing crater diameter. However, in order to determine a realistic model that accounts for the surface evolution of small simple and large complex craters alike, further investigations on the transition between a cookie cutting and a diffusion‐dominated crater degradation regime on the lunar surface need to be conducted.
References
Baldwin, R. B. (1964). Lunar crater counts.The Astronomical Journal,69(5), 377–392. https://doi.org/10.1086/109289
Boehnke, P., & Harrison, T. M. (2016). Illusory late heavy bombardments.Proceedings of the National Academy of Science,113(39), 10802–10806. https://doi.org/10.1073/pnas.1611535113
Bottke, W. F., Vokrouhlický, D., Minton, D. A., Nesvorný, D., Morbidelli, A., Brasser, R., et al. (2012). An Archean heavy bombardment from a destabilized extension of the asteroid belt.Nature,485(7396), 78–81. http://doi.org/10.1038/nature10967
Craddock, R. A., & Howard, A. D. (2000). Simulated degradation of lunar impact craters and a new method for age dating farside mare deposits.Journal of Geophysical Research,105, 20,387–20,402. https://doi.org/10.1029/1999JE001099
Crater Analysis Techniques Working Group (1979). Standard techniques for presentation and analysis of crater size‐frequency data.Icarus,
37(2), 467–474. https://doi.org/10.1016/0019‐1035(79)90009‐5
Elliott, J. R., Huang, Y.‐H., Minton, D. A., & Freed, A. M. (2018). The length of lunar crater rays explained using secondary crater scaling.
Icarus,312, 231–246. https://doi.org/10.1016/j.icarus.2018.04.015
Fassett, C. I., Head, J. W., Kadish, S. J., Mazarico, E., Neumann, G. A., Smith, D. E., & Zuber, M. T. (2012). Lunar impact basins: Stratigraphy, sequence and ages from superposed impact crater populations measured from Lunar Orbiter Laser Altimeter (LOLA) data.
Journal of Geophysical Research,117, E00H06. https://doi.org/10.1029/2011JE003951
Fassett, C. I., Head, J. W., Smith, D. E., Zuber, M. T., & Neumann, G. A. (2011). Thickness of proximal ejecta from the Orientale Basin from lunar Orbiter laser altimeter (LOLA) data: Implications for multi‐ring basin formation.Geophysical Research Letters,38, L17201. https:// doi.org/10.1029/2011gl048502
Fassett, C. I., Minton, D. A., Thomson, B. J., Hirabayashi, M., & Watters, W. A. (2018). Re‐analysis of observations of crater degradation on the lunar maria accounting for anomalous diffusion. InPaper presented at 49th Lunar and Planetary Science Conference (LPI Contrib. No. 2083). The Woodlands: TX.
Fassett, C. I., & Thomson, B. J. (2014). Crater degradation on the lunar maria: Topographic diffusion and the rate of erosion on the Moon.
Journal of Geophysical Research: Planets,119, 2255–2271. https://doi.org/10.1002/2014JE004698
Gault, D. E. (1970). Saturation and equilibrium conditions for impact cratering on the lunar surface: Criteria and implications.Radio Science,5(2), 273–291. https://doi.org/10.1029/rs005i002p00273
Gomes, R., Levison, H. F., Tsiganis, K., & Morbidelli, A. (2005). Origin of the cataclysmic late heavy bombardment period of the terrestrial planets.Nature,435(7041), 466–469. https://doi.org/10.1038/nature03676
Hartmann, W. K. (1984). Does crater“saturation equilibrium”occur in the solar system?Icarus,60, 56–74. https://doi.org/10.1016/ 0019‐1035(84)90138‐6
Hartmann, W. K. (1995). Planetary cratering I: Lunar highlands and tests of hypotheses on crater populations.Meteoritics,30, 451–467. https://doi.org/10.1111/j.1945‐5100.1995.tb01152.x
Hartmann, W. K. (2019). History of the terminal cataclysm paradigm: Epistemology of a planetary bombardment that never (?) happened.
Geosciences,9(7), 285–361. https://doi.org/10.3390/geosciences9070285
Hartmann, W. K., & Gaskell, R. W. (1997). Planetary cratering 2: Studies of saturation equilibrium.Meteoritics,32, 109–121. https://doi.org/ 10.1111/j.1945‐5100.1997.tb01246.x
Hiesinger, H., van der Bogert, C. H., Pasckert, J. H., Funcke, L., Giacomini, L., Ostrach, L. R., & Robinson, M. S. (2012). How old are young lunar craters?Journal of Geophysical Research,117, E00H10. https://doi.org/10.1029/2011JE003935
Hirabayashi, M., Minton, D. A., & Fassett, C. I. (2017). An analytical model of crater count equilibrium.Icarus,289, 134–143. https://doi. org/10.1016/j.icarus.2016.12.032
Huang, Y.‐H., Minton, D. A., Hirabayashi, M., Elliott, J. R., Richardson, J. E., & Fassett, C. I. (2017). Heterogeneous impact transport on the Moon.Journal of Geophysical Research: Planets,122(6), 1158–1180. https://doi.org/10.1002/2016JE005160
Kalynn, J., Johnson, C. L., Osinski, G. R., & Barnouin, O. (2013). Topographic characterization of lunar complex craters.Geophysical Research Letters,40, 38–42. https://doi.org/10.1029/2012GL053608
Kneissl, T., Michael, G. G., & Schmedemann, N. (2016). Treatment of non‐sparse cratering in planetary surface dating.Icarus,277, 187–195. https://doi.org/10.1016/j.icarus.2016.05.015
Liu, T., Michael, G. G., Engelmann, J., Wünnemann, K., & Oberst, J. (2019). Regolith mixing by impacts: Lateral diffusion of basin melt.
Icarus,321, 691–704. https://doi.org/10.1016/j.icarus.2018.12.026
Marchi, S., Bottke, W. F., Kring, D. A., & Morbidelli, A. (2012). The onset of the lunar cataclysm as recorded in its ancient crater popula-tions.Earth and Planetary Science Letters,325‐326, 27–38. https://doi.org/10.1016/j.epsl.2012.01.021
McGetchin, T. R., Settle, M., & Head, J. W. (1973). Radial thickness variation in impact crater ejecta: Implications for lunar basin deposits.
Earth and Planetary Science Letters,20(2), 226–236. https://doi.org/10.1016/0012‐821X(73)90162‐3 Melosh, H. J. (1989).Impact Cratering: A Geologic Process. New York, NY: Oxford University Press.
Michael, G. G., Basilevsky, A., & Neukum, G. (2018). On the history of the early meteorite bombardment of the Moon: Was there a terminal lunar cataclysm?Icarus,2018(302), 80–103. https://doi.org/10.1016/j.icarus.2017.10.046
Michael, G. G., & Neukum, G. (2010). Planetary surface dating from crater size‐frequency distribution measurements: Partial resurfacing events and statistical age uncertainty.Earth and Planetary Science Letters,294(3–4), 223–229. https://doi.org/10.1016/j. epsl.2009.12.041
Minton, D. A., Fassett, C. I., Hirabayashi, M., Howl, B. A., & Richardson, J. E. (2019). The equilibrium size‐frequency distribution of small craters reveals the effects of distal ejecta on lunar landscape morphology.Icarus,326, 63–87. https://doi.org/10.1016/j. icarus.2019.02.021
Minton, D. A., Richardson, J. E., & Fassett, C. I. (2015). Re‐examining the main asteroid belt as the primary source of ancient lunar craters.
Icarus,247, 172–190. https://doi.org/10.1016/j.icarus.2014.10.018
Neukum, G. (1983).Meteoritenbombardement und Datierung planetarer Oberflächen, (Habilitation thesis). Munich, Germany: Ludwig‐Maximilians‐Universität München.
Acknowledgments
We thank Brad Thomson and an anonymous reviewer for their helpful comments to improve this manuscript. We also thank Alicia Neesemann and Caleb Fassett for the helpful discussions. C. R. and C. O. were supported by German Research Foundation SFB‐TRR 170, Subproject A03‐95. G. M. was supported by the German Aerospace Center (DLR), Grant 50QM1702. H. H. and C. H. vdB were supported by DLR Project 50OW1504. The associated data are available via Mendeley Data (doi: 10.17632/xphn7c7scs.1).
Neukum, G., & Ivanov, B. A. (1994). Crater size distributions and impact probabilities on Earth from lunar, terrestrial‐planet, and asteroid cratering data. In T. Gehrels, M. S. Matthews, & A. Schumann (Eds.),Hazards due to comets and asteroids(pp. 359–416). Tuscon, AZ: University of Arizona Press.
Neukum, G., Ivanov, B. A., & Hartmann, W. K. (2001). Cratering records in the inner solar system in relation to the lunar reference system.
Space Science Reviews,96(1/4), 55–86. https://doi.org/10.1023/A:1011989004263
Öpik, E. J. (1960). The lunar surface as an impact counter.Monthly Notices of the Royal Astronomical Society,120(5), 404–411. https://doi. org/10.1093/mnras/120.5.404
Orgel, C., Michael, G. G., Fassett, C. I., van der Bogert, C. H., Riedel, C., Kneissl, T., & Hiesinger, H. (2018). Ancient bombardment of the inner solar system—Reinvestigation of the‘fingerprints’of different impactor populations on the lunar surface.Journal of Geophysical Research: Planets,123, 748–762. https://doi.org/10.1002/2017JE005451
Pike, R. J. (1977). Apparent depth/diameter relations for lunar crater. InPaper presented at 8th Lunar Science Conference(pp. 427–3436). Houston: TX.
Povilaitis, R. Z., Robinson, M. S., van der Bogert, C. H., Hiesinger, H., Meyer, H. M., & Ostrach, L. R. (2018). Crater density differences: Exploring regional resurfacing, secondary crater populations, and crater saturation equilibrium on the Moon.Planetary and Space Science,162, 41–51. https://doi.org/10.1016/j.pss.2017.05.006
Richardson, J. E. (2009). Cratering saturation and equilibrium: A new model looks at an old problem.Icarus,204(2), 697–715. https://doi. org/10.1016/j.icarus.2009.07.029
Riedel, C., Michael, G., Kneissl, T., Orgel, C., Hiesinger, H., & van der Bogert, C. H. (2018). A new tool to account for crater obliteration effects in crater sizefrequency distribution measurements.Earth and Space Science,5, 258–267. https://doi.org/10.1002/2018EA000383 Ross, H. P. (1968). A simplified mathematical model for lunar crater erosion.Journal of Geophysical Research,73, 1343–1354. https://doi.
org/10.1029/JB073i004p01343
Soderblom, L. A. (1970). A model for small‐impact erosion applied to the lunar surface.Journal of Geophysical Research,75(14), 2655–2661. https://doi.org/10.1029/JB075i014p02655
Speyerer, E. J., Povilaitis, R. Z., Robinson, M. S., Thomas, P. C., & Wagner, R. V. (2016). Quantifying crater production and regolith overturn on the Moon with temporal imaging.Nature,538(7624), 215–218. https://doi.org/10.1038/nature19829
Stöffler, D., & Ryder, G. (2001). Stratigraphy and isotope ages of lunar geologic units: Chronological standard for the inner solar system.
Space Science Reviews,96(1/4), 9–54. https://doi.org/10.1023/A:1011937020193
Stöffler, D., Ryder, G., Ivanov, B. A., Artemieva, N. A., Cintala, M. J., & Grieve, R. A. F. (2006). Cratering history and lunar chronology. In B. L. Jolliff, M. A. Wieczorek, C. K. Shearer, & C. R. Neal (Eds.),New views of the Moon: Reviews in mineralogy and geochemistry(Vol. 60, pp. 519–596). Washington, DC: Mineralogical Society of America. https://doi.org/10.2138/rmg.2006.60.05
Strom, R. G., Malhotra, R., Ito, T., Yoshida, F., & Kring, D. A. (2005). The origin of planetary impactors in the inner solar system.Science,
309(5742), 1847–1850. https://doi.org/10.1126/science.1113544
Strom, R. G., Malhotra, R., Xiao, Z.‐Y., Ito, T., Yoshida, F., & Ostrach, L. R. (2015). The inner solar system cratering record and the evolution of impactor populations.Research in Astronomy and Astrophysics,15(3), 407–434. https://doi.org/10.1088/1674‐4527/15/3/009 Tanaka, K. L. (1982).A new time‐saving crater‐count technique with application to narrow features. In Reports of Planetary Geology Program
(NASA Technical Memorandum 85127, pp. 123–125). Washington, DC: NASA.
Tera, F., Papanastassiou, D. A., & Wasserburg, G. J. (1974). Isotopic evidence for a terminal lunar cataclysm.Earth and Planetary Science Letters,22, 1–21. https://doi.org/10.1016/0012‐821X(74)90059‐4
van der Bogert, C. H., Hiesinger, H., Dundas, C. M., Krüger, T., McEwen, A. S., Zanetti, M., & Robinson, M. S. (2017). Origin of discre-pancies between crater size‐frequency distributions of coeval lunar geologic units via target property contrasts.Icarus,298, 49–63. https://doi.org/10.1016/j.icarus.2016.11.040
Williams, K. K., & Zuber, M. T. (1998). Measurement and analysis of lunar basin depths from clementine altimetry.Icarus,131, 107–122. https://doi.org/10.1006/icar.1997.5856
Woronow, A. (1977). Crater saturation and equilibrium—A Monte Carlo simulation.Journal of Geophysical Research,82, 2447–2456. https://doi.org/10.1029/JB082i017p02447
Woronow, A. (1985). A Monte Carlo study of parameters affecting computer simulations of crater saturation density.Journal of Geophysical Research: Solid Earth,90, 817–824. https://doi.org/10.1029/JB090iS02p0C817
Xiao, Z., & Werner, S. C. (2015). Size‐frequency distribution of crater populations in equilibrium on the Moon.Journal of Geophysical Research: Planets,120, 2277–2292. https://doi.org/10.1002/2015JE004860
Xie, M., Zhu, M.‐H., Xiao, Z., Wu, Y., & Xu, A. (2017). Effect of topography degradation on crater size‐frequency distributions: Implications for populations of small craters and age dating.Geophysical Research Letters,44, 10,171–10,179. https://doi.org/10.1002/2017GL075298