Rainfall Prediction Using Hybrid Adaptive
Neuro-Fuzzy Inference System (ANFIS)
and Genetic Algorithm
Ida Wahyuni
1, Wayan Firdaus Mahmudy
1, Atiek Iriany
2 1Faculty of Computer Science, Brawijaya University, Indonesia. 2Faculty of Mathematics and Natural Sciences, Brawijaya University, Indonesia.Abstract—Tengger Indonesia is one of the rich areas in
agricultural commodities and one of its commodities is potatoes. In the process of planting potatoes, rainfall data is used to determine the most appropriate planting time in order to harvest the maximum yield. However, the current rainy season is erratic and very difficult to predict the planting time, especially in the area of Tengger. It requires a method that can predict rainfall with the smallest error as possible. Adaptive Neuro-Fuzzy Inference System (ANFIS) is one of the prediction methods that are quite reliable because it is equipped with a network that can learn. The ANFIS uses Sugeno FIS in its architecture. To improve the prediction results, the Sugeno FIS will be optimized in boundaries of membership function and coefficient consequent rule before it goes into the process of training with ANFIS. A genetic algorithm is used for the optimization process. The results of rainfall prediction using hybrid ANFIS-GA are proven to produce smaller RMSE of rainfall prediction method that has never been done before.
Index Terms—Prediction; Rainfall; ANFIS; Genetic
Algorithm; Sugeno FIS; ANFIS-GA.
I. INTRODUCTION
Rainfall data is an important aspect in the field of agriculture. In agriculture, rainfall data is used to determine the planting season and plant species suitable for planting [1]. One of the large agricultural areas in Indonesia is Tengger, East Java, where many of potential agricultural areas for the commodity is potato [2]. Potato plants are very dependent on rainfall in the planting process, but due to the current rainy season rainfall is erratic and very difficult to predict, resulting in the planting of potatoes, especially in the area of Tengger be disturbed [3].
The influence of climate change impact on the uncertainty of rainfall has a significant influence on the results of potatoes productivity from year to year [4]. According to Indriantoro [4], the average yields of potato production in 2004 (the year before climate change) was 14.165 kg/ha. The yields were higher when compared to the average production of potatoes in 2010 (the year after climate changes), which only amounted to 10.580 kg/ha. So, it needs an appropriate calculation to predict the rainfall so that the problem can be solved.
Rainfall prediction was made by Iriany, et.al [3] using
Generalized Model Space-Time Autoregressive-Seemingly Unrelated Regression (GSTAR-SUR). The research was conducted at the predicted rainfall Tengger areas in four districts namely Puspo, Sumber, Tosari and Tutur. The value of the root mean square error (RMSE) in Tutur area is still
high, it was 10.89. In addition, the rainfall prediction in the same place has also been done by Wahyuni, Mahmudy, Iriany [5] using Tsukamoto Fuzzy Inference System (FIS) with smaller RMSE values in Tutur area which was 8.64. Hybrid Tsukamoto FIS with genetic algorithm method also has been done by Wahyuni & Mahmudy [6] to predict rainfall in the same location and obtained smaller RMSE value in Tutur area, it was 6.63. The methods used to predict rainfall is already quite good but still, has some weaknesses. One of the disadvantages is the error value or RMSE at yield is still quite high.
The hybrid method with the new approach for the prediction process already widely introduced. One of the hybrid methods with new approaches was introduced by Li and Su [7]. The research introduced a hybrid Adaptive Hierarchical Genetic Algorithm-Network-Based Fuzzy Inference System (GA-HANFIS) method. In that method, the basic parameters of clustering and rule base are optimized by GAs and Neural Networks (NNs). The model was applied to predict the daily consumption of air conditioning at a hotel in a period of more than three months. The results obtained by the proposed model and compared with the usual methods of NNs, indicating that the model GA-HANFIS have better performance than the NNs in terms of a prediction for the better accuracy.
This paper also introduces a new approach. which is the hybrid Adaptive Neuro-Fuzzy Inference System with Genetic Algorithm (ANFIS-GA) for prediction of rainfall. Genetic Algorithm is used to optimize the boundaries of membership function and the consequent coefficient rule of Sugeno before it goes into the process of training the ANFIS. Time series data that will be used for the prediction is the rainfall data.
II. METHODOLOGY
A. Modeling of Sugeno Fuzzy Inference System (FIS) a. Input Parameter
Before calculating the Sugeno FIS, it needs to determine the range of parameter value of data that will be used as input criteria for rainfall prediction. First, modeling used two input parameters of the data of rainfall on a time lag T-1 or the rainfall data over 10 days and T-2 or the rainfall data for 20 days. Based on the data obtained, then made a range of values of input parameters are shown in Table 1.
Table 1
Input Parameter Value Range Sugeno FIS No Input Parameter Range 1 Rainfall T-1(R T-1) 0.0 – 40.0 2 Rainfall T-2(R T-2) 0.0 – 40.0
b. Fuzzy Association (Fuzzy Sets)
Fuzzy sets can be defined as an entity that represents a particular state in fuzzy variables [5]. In this study, the use of fuzzy sets with two linguistic values, low and high. Formation of fuzzy sets adapted to input parameters used for forecasting rainfall. Linguistic value combined with fuzzy sets, each of which has a membership function that has been defined [5]. Data of fuzzy sets and linguistic values for the input parameters are shown in Table 2.
Table 2
Range of Input Parameter Value Sugeno FIS Fuzzy Sets
No Input Parameters Linguistic Values 1 Rainfall T-1 (R T-1) Low and High 2 Rainfall T-2 (R T-2) Low and High
c. Fuzzification
Fuzzification is a process for calculating crisp values or input values to degrees of membership. Calculations in fuzzification process based on the boundaries of the membership functions [5]. Membership functions of fuzzy sets with two input parameters shown in Figure 2.
Figure 2: Membership Function of Rainfall T-1 and Rainfall T-2
d. Fuzzy Inference System
Fuzzy Inference System (FIS) is a system that performs a calculation based on the concept of fuzzy set theory, fuzzy rules, and the concept of fuzzy logic [8]. Sugeno FIS method of forming a rules-based or rule base in the form of "causation" or "if-then". Sugeno FIS has a characteristic that is consistent. The output value is not a set of fuzzy linguistics but in the form of linear equations with variables corresponding to the input variables [9]. Base rules or rule base of fuzzy rules for rainfall prediction using 4 rules. Examples of the rule base to two input parameters are as follows:
IFR T-1= lowANDR T-2 = low
THENT = p1 * R T-1 + q1 * R T-2 + r1
B. Modeling Adaptive Neuro-Fuzzy Inference System (ANFIS)
The modeling of Adaptive Neuro-Fuzzy Inference System (ANFIS) begins by determining the parameters of ANFIS include the learning rate and the number of epoch or a stage direction of learning that takes place in the adaptive network, e.g. one step toward learning called the epoch. In this study the value of learning rate is 0.7, the value is taken based on testing conducted by Santika, Mahmudy, and Naba [10],
which tested the most optimal learning rate for the electrical load prediction. While the number of epoch used is 100, the benchmark epoch number is considered the most optimal according to research conducted by Jang [11]. Representation of ANFIS architecture with two input parameters are shown in Figure 3. x y A1 ∏ ∏ ∏ ∏ A2 B1 B2 Z Z Z Z N N N N ∑ Output
Figure 3: Architecture ANFIS with Two Input Parameter
ANFIS architecture design is in the fifth layer as follows:
a. Layers 1 (Membership Function)
Each node i in this layer is an adaptive node to node function as shown in Equation (1).
𝑂1,𝑖= 𝜇𝐴𝑖(𝑥), 𝑓𝑜𝑟 𝑖 = 1, 2 𝑎𝑛𝑑
𝑂1,𝑖= 𝜇𝐵𝑖−2(𝑦), 𝑓𝑜𝑟 𝑖 = 3, 4 (1)
where x and y are input at node i, 𝐴𝑖 and 𝐵𝑖 is the linguistic
label that is low and high. In other words O1,i and O1,i-2 is the
membership functions of 𝐴𝑖 and 𝐵𝑖 for specifies the degree
of membership x and y against. The membership function
𝜇𝐴1(𝑥) and 𝜇𝐵1(𝑥) is based on the equation linear curve with
one max value is 1 and min value is 0. The parameters of the membership function A curve can be approximated by a triangle or triangular membership function, which is shown in Equation (2), where a, b and c are parameters premise membership functions. Although a types of membership functions used in this layer is Gaussian or generalize Bell because they provide a more subtle and non-zero [12], but according to Jang [13] type of membership function triangular or trapezoidal is the membership function of qualified and can be used also in a single layer. For the case of rainfall prediction, the most appropriate membership function is triangular as much data as a value of 0.
𝜇𝐴𝑖 (𝑥) = { 0; 𝑥 ≤ 𝑎𝑖 𝑜𝑟 𝑥 ≥ 𝑐 𝑥−𝑎𝑖 𝑏𝑖−𝑎𝑖; 𝑎𝑖 ≤ 𝑥 ≤ 𝑏𝑖 𝑏𝑖−𝑥 𝑐𝑖−𝑏𝑖; 𝑏𝑖 ≤ 𝑥 ≤ 𝑐𝑖 (2)
b. Layer 2 (Rules Layer)
Each node in this layer is a fixed node or nodes non-adaptive. The output obtained is the product of all the inputs that go in this layer. To calculate the output can be used Equation (3).
𝑂2,𝑖 = 𝑤𝑖 = 𝐴𝑖(𝑥) . 𝐵𝑖(𝑦) 𝑤ℎ𝑒𝑟𝑒 𝑖 = 1, 2 (3)
Each output node states degrees activation (firing strength) of each fuzzy rule. The number of vertices in this layer of the numbers of established rules, under which the rules established, is 4 rules.
c. Layer 3 (Normalized Firing Strength)
Each node in this layer is a fixed node or nodes non-adaptive that displays degrees normalized firing strength is the ratio of the output node i on the previous layer to the entire output of the previous layer. The equation of normalized firing strength for two inputs is shown in Equation (4).
𝑂3,𝑖 = 𝑤
̅
𝑖 = 𝑤𝑖∑16𝑖=1𝑤𝑖 𝑤ℎ𝑒𝑟𝑒 𝑖 = 1, 2, … , 4 (4) d. Layer 4 (Defuzzification)
Each node in this layer is an adaptive node to node function shown in Equation (5).
𝑂4,𝑖= 𝑤̅𝑖𝑓𝑖 = 𝑤̅𝑖(𝑝𝑖𝑥 + 𝑞𝑖𝑦 + 𝑟𝑖 ) (5)
The weight resulting from layer 3 and expressed parameter consequent adaptive with two input parameters. The process of calculating the coating is done by linear regression function of order 1.
e. Layer 5 (Addition)
The function of this layer is to add up all the inputs. The sum function is shown in Equation (6).
𝑂5,𝑖 =
∑
𝑤̅
𝑖𝑓𝑖 = ∑𝑖𝑤𝑖𝑓𝑖∑𝑖𝑤𝑖
𝑖 (6)
C. Modeling Hybrid ANFIS-GA a. Chromosomes Representation
The initial step before the process determines the genetic algorithm chromosome representation. A chromosome is a representation of solution that is encoded into a character called genes [14]. In this research, the chromosome is formed with the representation of real numbers or real code inside an array [15].
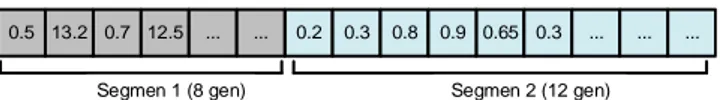
The models with two input parameters, use the arrangement of 20 genes or genotypes of chromosomes. Chromosomes are divided into two segments; the first 8 genes encoding is used to boundaries of membership functions Sugeno and the second 12 genes encoding used to encode the coefficients of the linear equations consequent Sugeno rule. Illustration of the chromosome with two inputs parameter shown in Figure 4.
0.5 13.2 0.7 12.5 ... ... 0.2 0.3 0.8 0.9 0.65 0.3 ... ... ... Segmen 1 (8 gen) Segmen 2 (12 gen)
Figure 4: Illustration of Chromosomes with Two Inputs Parameter
Each chromosome is randomly generated by random real number with a corresponding range of input parameter value range. An example representation of the chromosome using real code is shown in Figure 6. In Figure 5 is exemplified representation of chromosome 15 gene to facilitate the calculation sample.
0.5 13.2 0.7 12.5 1.2 23.8 0.2 0.3 0.8 0.9 0.65 0.3 0.33 0.230.45
Figure 5: Sample Representation of Chromosomes
b. Initialization of Population
Initialization of population is a step that was first
performed during the process of the genetic algorithm. The total population of the genetic algorithm is often called the variable popSize. In this model, population number used is 200 chromosomes, the benchmark refers to the number of previous studies which stated that the results of the optimization optimum result obtained on a total population of 200 chromosomes [6]. For example, the population will be shaped by three chromosomes or can be the size of a population of 3 from C1 ... C n, where n=3. Illustration of the population initialization is shown in Figure 6.
0.5 13.2 0.7 12.5 1.2 23.8 0.2 0.3 0.8 0.9 0.65 0.3 0.330.23 0.45 0.7 16.7 0.34 23.9 0.9 33.8 0.7 0.35 0.23 0.7 0.13 0.53 0.43 0.23 0.27 0.4 13.5 2.4 34.1 3.1 23.8 0.34 0.12 0.8 0.6 0.41 0.9 0.040.07 0.43
Figure 6: Example of Population Initialization in GAs
c. Fitness Calculation
The fitness function is used to measure the quality of the solution [16]. The process of calculating the value of fitness, in this case, was done by applying predictive process with ANFIS. By applying ANFIS calculation process, it can be seen the chromosome that produces the smallest error or the best chromosome. The solution is sought in the case of optimization problems boundaries of membership functions Sugeno and consequent coefficient Sugeno rule is the most minimal error, so that the calculation of the fitness value (f) expressed in Equation (7). To determine the error, it uses the formula of RMSE expressed in Equation (8). In the counting process must be known RMSE error value between the actual rainfall data with the data of rainfall predicted outcome [17]. Error formula used is expressed in Equation (9).
𝐹𝑖𝑡𝑛𝑒𝑠𝑠 (𝐹) = 1 𝑅𝑀𝑆𝐸
(7) 𝑅𝑀𝑆𝐸 = √1 𝑛∑ (𝑦𝑖− 𝑦𝑖 ′)2 𝑛 𝑖=1 (8) 𝐴𝑏𝑠𝑜𝑙𝑢𝑡𝑒 𝐸𝑟𝑟𝑜𝑟 = |𝑦 − 𝑦′|
(9)
Examples of the calculation fitness at Puspo district is shown in Table 3.
Table 3
Example of Fitness Calculation in Puspo District Chromosome District RMSE Fitness
C1 Puspo 6.575 0.152 C2 Puspo 7.214 0.139
d. Selection
Before performing the reproduction process, it is necessary to do the selection process to choose the chromosomes that would be a parent who will make the process of reproduction [18]. In this study, a selection method Roulette wheel is used, which allows each chromosome to have an opportunity to elect [6].
First, the selection process calculates the probability of roulette wheel and cumulative value for each chromosome. Thereafter, it will randomize the value between 0 and 1 twice to determine the chromosome that will be the parent with the provisions of C [n-1] <R <C [n]. The probability value of each chromosome is shown in Table 4 while the Roulette wheel selection results are shown in Table 5.
Table 4
Probability and Cumulative Value Calculation Chromosome Fitness (f) Probabilities Cumulative
C1 0.152 0.317 0.317 C2 0.139 0.289 0.607 C3 0.189 0.393 1
Table 5 Roulette Wheel Selection Random Value Selected Chromosome
0.0772 C1 0.45347 C2
e. Crossover
There are two reproductive processes which are genetic algorithm crossover and mutation. Crossover is the process of exchange of genes between one parent with the other parent [6]. A parent who will do the crossover is the parent of roulette wheel selection results. In the first model, the crossover method used is the one cut point crossover. Before doing a crossover is necessary to determine the value of cr or crossover rate. The value of cr used in this modeling is based on a combination of cr and mr based on three theories, which are the theory of Grefenstette [19], De Jong, and Theory of Quality Monitoring Fitness for determining the value of cr. Based on testing cr and mr size that has been done on research conducted by Wahyuni & Mahmudy [6] indicated that the average of the best fitness found in the combination of cr
value is 0.95 and the mr value is 0.05. So, the value of cr used 0.95. The initial step to process one cut point crossover is to select a point on chromosome randomly. After the cut-off point is determined, the next step is to exchange genes. The sample crossover with one cut point crossover method shown in Figure 7.
Figure 7: Sample Process Crossover
f. Mutation
The second reproduction process called a mutation, the mutation technique used is a simple random mutation. The process begins by determining the offspring O = (𝑂1, … , 𝑂𝑛)
from parent 𝑃 = (𝑝1, . . . , 𝑝𝑛) with the formula shown in
Equation (10) [20].
To determine the offspring, need to be defined value mr or mutation rate which is 0.05, where the value of mr has been tested in previous research [6]. For example, suppose the number of population (popSize) is 3, then the mutation will produce offspring with offspring formula = mr x popSize = 0.1 x 3 = 0.3 = 1 offspring. Illustration of simple random mutation process is shown in Figure 8.
𝑂𝑖= 𝑝𝑖(1 + 𝛼) (10)
where 𝑂 = offspring p = parent
α = a random value between -0.1 and 0.1
Figure 8: Simple Random Mutation
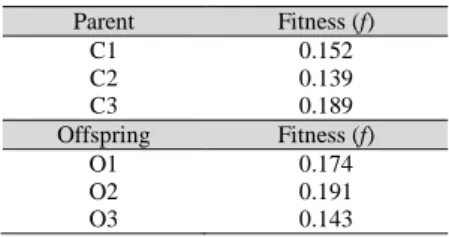
g. Evaluation
After the reproduction process is complete, parent and offspring will be calculated according to the value of its fitness Equation (7). The process is called an evaluation of the fitness value. It is the process of calculating the value of fitness in all chromosomes both parental and children chromosome or offspring reproductive outcomes. A chromosome with the highest fitness value has a great opportunity to be a candidate solution. The result of the calculation of fitness after the reproduction process is shown in Table 6.
Table 6
Evaluation After Reproductive Process Parent Fitness (f) C1 0.152 C2 0.139 C3 0.189 Offspring Fitness (f) O1 0.174 O2 0.191 O3 0.143 h. Elitism
After the reproductive process and the evaluation is complete, parent and offspring reproductions will undergo a second screening process. The second selection process used to choose the chromosomes that will pass to the next generation. The selection method to be used is elitism, where the method of this selection will select the chromosomes to pass to the next generation to sort by the highest to the lowest fitness value. Thereafter, it will have some chromosomes with the highest fitness values to pass to the next generation. With elitism selection, results are shown in Table 7.
Table 7 Result of Elitism Selection Parent Fitness (f)
O2 0.191 C3 0.189 O1 0.174
i. Stopping Condition
Genetic algorithms have no limit of iteration process to determine the best solution. However, a variety of methods can be used to determine its stopping condition [21]. In this study uses a limit number of generations or max Gen of 300 generations. Benchmark generation amount is taken from a previous study conducted by Wahyuni & Mahmudy [6], which states that the results of the optimization results obtained at the optimum generation number as many as 300.
III. RESULT AND DISCUSSION
A. Result
This study used different data for learning and testing. It used to determine how many errors are obtained if the learning model was tested in different testing data. The data used for testing is the rainfall data from 2005 to 2014 in the “dasarian” units or per ten days’ data. There are four locations that will be tested which are Puspo, Sumber, Tosari, and
C1 0.50 13.20 0.70 12.50 1.20 23.80 0.20 0.30 0.80 0.90 0.65 0.30 0.33 0.23 0.45 C2 0.70 16.70 0.34 23.90 0.90 33.80 0.70 0.35 0.23 0.70 0.13 0.53 0.43 0.23 0.27 O1 0.70 16.70 0.34 23.90 1.20 23.80 0.20 0.30 0.80 0.90 0.65 0.30 0.33 0.23 0.45 O2 0.50 13.20 0.70 12.50 0.90 33.80 0.70 0.35 0.23 0.70 0.13 0.53 0.43 0.23 0.27
Tutur. It has 360 data for each location that will be split by two, they are 180 data for training and 180 data for testing.
The testing processes two input parameters of the second model experiments performed five times at each district. The model will be used for prediction of rainfall in each district is a model that produces the smallest RMSE values of five experiments performed. The smallest RMSE values obtained in the 4th experiment with RMSE values of 5.87 in Puspo,
5.41 in Sumber District, 5.92 in Tosari, and 6.96 in Tutur. The graph shows the RMSE value of the test results in four districts can be seen in Figure 10 to 13.
From Figure 10 to 13 it can be seen that the RMSE values generated from each experiment in the four districts are not much different. This indicates that the input model proposed can predict rainfall with an error rate that is not too far on any forecasting process.
Figure 10: RMSE Puspo District with 2 Parameter Input
Figure 11: RMSE Sumber District with 2 Parameter Input
Figure 12: RMSE Tosari District with 2 Parameter Input
Figure 13: RMSE Tutur District with 2 Parameter Input
B. Comparison Results Predicted by Different Methods
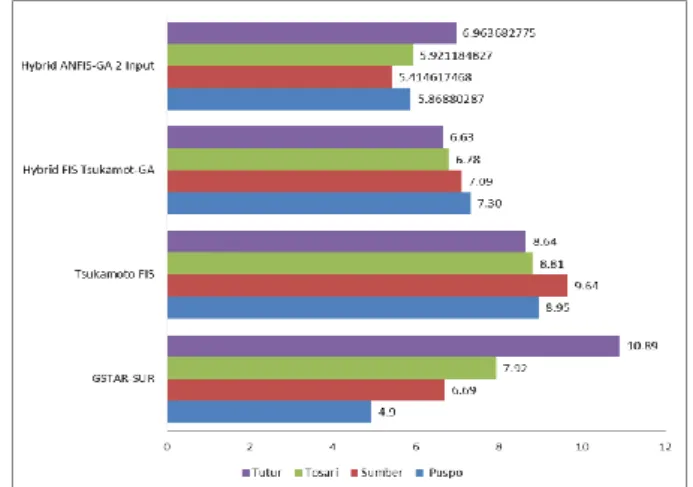
Results rainfall prediction using a hybrid method ANFIS-GA has smaller RMSE compared to other methods such as GSTAR-SUR [3], Tsukamoto FIS [5], and hybrid Tsukamoto FIS with GA [6]. Graphic comparison the RMSE using ANFIS-GA with two inputs parameter shown in Figure 14.
Figure 14: RMSE Comparison of Different Method for Rainfall Prediction
Hybrid ANFIS-GA method has the ability to optimize boundaries of membership function and the coefficient consequent rule of Sugeno FIS prior to entry into the neural network learning process. It performed by the genetic algorithm with encoding the solution into the chromosome. Thereafter the chromosome will be entered the ANFIS process to be trained again with the training data so that it will produce a model of ANFIS to rainfall prediction.
With two process optimization boundaries of the membership function, that is the repair process in the process of optimization with genetic algorithm and the training process with ANFIS, RMSE values obtained from the prediction becomes lower. The RMSE using ANFIS-GA with two inputs parameter compared with other methods shown in and Table 9.
Table 9
RMSE Comparison of Hybrid Method ANFIS-GA Two-Parameter Input Methods RMSE
Puspo Sumber Tosari Tutur GSTAR 4.9 6.69 7.92 10.89 Tsukamoto FIS 8.95 9.64 8.81 8.64 Tsukamoto FIS & GA 7.3 7.09 6.78 6.63 ANFIS-GA 2 Input Param 5.87 5.41 5.92 6.96
IV. CONCLUSION
With two optimization process in the boundaries of membership function with genetic algorithm and the training process with ANFIS, RMSE values obtained from the rainfall prediction becomes lower. It can be concluded that the results of rainfall prediction using the hybrid method ANFIS-GA produce smaller RMSE compared to the previous methods such as GSTAR-SUR, Tsukamoto FIS, and hybrid Tsukamoto FIS with GA. This prediction result can be used to determine the potato growing season, especially in Tengger. Research about determining to grow season for potatoes based on rainfall prediction using ANFIS-GA with two input parameters will do for future research.
ACKNOWLEDGMENT
This research was supported by Faculty of Computer Science, Brawijaya University and Local Meteorological, Climatological, and Geophysical Agency Karangploso, East Java.
REFERENCES
[1] L. Pervin and S. Islam, “System dynamics approach for modeling of sugar beet yield considering the effects of climatic variables,” J. Sci.
Food Agric., vol. 95, pp. 515–521, 2015.
[2] J. Batoro, D. Setiadi, and T. Chikmawati, “Pengetahuan Tentang Tumbuhan Masyarakat Tengger di Bromo Tengger Semeru Jawa Timur,” J. Wacana - J. Sos. dan Hum., pp. 1–10, 2006.
[3] A. Iriany, W. F. Mahmudy, A. D. Sulistyono, and S. C. Nisak, “GSTAR-SUR Model for Rainfall Forecasting in Tengger Region , East Java,” 1st Int. Conf. Pure Appl. Res. Univ. Muhammadiyah
Malang, 21-22 August, no. 1, pp. 1–8, 2015.
[4] S. Indriantoro, “Dampak Perubahan Iklim Terhadap Usaha Tani Kentang Dataran Tinggi Tengger (Studi Kasus di Desa Ngadisari Kecamatan Sukapura Kabupaten Probolinggo),” Agribisnis, pp. 1–8, 2010.
[5] I. Wahyuni, W. F. Mahmudy, and A. Iriany, “Rainfall Prediction in Tengger Region-Indonesia Using Tsukamoto Fuzzy Inference System,” 1th Int. Conf. Inf. Technol. Inf. Syst. Electr. Eng., pp. 1–11, 2016.
[6] I. Wahyuni and W. F. Mahmudy, “Rainfall Prediction in Tengger-Indonesia Using Hybrid Tsukamoto FIS and Genetic Algorithm,”
Submited to J. ICT Res. Appl., pp. 1–8, 2016.
[7] K. Li and H. Su, “Forecasting building energy consumption with hybrid genetic algorithm-hierarchical adaptive network-based fuzzy inference system,” Energy Build., vol. 42, no. 11, pp. 2070–2076, 2010. [8] S. H. Kusumadewi, “Fuzzy Multi-Attribute Decision Making (Fuzzy
MADM),” Graha Ilmu Yogyakarta, p. 2006, 2006.
[9] A. W. Jayawardena, E. D. P. Perera, B. Zhu, J. D. Amarasekara, and V. Vereivalu, “A comparative study of fuzzy logic systems approach for river discharge prediction,” J. Hydrol., vol. 514, pp. 85–101, 2014. [10] G. D. Santika, W. F. Mahmudy, and A. Naba, “Electrical Load
Forecasting using Adaptive Neuro-Fuzzy Inference System,” Int. J.
Adv. Soft Comput. its Appl., pp. 1–20, 2017.
[11] J.-S. R. Jang, “Input selection for ANFIS learning,” Proc. IEEE 5th Int.
Fuzzy Syst., vol. 2, pp. 1493–1499, 1996.
[12] R. Singh, A. Kainthola, and T. N. Singh, “Estimation of elastic constant of rocks using an ANFIS approach,” Appl. Soft Comput. J., vol. 12, no. 1, pp. 40–45, 2012.
[13] J. S. R. Jang, “ANFIS: Adaptive-Network-Based Fuzzy Inference System,” IEEE Trans. Syst. Man Cybern., vol. 23, no. 3, pp. 665–685, 1993.
[14] Y. Ding and X. Fu, “Kernel-based fuzzy c-means clustering algorithm based on genetic algorithm,” Neurocomputing, vol. 188, pp. 233–238, 2015.
[15] W. Mahmudy, R. Marian, and LHS Luong, “Real coded genetic algorithms for solving flexible job-shop scheduling problem – Part II: optimization,” Adv. Mater. Res., vol. 701, pp. 364–369, 2013. [16] W. F. Mahmudy, R. M. Marian, and L. H. S. Luong, “Hybrid Genetic
Algorithms for Multi-Period Part Type Selection and Machine Loading Problems in Flexible Manufacturing System,” IEEE Int. Conf. Comput.
Intell. Cybern. Yogyakarta, Indones. 3-4 December, pp. 126–130,
2013.
[17] I. Wahyuni and F. Utaminingrum, “Error Numerical Analysis for Result of Rainfall Prediction Between Tsukamoto FIS and Hybrid Tsukamoto FIS with GA,” 8th Int. Conf. Adv. Comput. Sci. Inf. Syst., pp. 1–8, 2016.
[18] T. Murata and H. Ishibuchi, “Adjusting membership functions of fuzzy classification rules by genetic algorithms,” Proc. 1995 IEEE Int. Conf. Fuzzy Syst. Int. Jt. Conf. Fourth IEEE Int. Conf. Fuzzy Syst. Second Int.
Fuzzy Eng. Symp., vol. 4, pp. 1819–1824, 1995.
[19] J. Grefenstette, “Optimization of Control Parameters for Genetic Algorithms,” IEEE Trans. Syst. Man. Cybern., vol. 16, no. 1, pp. 122– 128, 1986.
[20] W. F. Mahmudy, “Optimization of Part Type Selection and Loading Problem with Alternative Production Plans in Flexible Manufacturing System using Hybrid Genetic Algorithms – Part 2 : Genetic Operators and Results,” 2013 5th Int. Conf. Knowl. Smart Technol. Optim., pp. 81–85, 2013.
[21] J. Jafarian, “An Experiment to Study Wandering Salesman Applicability on Solving the Travelling Salesman Problem based on Genetic Algorithm,” Int. Conf. Educ. Inf. Technol. (ICEIT 2010) An, no. Iceit, pp. 1–7, 2010.