Journal of Management Information Systems / Fall 2007, Vol. 24, No. 2, pp. 141–165. © 2007 M.E. Sharpe, Inc. 0742–1222 / 2007 $9.50 + 0.00. DOI 10.2753/MIS0742-1222240206
Under Perpetual Licensing and
Software as a Service
VIDYANAND CHOUDHARYVIDYANAND (VC) CHOUDHARYis an Assistant Professor at the Merage School of
Busi-ness, University of California, Irvine. His research interests are broadly in the area of economics of information systems—industrial organization and game theory applied in the context of information systems. Specific research topics include information goods pricing and product design, price discrimination and versioning strategy, and electronic intermediation. His research has been published in a number of journals, including Management Science,Information Systems Research, and Journal of Man-agement Information Systems. His research papers have won best paper awards at the Twenty-Second International Conference on Information Systems (ICIS) and the Tenth Workshop on Information Technology and Systems (WITS).
ABSTRACT: Software is available through a number of different licensing models such
as the commonly used perpetual licensing model and a relatively new licensing model called software as a service (SaaS). There are several differences between SaaS and perpetual licensing. SaaS licensing offers software using a subscription model, whereas perpetual licensing involves a one-time payment for a perpetual use license and op-tional addiop-tional payments for future upgrades. Prior literature has not considered the impact of these licensing schemes on the publisher’s incentive to invest in software quality. We model differences in how new software features are disseminated in SaaS and perpetual licensing. We show that these differences affect the publisher’s incen-tive to invest in product development. We find that the SaaS licensing model leads to greater investment in product development under most conditions. This increased investment leads to higher software quality in equilibrium under SaaS as compared to perpetual licensing. The software publisher earns greater profits and social welfare is higher under SaaS under these conditions.
KEYWORDSANDPHRASES: application service providers, information goods, monopoly,
on-demand computing, pricing, product development, software as a service, software licensing, software quality.
SOFTWAREASASERVICE (SAAS) ISARAPIDLYGROWINGmeans of software licensing. Many
large and small software publishers are planning to embrace SaaS in the near future and it is expected to grow at the rate of 50 percent per year [29]. SaaS is different from traditional software licensing, which involves the buyer’s purchasing a perpetual
use license from the software publisher and then making additional investments for hardware, installation, and maintenance. In contrast, in the SaaS model, users buy a subscription to the software and the software publisher (seller) runs and maintains the software on his own hardware. Users with current subscriptions can obtain ac-cess to the software using the Internet. Early sucac-cessful adopters of the SaaS model include firms such as Salesforce.com and NetSuite (netsuite.com). Salesforce.com offers on-demand customer relationship management software solutions built on its infrastructure and delivered directly to users over the Internet. It has annual revenues of over $309 million. Salesforce.com does not sell perpetual licenses; instead, it charges a monthly subscription fee starting at $65/user/month. Similarly, NetSuite offers subscription-based access to its enterprise resource planning (ERP) software, which is targeted toward small and medium-sized businesses. Smaller businesses are less willing to invest in large, expensive systems that they have to maintain and are thus attracted to the SaaS model.
The trade press has used several terms to refer to SaaS, including on-demand com-puting,seamless computing, and adaptive computing. A number of articles in the trade press have painted a positive picture of industry adoption and growth of the SaaS model. The Economist claims that “SaaS is quicker, easier and cheaper to deploy than traditional software, which means technology budgets can be focused on providing competitive advantage, rather than maintenance” [29, p. 61]. Other trade publications are equally optimistic about SaaS; for example, the title of a recent International Data Corporation (IDC) white paper on SaaS reads: “The Future of Software Licensing: Software Licensing Under Siege” [20]. Credit Suisse First Boston has released an index to track this sector, and their analyst John Maynard claims that “traditional software is already dead” [29, p. 61].
SaaS has evolved from prior attempts to rent software and have it hosted by a third party. Choudhary et al. [8] list several technologies that enable software renting where users could use needed software for short periods of time and pay based on usage time. This was followed by the application service provider (ASP) model where the user could purchase a perpetual license but execute the software on hardware owned by a third party (ASP). Thus the user could outsource the hardware and infrastructure main-tenance to an ASP. The ASP model is different from SaaS in several aspects. Whereas SaaS involves subscription payments to the publisher, the ASP model requires an up-front license fee payment to the publisher and a subscription fee to the ASP. The firms providing ASP services usually lack application-specific expertise and instead focus on providing reliable and secure access to their servers as their core competency. The ASP vendor does not add new features to the application, and software upgrades must be purchased from the publisher and paid for by the user. Thus the incentive effects of the SaaS model examined in this paper do not arise in the context of ASP.
SaaS differs from traditional software in several aspects. Trade journals point out that SaaS does not require large up-front investments and thus there is an impact on cash flows of both buyer and seller with small, stable cash flows under SaaS rather than large periodic payments. Data security is another issue because users’ data are stored on the vendors’ hardware and systems. The University of Florida lists
predict-able costs, increased bargaining power, ability to switch across providers, and up-to-date software as the key benefits based on a one-year experiment with SaaS [12]. In this paper, we focus on the last of these reported benefits—that is, users’ access to the latest and most current version of the software. The publisher’s choice of the SaaS versus the perpetual licensing model is typically considered to be a marketing decision that follows product development. In contrast, we show that these licensing decisions influence the firm’s incentive to invest in product development. In particular, we focus on how software publishers’ incentive to invest in product development dif-fers between traditional software development and SaaS. The difference in incentives arises due to an SaaS vendor’s incentive to make available the most current features in the software solutions.
New features become available to users at different times depending on whether the publisher adopts the SaaS model or perpetual licensing. Under the perpetual licensing model, new features are typically made available as part of a new version or upgrade. Publishers also provide product updates in the form of “patches.” These patches are usually designed to repair features that were promised in the existing software and to protect against security vulnerabilities that arise from improper code. Typically, patches do not offer substantial new features. The reason is that under perpetual licensing, software publishers earn revenues from future upgrades whereas software patches are made available at no additional cost. For example, Microsoft released Office 2007 to consumers on January 30, 2007. The professional version costs $499 for a new purchase and $329 for an upgrade.1 If Microsoft were to provide the new features
included in Office 2007 as patches to users of Office 2003, the users may not be willing to upgrade or may only be willing to pay much less than $329 for the upgrade. Thus a profit-maximizing publisher has an incentive to provide new substantial features as part of an upgrade that is priced appropriately. In contrast, the SaaS model provides access to new features as soon as they are available due to the subscription pricing model. Arora et al. [1] analyze the timing of product release for a monopolist who issues patches. In their model, the number of bugs in the software is an exogenously determined function of time. They compare a physical goods monopolist who incurs a marginal cost to patch each unit to a software monopolist who incurs a fixed cost for each patch. They find that a software monopolist releases the product sooner and with more bugs but invests more in patching compared to a physical goods monopolist. However, compared to the socially efficient solution, a software monopolist releases the product later with fewer bugs but invests less in patching. Kim et al. [19] examine the role of liability and software patching quality in determining the software quality of a monopoly vendor. Rahman et al. [25] examine a software publisher’s incentive to enforce antipiracy measures by limiting the distribution of patches to legitimate users.
There is extensive literature on pricing strategies for information goods (e.g., [2, 7, 13, 17, 22, 30]). Bhargava and Choudhary [3, 4] examine conditions for the optimal-ity of versioning for information goods. Clemons et al. [9] argue that firms can use information to develop more customized products, and the increased ease of access to product information enhances the value of product differentiation. Dewan and Freimer
[10] study software vendors’ strategy of bundling software add-ins together with the base product and find that such a strategy can increase profits and social welfare while reducing prices. Dewan et al. [11] analyze online product customization and show that a monopolist seller may find it optimal to sell standard products in addition to custom-ized products. In a duopoly model, they find that when the competitors simultaneously adopt customization technology, their standard products become less differentiated but the price of the standard products is unchanged. Kauffman and Wang [18] study online dynamic pricing at a group-buying Web site. They find three effects—a posi-tive participation externality effect; buyers’ expectation of a price drop (price drop effect); and an ending effect, where a lot of orders were placed in the last three hours of the auction. Lang and Vragov [21] compare pricing policies and profits for content providers when they can choose either a client–server model or a peer-to-peer (P2P) model, finding that content providers can achieve higher profits with the P2P model. Sankaranarayanan [26] analyzes the commitment problem of a monopoly in the context of information goods. Sundararajan [28] analyzes fixed-fee and usage-based pricing of information goods and finds that the addition of fixed-fee pricing is profit maximizing in the presence of positive transactions costs.
Academic literature on SaaS is limited with most articles focused on optimal pricing strategies under a pay-per-use model of software. Motivated by the emergence of the on-demand computing environment, Bhargava and Sundaresan [5] analyze contingent auctions showing how different levels of commitment can affect prices and revenues. Gurnani and Karlapalem [14] examine a vendor’s strategy of supplementing perpetual use license with pay-per-use and report that this can be a profitable strategy for the vendor. Haruvy et al. [15] examine the role of piracy in affecting the adoption of sub-scription software products using an individual-level model in an adaptive population. Huang and Sundararajan [16] examine pricing strategies in a pay-per-use on-demand computing environment. They analyze the effect of four different factors—cost of deploying information technology (IT) in-house, the business value of IT, the scale of the provider’s infrastructure, and the variable costs of providing service. Seidmann and Ma [27] examine a firm’s choice between buying and maintaining a software application versus buying services on a per transaction basis from an ASP. They find that the ASP will serve users with light demand whereas high-demand users will prefer to buy the software. Zhang and Seidmann [31] examine the selling and renting of software and show that software vendors can price discriminate and segment the market by using subscription and licensing strategies together.
A key limitation of the aforementioned literature on software renting and ASP pricing is that it assumes that software quality is exogenously determined. This as-sumption precludes an examination of the impact of various licensing schemes on optimal software quality. In contrast, we compare perpetual software licensing to SaaS with a focus on the publisher’s incentive to invest in software quality. To understand the key difference modeled in this paper, consider a software publisher that sells perpetual software licenses such as Microsoft. In the operating systems (OS) market, Microsoft is a near-monopoly and it releases OS software periodically. Some of its OS releases include Windows 95, Windows 98, Windows 2000, Windows XP, and the
recently released Windows Vista. From a user perspective, the purchase of a perpetual license represents substantial investment and becomes sunk cost once the purchase is completed. When a new version of the software becomes available, users who have previously purchased the software have a choice between continuing to use existing software (at no additional cost) or spending more money to purchase the new version. Users do not upgrade unless the new software provides substantial incremental benefits relative to the previous version. For instance, although Microsoft has released newer versions since Windows 98, a large number of users have not upgraded. Microsoft tried to end support for Windows 98 in January 2004 but the public outcry follow-ing that announcement forced Microsoft to reschedule the cutoff date to June 2006 [6]. Thus users upgrade to a newer version only if there is sufficient benefit to them that exceeds the cost of upgrading. It took Microsoft more than five years to develop Windows Vista and the new features in it. However, because all of these features are bundled together in Vista, users had to wait for the release of the completed OS. Thus features that Microsoft developers may have finished in 2002 were not available to end users until the complete OS was released in 2007.
In contrast to the perpetual licensing model, which relies on sales of perpetual licenses and upgrades, the SaaS model utilizes the subscription model. This alleviates some of the problems with perpetual licensing described above. There is no competition between the present and future versions of software because the vendor does not sell a perpetual use license. Thus the publisher does not need to hold back new features for the next version and subscribers may have a higher willingness to pay because they expect to receive further enhancements to software features. SaaS alters a vendor’s incentive to invest in software development by allowing the vendor to release new features as soon as they are finished2 and make them available to all subscribers. Thus
a key advantage offered by SaaS is that individual features can be released as soon as they are completed, whereas the perpetual licensing model requires them to be with-held until a new version of the software is completed. In this paper, we argue that this little-noticed property of SaaS to deliver faster time to market for new features provides SaaS with a significant advantage over perpetual licensing. In particular, we focus on how this affects the vendor’s incentive to invest in software development. Given the convex cost of developing software quality, it is reasonable to expect that the vendor will reduce his software development budget and yet have higher “average” quality due to the faster time to market. This would lead to lower equilibrium (final) quality but higher profits for SaaS relative to perpetual licensing. However, counter to this expectation, our model shows that, in most cases, the publisher will invest more in software development under SaaS and thus have higher equilibrium quality.
Model
WEWISHTODETERMINEWHETHERTHEREAREDIFFERENCESin the optimal level of
invest-ment in product developinvest-ment for a software publisher under two different licensing schemes—the traditional way of licensing with perpetual licenses and the emerging paradigm of SaaS where software is provided using a subscription model. Differences
in the optimal level of investment translate into differences in resulting software quality that can affect optimal prices, profitability, and social welfare. We compare the soft-ware quality provided by the publisher when the firm offers a standard “perpetual use” license as compared to the quality when the firm offers “software as a service.”
Following substantial literature on product quality (e.g., [23]), we model quality as a vertical attribute where all users prefer higher quality to lower quality holding everything else constant (such as price).
We develop a two-period model where the vendor invests in product development to improve product quality. Thus product quality is a continuous nondecreasing function of time. For example, software publishers such as Microsoft, Oracle, and Salesforce. com are continually making improvements to their software. In our model, the trajec-tory of the firm’s quality is assumed to be linear:
q(t) = s · t,
where q(t) is quality as a function of time (t), and s is the rate of change of quality over time (slope). The assumption of linear quality trajectory is a simplification. This trajectory can be changed by the firm by hiring or firing employees or through the use of overtime. However, in our stylized model, the firm has full information at the begin-ning of the game and can therefore determine the trajectory at that time. At time t = 0, the firm decides how much to invest in quality, thus determining the trajectory (slope) of its software quality over the two periods. At time t = 1, it releases the product to the market and continues software development. At t = 2, the firm releases the upgraded version of the software product (in the case of perpetual licensing), achieving a final quality q(t = 2) = q2. At t = 2, the vendor ceases product development. (See Table 1.)
The quality of the software product at t = 1 is q(t = 1) = s ·1 = q1. Hence,
s = q1.
Further, the quality of the product at t = 2 is q(t = 2) = s ·2 = 2 · q1:
q2 = 2(q1). (1)
The firm incurs fixed costs that are a convex function of the slope of the product improvement curve (q1): c · q12.
Note that the cost function can also be equivalently expressed in terms of the final quality q2. Thus we can use Equation (1) to write the fixed cost of quality as
c · q12 = c · (q
2/2)2 = c[· q22,
where c[= c/4. Thus the fixed costs are costs incurred for product development in the first two periods.
The cost of quality can be different under the two licensing schemes. In particular, the cost of quality can be greater for SaaS if it becomes increasingly difficult to make quality improvements incrementally. For example, it may be necessary to periodically develop a new design and architecture for the software requiring the publisher to dis-card and redevelop parts of the software. While the same process occurs for perpetual licensing, this may temporarily disrupt the incremental development model of SaaS
and could potentially raise the cost of quality for SaaS. We allow for this possibility by including a parameter ωand model the fixed cost of quality for SaaS asω · c · q12. Note
that ω> 1 implies a higher cost of quality for SaaS relative to perpetual licensing. It is important to understand differences in the way users experience quality under perpetual licensing and SaaS. Under perpetual licensing, users in period 1 (1≤t < 2) experience q1 and those who buy/upgrade in period 2 (2 ≤t < 3) experience q2. Under SaaS, users experience q(t), which is linearly increasing until t = 2 and flat thereafter (see Figure 1). This is consistent with anecdotal evidence and our previous descrip-tion of Microsoft’s OS release schedule versus the way Salesforce.com continually upgrades its product for subscribers. Product development ceases at t = 2 (q(t) is flat for t > 2) so that SaaS and perpetual licensing have the same time period for product development. When using perpetual licensing, the publisher has no incentive to con-tinue product development beyond t = 2 because this is the last period of the game and the publisher will have no opportunity to release the next version. In contrast, the SaaS publishers can continue product development because users experience quality as the function q(t). However, this would give an advantage to the SaaS model and make it difficult to compare SaaS quality with perpetual licensing due to their differ-ent developmdiffer-ent time periods. In order to retain comparability, we assume that the SaaS vendor stops product development at the same time as the vendor with perpetual licensing at time t = 2.
At the beginning of the first period, the firm reveals its product with quality q1. All consumers are fully informed about the product’s quality trajectory. The publisher also declares his prices for periods 1 and 2. We assume that the publisher can credibly commit to second-period prices using one of many commitment devices listed in prior literature such as a money-back guarantee. Consumers then decide whether or not to purchase the software and, if purchasing, then the timing of the purchase.
Users’ willingness to pay for the software product is a function of the quality of the software that is made available to users and the time period over which they are able to use it. As stated previously, we use a vertical differentiation model of quality where buyers are heterogeneous in their “taste” for quality (θ) with different buyers willing to Table 1. Summary of Key Notation
Symbol Explanation
p1, p2, pu Price in period 1, price in period 2, upgrade price
q1, q2, qp, qs Software quality at different time periods and under different licensing schemes
θ; θu, θ1, θ2, θn Buyer type; Various indifferent buyer types
µ Ratio of second-generation users to the number of first-generation
users
c Scaling parameter for fixed cost of quality
ω Ratio of cost of quality for SaaS relative to perpetual licensing
λ Benefit from basic features, component of utility function
SWp, SWs Social welfare under perpetual licensing, social welfare under SaaS licensing
pay different amounts for a unit improvement in software quality. Rearranging buyer types in increasing order and indexing by θ, we can write the buyer’s willingness to pay for each period of usage under perpetual licensing as
U(θ, q) = θ · qi+λ · q1, (2a) where qi∈ {q1, q2} is the quality experienced by the buyer—q1 in period 1, and q2 in period 2, and λ∈ (0, 1) is a scaling constant. Thus, first-period utility for q1 is θ · q1 +
λ · q1 and second-period utility for q2 is θ · q2 + λ · q1.
Similarly, the buyer’s willingness to pay for an SaaS subscription from period t1
to t2 is U q q t q dt t t θ, θ λ .
( )
=∫
(
⋅( )
+ ⋅ 1)
1 2 (2b) Equations (2a) and (2b) are generalizations of the commonly used utility functionU(θ, q) = θ · q, which can be obtained from Equations (2a) and (2b) by setting λ= 0. This allows for two components in the utility function. The (θ · q) component is standard in vertical models of quality and models consumers as heterogeneous in the benefit they receive from increasing quality. The second component (λ · q1) is a benefit that all buyers receive equally. This is often the case for benefits from basic features, and also, network effects are often modeled as a homogeneous benefit to all users [24]. We use this function to explore the robustness of our insight by establish-ing limitestablish-ing cases for our results. Our key findestablish-ings hold even when this component of the utility function is eliminated (by setting λ= 0). Consumer type θ is assumed to be uniformly distributed in [0, 1].
We use a multigenerational model that allows for entry of new buyers in period 2. A scaling parameter µ∈ (0, 1) models the size of the market created by the
second-Figure 1. Product Quality Over Time
Note: Under perpetual licensing, users experience q1 and q2, whereas under SaaS, users experience quality as a function of time q(t).
generation users relative to the first generation. By setting µ = 0, we can analyze the case where there is no entry of new buyers in period 2.
The Perpetual Licensing Scheme
WEBEGINWITHTHECASEWHERETHESOFTWAREPUBLISHERoffers perpetual use licenses.
Buyers have several options; they can purchase the perpetual use license in the first pe-riod at a price of p1 and use the product in both periods, thus obtaining a surplus of
S1 = 2θ(q1) + 2λ(q1) – p1.
They could purchase in the first period and upgrade at the beginning of the second period at a price of pu, thus obtaining a total surplus over two periods of
Su = θ(q2 + q1) + 2λ(q1) – p1 – pu.
The buyers could also decide to forego the software in the first period and purchase it in the second period (S2) at a price of p2, thus earning a surplus of
S2 = θ(q2) + λ(q1) – p2. The surplus for a new buyer who arrives in period two is
Sn = θ(q2) + λ(q1) – p2.
We now determine the consumer type that is indifferent between these options. Note that because q2 = 2(q1) (Equation (1)), there is no single consumer type indifferent between buying in period 1 only and buying in period 2 only. This can be understood by examining the relevant indifference equation to determine the consumer type that is indifferent between these two options: S1 = S2. It is easy to see that the θ terms cancel from each side of the equation. This implies that all buyers prefer one or the other of these strategies. Thus, only one of these strategies will be pursued by buyers (either
S1 > S2 or vice versa for buyers of all types).
Case 1:
S
2>
S
1See Appendix A for solution to this case. We find that the publisher earns greater profits by setting prices that satisfy S1 > S2 (case 2 below). Thus the seller finds it optimal to set prices so that S1 > S2. Hence, case 1 is dominated by case 2 and so we focus on case 2 for the remainder of this paper.
Case 2:
S
1>
S
2Now we examine the dominant case where the publisher sets prices such that S1 > S2. In this case, some of the buyers who arrive in period 1 will buy in period 1 and some of those who buy in period 1 will upgrade in period 2. Some of the consumers who arrive in period 2 will buy in period 2. Note that we apply Equation (1) to replace 2q1
Let θu be the buyer type who is indifferent between the upgrade strategy (buying in period 1 and upgrading in period 2) and purchasing in period 1 only. Therefore, we can obtain θu by solving the following indifference equation: Su = S1. Solving for the indifferent type (θ), we obtain
θu = pu/(q2 – q1). (3) Let θ1 be the buyer type who is indifferent between buying in period 1 only and not buying at all. The relevant indifference equation is S1 = 0. Solving for the indifferent type (θ), we obtain
θ1 = (p1/(2q1)) – λ. (4)
Let θnbe the buyer type who arrives in period 2 and is indifferent between buying in period 2 and not buying. The relevant indifference equation is Sn= 0. Solving for the indifferent type (θ), we obtain
θn = (p2 – λ · q1)/q2. (5) The constraints on the indifference points are 0 ≤ θ1≤ θu ≤ 1 and 0 ≤ θn ≤ 1.
The profit function for perpetual licensing can be stated as
πp = (1 – θu)(p1 + pu) + (θu– θ1)(p1) + µ(1 – θn)(p2) – c(q1)2.
We replace q2, θu, θ1, θn (Equations (1), (3), (4), and (5)) into the profit function and compute the following first derivatives:
δπp/δpu = 1 – (2pu/q1)
δπp/δp1 = 1 + λ – (p1/q1)
δπp/δp2 = (µ/2)(2 – (2p2/q1) + λ)
δπp/δq1 = ((p12 + µp
22 + 2pu2)/(2q12)) –2c · q1.
Setting these derivatives equal to zero, we solve the first-order conditions to obtain optimal prices and quality:
p1* = (1 + λ)(6 + 4λ(2 + λ) + µ(2 + λ)2)/16c
pu* = (6 + 4λ(2 + λ) + µ(2 + λ)2)/32c
p2* = (2 + λ)(6 + 4λ(2 + λ) + µ(2 + λ)2)/32c
q1* = (6 + 4λ(2 + λ) + µ(2 + λ)2)/(16c),
We calculate the optimal indifference points and find that all constraints are satisfied. The optimal solution is stated below in terms of the first-period quality q1*.
Proposition 1: A monopolist seller using perpetual licensing schemes will find it optimal to set the following prices: pu* = q
1*/2; p1* = (1 + λ)q1*; p2* = ((2 + λ)q1*)/2.
The optimal quality q1* = [6 + 4λ(2 + λ) + µ(2 + λ)2]/(16c). The resulting
indif-ference points are θu* = 1/2; θ
1* = (1 – λ)/2; θn* = (2 – λ)/4. The seller earns a
profit πp* = q
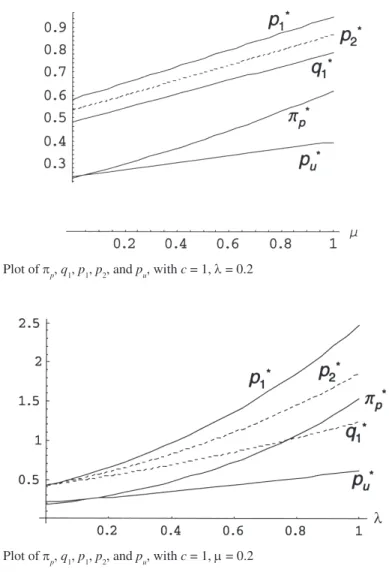
We have verified that second-order conditions are satisfied. Proposition 1 shows that more than half of the consumers who arrive in period 1 buy in period 1. A majority of these consumers upgrade in period 2. A majority of consumers that arrive in the second period purchase the software in the second period. The optimal solution is plotted in Figures 2 and 3.
Now we analyze the comparative statics for this solution.
Proposition 2: The optimal profit from perpetual licensing (πp*) and the optimal
quality (q1*) and (q
2*) increase with increase in the proportion of new consumers
arriving in period 2 (µ) and the utility from basic features (λ). The optimal profit and quality decrease with the cost of quality (c).
See Appendix B for proof.
As the number of consumers entering in the second period increases, the software publisher’s marginal revenue from quality improvement increases; thus, the publisher
Figure 2. Plot of πp, q1, p1, p2, and pu, with c = 1, λ = 0.2
finds it optimal to invest more in quality. Increase in utility from basic features (λ) has a similar effect.
Subscription Licensing (SaaS)
NOWWEANALYZETHECASEWHERETHESOFTWAREPUBLISHERoffers subscription
licens-ing. In each of the two periods, consumers can either subscribe or not subscribe. If a consumer subscribes in period 1 at a price p1, he or she is able to use the software throughout period 1. As described above, one of the key advantages of the subscription scheme is that consumers can obtain the benefits of software development (such as new features) faster. Thus subscribers experience regular software upgrades with quality tracking the product development process in period 1: q∈ [q1, q2]. The subscriber’s surplus can be computed using Equation (2b) by integrating utility from the period
t1 = 1 to t2 = 2:
S1 = θ((q1 + q2)/2) + λ(q1) – p1.
The seller could continue to invest in increasing the quality of the software in pe-riod 2; however, as previously explained, in order to maintain comparability in terms of the eventual quality produced under the two licensing schemes, we limit product development time under SaaS so that it is the same as under perpetual licensing. Note that removing this restriction on the seller of the subscription software would result in an even higher quality from the subscription licensing model.
A consumer who subscribes in period 2 at a price of p2 obtains a surplus of
S2 = θ(q2) + λ(q1) – p2.
We now determine the consumer type that is indifferent between subscribing in period 1 and not subscribing. The relevant indifference equation is S1 = 0. Solving for the indifferent θ, we obtain
θ1 = [2(p1 – λ · q1)/(q1 + q2)]. (6) Let θ2 be the buyer type who is indifferent between subscribing in period 2 and not subscribing. The relevant indifference equation is S2 = 0. Solving for the indifferent type (θ), we obtain
θ2 = (p2 – λ · q1)/q2. (7) The constraints on the indifference points are 0 ≤ θ1≤ 1 and 0 ≤ θ2≤ 1.
The profit function from perpetual licensing can be stated as
πs = (1 – θ1)(p1) + (1 – θ2)(p2)(1 + µ) – ω · c(q1)2.
We replace θ1, θ2, and q2 (Equations (1), (6), and (7)) into the profit function above and compute the following first derivatives:
δπs/δp1 = 1 + (2λ/3) – (4p1/3q1)
δπs/δq1 = (4p12 + 3(1 + µ)p
22 – 12ω · c · q13)/(6q12).
Setting these derivatives equal to zero, we solve the first-order conditions to obtain optimal prices, quality, indifference points, and profits. We find that all constraints are satisfied. The following proposition expresses the optimal solution in terms of the optimal quality (q1*):
Proposition 3: A seller using SaaS will find it optimal to set the following prices: p1* = (3 + 2λ)q
1*/4; p2* = ((2 + λ)q1*)/2. The optimal quality is q1* = [21 + 3µ(2 +
λ)2 + λ(24 + 7λ)]/(48ω · c). The resulting indifference points are θ
1* = (3 – 2λ)/6;
θ2* = (2 – λ)/4. The seller earns a profit of π
s* = q1*[21 + 3µ(2 + λ)2 + λ(24 +
7λ) – 24ω · c · q1*]/24.
Thus more than 50 percent of consumers subscribe in each period. Comparing θ1*
with θ2*, we find that θ
2* – θ1* = λ/12. Hence a smaller fraction of consumers subscribe
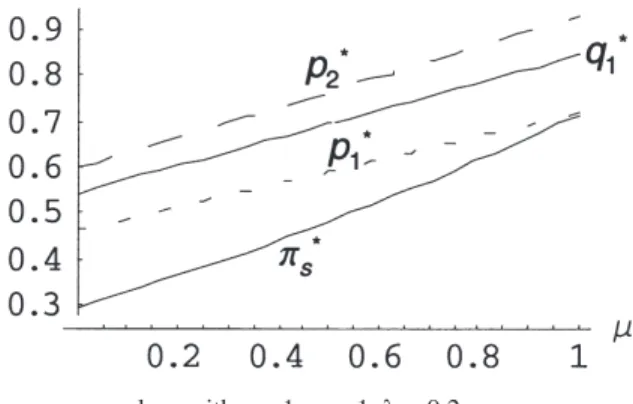
in period 2 relative to period 1. The fraction of consumers arriving in period 2 who subscribe is the same as the fraction of consumers who arrive in period 1 and subscribe in period 2. The optimal solution is plotted in Figures 4 and 5.
It is interesting to compare the results of Proposition 3 to those in Proposition 1. Note that in the first period, the perpetual licensing scheme results in more users relative to
Figure 4. Plot of πs, q1, p1, and p2, with c = 1, ω = 1, λ = 0.2
SaaS. In the second period, the perpetual licensing scheme has greater total number of users but the subscription license has a larger number of users working with the most current version of the product. This occurs because some of the users who buy a perpetual license in period 1 choose not to upgrade in period 2.
Now we analyze the comparative statics for this solution.
Proposition 4: The optimal profit from SaaS (πs*) and the optimal quality (q 1* and
q2*) increase with increase in the proportion of new consumers arriving in period 2
(µ) and the utility from basic features (λ). The optimal profit and quality decrease with the cost of quality (c and ω).
See Appendix B for proof.
Increasing the number of consumers entering in the second period (µ) raises the software publisher’s marginal revenue from quality improvement, thus finding it op-timal to invest more in quality. Increase in utility from basic features (λ) has a similar effect on the publisher’s incentive to invest in improving product quality.
Comparison of Perpetual and Subscription Licensing
NOWWECOMPARETHESOLUTIONSOFTHEPERPETUALand subscription licensing schemes.
We use qpto represent the optimal quality under perpetual licensing (q1) from Propo-sition 1 and, similarly, qs for optimal quality under SaaS (q1 in Proposition 3). Let q∆
be the difference between the product quality under subscription (qs) and perpetual licensing (qp).
q∆ = qs– qp = ((21 + 24λ + 7λ2 + 3(2 + λ)2µ)2 – 3ω(6 + 4λ(2 + λ)
+ µ(2 + λ)2))/(48ω · c).
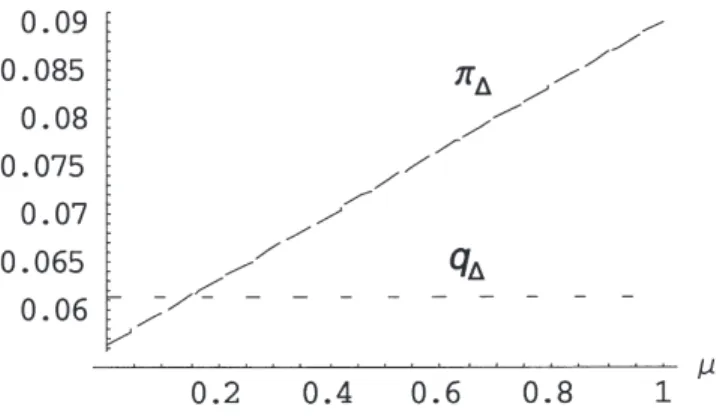
Proposition 5: When the utility from basic features λ < (3/5)1/2≈ 0.775, and the
cost of quality is the same for SaaS and perpetual licensing (ω = 1), then the seller invests greater effort in product development resulting in higher quality under subscription licensing relative to perpetual licensing with the difference in product development costs being equal to ((3 – 5λ2)(39 + 48λ + 19λ2 + 6µ(2 +
λ)2))/(2304c).
See Appendix B for proof.
Proposition 5 indicates that the faster revelation of new product features under subscription licensing provides incentives to the seller that result in greater invest-ment in product developinvest-ment and hence a higher-quality product relative to perpetual licensing. The difference in the number of users between perpetual and SaaS also affects the publisher’s incentive to invest in quality. Proposition 5 shows that for the commonly used utility function U(θ, q) = θ · q, SaaS yields higher equilibrium quality provided that the cost of quality is equal for both licensing methods. Even when λ > 0, for most reasonable values of λ, SaaS continues to yield higher quality.
Thus we have shown that licensing schemes affect optimal quality and that this effect generally favors SaaS licensing.
Now we compare the optimal profits under the two licensing schemes. Let π∆ be the difference between profits from subscription and from perpetual licensing: π∆ =
πs – πp.
Proposition 6: Comparison of profit under perpetual and SaaS licensing mod-els:
(a) When the utility from basic features λ < (3/5)1/2≈ 0.775 and the cost of quality
is the same for SaaS and perpetual licensing (ω = 1), then the seller earns greater profits from SaaS relative to perpetual licensing. The difference in profits is π∆= [(3 – 5λ2)(39 + 48λ + 19λ2 +6(2 + λ)2µ)]/(2304c).
(b) When λ < (3/5)1/2, π
∆increases with µ and decreases otherwise. When either
(i) λ > 0.282503 or (ii) λ≥ 0.268142 and µ > [(36 – λ(69 + 5λ(36 + 19λ))/(3(2 +
λ)(10λ(1 + λ) – 3))], π∆ decreases with λ and increases otherwise. See Appendix B for proof.
Proposition 6 shows that for the commonly used utility function U(θ, q) = θ · q, SaaS yields higher profits when the cost of quality for SaaS is no greater than the cost of quality for perpetual licensing. When λ > 0, for most reasonable values, SaaS continues to yield higher profit. The comparative static for π∆ is nonmonotonic with respect to µ and λ.
We now examine the impact of the cost of quality for SaaS relative to perpetual licensing.
Proposition 7: When the cost of quality for SaaS relative to the cost of quality for perpetual licensing ω < ω[1, then equilibrium quality is greater under SaaS licens-ing than under perpetual licenslicens-ing. When ω < ω[2, then profits are greater under SaaS licensing compared to profits under the perpetual licensing scheme:
ˆ ω λ λ λ µ λ 1 2 2 1 3 5 6 3 2 2 3 2 = + − +
(
+)
(
)
+(
+)
ˆ . ω λ λ µ λ λ λ µ λ 2 2 2 2 2 2 21 24 7 3 2 9 6 4 2 2 =(
+ + +(
+)
)
+(
+)
+(
+)
(
)
See Appendix B for proof.
Proposition 7 shows that in most cases, SaaS yields higher quality relative to per-petual licensing (see Figure 6). Consistent with our findings in Proposition 5, quality is higher under SaaS relative to perpetual licensing when λ is small enough and the cost of quality for software under SaaS is not too much greater than the cost of quality
for perpetual licensing. In particular, for the special case of λ = 0, the utility function reduces to U = θ · q and ω[1 and ω[2 are strictly greater than one:
ˆ ω µ 1 1 1 2 3 2 1 = + +
(
)
> and ˆ . ω µ µ 2 1 2 13 8 4 3 2 1 = + + +(
)
>We now examine the social welfare generated under perpetual licensing (SWp) and SaaS (SWs). These can be obtained by applying the optimal solutions in Propositions 1 and 3, respectively, to the following equations:
SWp u qp q dp qp qp q dp u =
(
+)
+(
+ +)
+∫
∫
2 2 2 2 1 1 θ λ θ θ θ λ θ µ θ θ θ θθ λ θ λ λ µ λ θ q q d cq SW c p p p p n +(
)
− ⇒ =(
+(
+)
+(
+)
)
∫
1 2 2 2 6 4 2 2 128 SWs =(
( )
qs+ q ds)
qs q ds +(
+)
(
+)
∫
3 2 1∫
2 1 2 1 1 / θ λ θ µ θ λ θ θ θ −− ⋅ ⋅ ⇒ =(
+ + +(
+)
)
⋅ ω λ λ λ µ ω c q SW c s s 2 2 2 2 21 24 7 3 2 1152 .Let SW∆ =SWs−SWp =
(
21 24+ +7 +3 2(
+)
)
−9(
6 4 2+(
+)
+(
2+)
)
1 2 2 2 2 2 λ λ µ λ ω λ λ µ λ 1152c⋅ω .We examine social welfare under the two licensing models and the comparative statics for social welfare in the following proposition:
Proposition 8: Comparison of social welfare generated under perpetual licens-ing and SaaS:
(a) When the cost of quality for SaaS relative to the cost of quality for perpetual licensing ω < ω[2, then social welfare is higher under SaaS compared to perpetual licensing.
(b) When the cost of quality is the same for SaaS and perpetual licensing (ω = 1) and the benefit from basic features (λ) satisfies λ < (3/5)1/2, then (i) SaaS
gener-ates greater social welfare than perpetual licensing, (ii) the difference between social welfare from SaaS relative to perpetual licensing (SW∆) increases with the proportion of second-generation consumers (µ), and (iii) SW∆ decreases with the cost of quality (c).
(c) The difference between social welfare from SaaS and perpetual licensing (SW∆) at ω = 1 increases with the utility from basic features (λ) when either (i) λ< 0.268142 or (ii) 0.268142 ≤ λ ≤ 0.28250 and µ < µ[. Otherwise, SW∆ decreases with λ. ˆ ω λ λ µ λ λ λ µ λ 2 2 2 2 2 2 21 24 7 3 2 9 6 4 2 2 =
(
+ + +(
+)
)
+(
+)
+(
+)
(
)
ˆ . µ λ λ λ λ λ λ = −(
+(
+)
)
+(
)
(
(
+)
−)
36 69 5 36 19 3 2 10 1 3See Appendix B for proof.
Propositions 5, 6, 7, and 8 establish conditions under which SaaS yields higher quality, profits, and social welfare as compared to perpetual licensing (see Figure 7). The difference in optimal investment in quality under the two licensing schemes is stated in Proposition 5. The comparative statics for the difference in optimal invest-ment in software quality is similar to the difference in social welfare as presented in Proposition 8. Our findings show that a monopoly software publisher would prefer SaaS to perpetual licensing when the utility from basic features (λ) is not too large and when the cost of quality for SaaS is not too large relative to the cost of quality
for perpetual licensing. While an increase in the number of consumers arriving in the second period (µ) generally (λ < (3/5)1/2) increases the profit advantage of SaaS, the
impact of λ depends on certain conditions as stated in Proposition 6.
Discussion and Conclusion
WHAT ISTHE IMPACTOF DIFFERENTLICENSING SCHEMESon the publisher’s incentive to
invest in software quality? Prior academic literature on licensing schemes treated software quality as exogenously determined and instead focused on determining the optimal pricing strategy and a comparison of resulting profits from different licensing schemes. In this paper, we formulate a model of endogenous software quality under the perpetual licensing scheme and under subscription licensing (SaaS). Our model captures key differences in terms of how new software features are disseminated in the perpetual licensing model and the SaaS licensing model. We show that a publisher who adopts the SaaS licensing scheme will typically invest more in software quality compared to a publisher who adopts the perpetual licensing scheme. Despite this higher investment in software quality, the SaaS publisher earns larger profits than a publisher who adopts perpetual licensing. The increased investment in software quality yields higher software quality and higher social welfare under SaaS. These results hold when the cost of quality for SaaS is not much greater than that for perpetual licensing and the utility from basic features (λ) is not too large. Thus for the case of the commonly used utility function (U(θ, q) = θ · q), the publisher will invest more in software de-velopment under SaaS relative to perpetual licensing even when the cost of quality improvement for SaaS is somewhat larger than the cost of quality improvement for perpetual licensing. These incentive effects are unique to SaaS and do not arise in the ASP model because the software publisher provides upgrades to the user or ASP in the same way as in the perpetual licensing model.
Our results have implications for software firms and users as they try to understand the differences between SaaS and perpetual licensing: (1) SaaS involves small, stable cash flows compared to large, irregular payments under perpetual licensing. (2) SaaS users do not need to invest as much in hardware and specialized IT personnel. (3) The
SaaS publisher installs and maintains the application, and can take advantage of his application expertise in these processes. SaaS is also likely to strengthen the publisher’s incentive to improve the deployment and maintenance processes. (4) SaaS alters the relative bargaining power between buyers and sellers as the buyers no longer incur large sunk costs. (5) Because application data are stored at the vendor’s site, there are implications for security, trust, and switching costs. (6) Large IT projects are risky and exhibit a high failure rate. SaaS can reduce the execution risk for buyers and al-low buyers to exit from poor investments with a smaller loss. This paper contributes to the literature on SaaS by showing that SaaS is also likely to lead to a higher rate of improvement in software quality. The SaaS model lends itself to faster time to market for new features, and this, in turn, enhances the publisher’s incentive to invest in software quality.
This research can be extended both analytically and empirically. SaaS raises many issues as discussed in the previous paragraph. Future analytical work can examine shifts in bargaining power, economies of scale, and impact on the level of risk in large IT projects. Empirical methods can be used to compare the investment in software development, maintenance costs, prices, publisher profits, and buyer surplus between SaaS and perpetual licensing using data from industry. User surveys can also be used to assess differences in quality between SaaS and perpetual licensing.
Acknowledgments: This research was supported by grants from the CISE/IIS/CSS Division of the U.S. National Science Foundation (NSF) and the NSF Industry/University Cooperative Research Center (CISE/EEC) to the Center for Research on Information Technology and Or-ganizations (CRITO) at the University of California, Irvine. Industry sponsors include Boeing, IBM, International Data Corporation, Intel, Microsoft, and the U.S. Department of Defense. Any opinions, findings, and conclusions or recommendations expressed in this material are those of the author and do not necessarily reflect the views of the National Science Foundation.
N
OTES1. 2007 Microsoft Office system pricing (http://office.microsoft.com/en-us/products/ FX101754511033.aspx).
2. Interdependencies between certain features may require that they be released together, thus potentially causing some delays.
R
EFERENCES1. Arora, A.; Caulkins, J.P.; and Telang, R. Sell first, fix later: Impact of patching on software quality. Management Science, 52, 3 (March 2006), 465–471.
2. Bakos, Y., and Brynjolfsson, E. Bundling information goods: Pricing, profits, and ef-ficiency. Management Science, 45, 12 (December 1999), 1613–1630.
3. Bhargava, H.K., and Choudhary, V. Information goods and vertical differentiation. Journal of Management Information Systems, 18, 2 (Fall 2001), 89–106.
4. Bhargava, H.K., and Choudhary, V. When is versioning optimal for information goods? Working Paper, University of California, Irvine, March 2007.
5. Bhargava, H.K., and Sundaresan, S. Computing as utility: Managing availability, com-mitment, and pricing through contingent bid auctions. Journal of Management Information Systems, 21, 2 (Fall 2004), 201–227.
6. Bowes, G. End of support for Windows 98. Welland Tribune (Ontario) (January 20, 2006), D5.
7. Choudhary, V. Use of pricing schemes for differentiating information goods. Working Paper, University of California, Irvine, November 2006.
8. Choudhary, V.; Tomak, K.; and Chaturvedi, A. Economic benefits of software renting. Journal of Organizational Computing and Electronic Commerce, 8, 4 (1998), 277–305.
9. Clemons, E.K.; Gu, B.; and Spitler, R. Hyper-differentiation strategies: Delivering value, retaining profits. In R.H. Sprague Jr. (ed.), Proceedings of the Thirty-Fifth Annual Hawaii In-ternational Conference on System Sciences. Los Alamitos, CA: IEEE Computer Society Press, 2003 (available at http://ieeexplore.ieee.org/xpls/abs_all.jsp?arnumber=1174592).
10. Dewan, R.M., and Freimer, M.L. Consumers prefer bundled add-ins. Journal of Manage-ment Information Systems, 20, 2 (Fall 2003), 99–111.
11. Dewan, R.M., Jing, B.; and Seidmann, A. Product customization and price competition on the Internet. Management Science, 49, 8 (August 2003), 1055–1070.
12. Foley, J. Power shift. InformationWeek, April 19, 2004, 47.
13. Geng, X.; Stinchcombe, M.B.; and Whinston, A.B. Bundling information goods of de-creasing value. Management Science, 51, 4 (April 2005), 662–667.
14. Gurnani, H., and Karlapalem, K. Optimal pricing strategies for Internet-based software dissemination. Journal of the Operational Research Society, 52, 1 (2001), 64–70.
15. Haruvy, E.; Mahajan, V.; and Prasad, A. The effect of piracy on the market penetration of subscription software. Journal of Business, 77 (April 2004), S81–S107.
16. Huang, K.W., and Sundararajan, A. Pricing models for on-demand computing. Working Paper CeDER-05–26, Center for Digital Economy Research, Stern School of Business, New York University, November 2005.
17. Jones, R., and Mendelson, H. Product and price competition for information goods. Working Paper, University of Rochester, Rochester, NY, 1998.
18. Kauffman, R.J., and Wang, B. New buyers’ arrival under dynamic pricing market mi-crostructure: The case of group-buying discounts on the Internet. Journal of Management Information Systems, 18, 2 (Fall 2001), 157–188.
19. Kim, B.C.; Chen, P.Y.; and Mukhopadhyay, T. Monopoly, software quality and liability. Paper presented at the Workshop on Information Systems Economics, University of Maryland, College Park, December 11–12, 2004.
20. Konary, A.; Graham, S.; and Seymour, L. The future of software licensing: Software licensing under siege. White Paper, International Data Corporation, Framingham, MA, March 2004.
21. Lang, K.R., and Vragov, R. A pricing mechanism for digital content distribution over com-puter networks. Journal of Management Information Systems, 22, 2 (Fall 2005), 121–139.
22. Masuda, Y., and Whang, S. On the optimality of fixed-up-to tariff for telecommunications service. Information Systems Research, 17, 3 (September 2006), 247–253.
23. Mussa, M., and Rosen, S. Monopoly and product quality. Journal of Economic Theory, 18, 2 (1978), 301–317.
24. Padmanabhan, V.; Rajiv, S.; and Srinivasan, K. New products, upgrades, and new re-leases: A rationale for sequential product introduction. Journal of Marketing Research, 34, 4 (1997), 456–472.
25. Rahman, M.S.; Kannan, K.; and Tawarmalani, M. The countervailing incentive of restricted patch distribution: Economic and policy implications. Working Paper, Purdue University, West Lafayette, IN, October 2006.
26. Sankaranarayanan, R. Excessive software upgrades: Reasons and remedies. In I. Bardhan, A. Gupta, and P. Tallon (eds.), Proceedings of the Tenth INFORMS Conference on Information Systems and Technology. Linthicum, MD: INFORMS, 2005.
27. Seidmann, A., and Ma, D. ASPs versus enterprise software solutions. Paper presented at the Workshop on Information Systems and Economics, University of Maryland, College Park, December 11–12, 2004.
28. Sundararajan, A. Nonlinear pricing of information goods. Management Science, 50, 12 (December 2004), 1660–1673.
30. Varian, H.R. Buying, sharing and renting information goods. Journal of Industrial Eco-nomics, 48, 4 (2000), 473–488.
31. Zhang, J., and Seidmann, A. The optimal software licensing policy under quality uncer-tainty. Paper presented at the Workshop on Information Systems and Economics, Seattle, WA, December 13–14, 2003.
Appendix A: Analysis of Perpetual Licensing Scheme
Case 1: S
2> S
1WECONSIDERTHECASEWHERETHEFIRMSETSprices such that S2 > S1. Note that since S2 >
S1, all consumers prefer buying in period 2 only to buying in period 1 only (without upgrading in period 2). Some consumers may find it optimal to buy in period 1 and upgrade in period 2. Since Su– S2 is increasing in θ, we know that higher θ-type con-sumers prefer Su(buy in period 1 and upgrade in period 2) to S2 (buy only in period 2). Thus the profit function for the publisher can be formulated as
πp = (1 – θu)(p1 + pu) + (θu – θ2)(p2) + µ(1 – θn)(p2) – c(q1)2.
We can now determine the consumer type (θu) indifferent between the upgrade strat-egy (buying in period 1 and upgrading in period 2) and buying in period 2 only:
θu = (p1 + pu– p2 – λq1)/q1.
And the consumer type (θ2) indifferent between buying in period 2 and not buying at all:
θ2 = (p2 – λq1/(2q1)).
And the indifferent consumer type from the second generation who arrives in period 2 and is indifferent between buying in period 2 and not buying at all:
θn = (p2 – λq1/(2q1))
The following constraints apply to these indifference points: 0 ≤ θ2≤ θu≤ 1
and
0 ≤ θn≤ 1.
We replace these indifference points in the profit function and set pb = p1 + pu since all buyers who purchase in period 1 also upgrade in period 2. We compute first deriva-tives of profit with respect to prices:
δπp/δpb = 1 + λ + (2(p2 – pb)/(q1))
δπp/δp2 = (4pb– λq1 + (2 + λ)µq1 – 2p2(µ + 3))/(2q1)
δπp/δq1 = (2pb2 – 4p
Solving the first-order conditions δπp/δpb = 0, δπp/δp2 = 0, and δπp/δq1 = 0, we obtain the following solution:
p[b = 3q1/2 + q[1λ
p[2 = q1 + (λq[1)/2
q[1 = (6 + 8λ + 3λ2 + µ(2 + λ)2)/(16c).
And computing optimal indifference points, we find that θ{
u = (1 – λ)/2, θ2{ = (2 – λ)/4.
This violates the constraint θ2{ ≤ θu{ because θu{ – θ2{ = –(λ/4). Hence, there are no first-generation users who buy only in the second period. Other constraints are satisfied, thus we can modify the profit function accordingly:
πp = (1 – θu)(p1 + pu) + µ(1 – θn)(p2) – c(q1)2.
Again, replace pb = p1 + pu. The indifference points θu is obtained by solving Su = 0, which yields θu = (pb– 2q1λ)/(3q1) and θn is unchanged. We replace these indiffer-ence points in the profit function. Computing partial derivatives, we obtain first-order conditions:
δπp/δpb = 1 + 2λ/3 – (2pb/3q1) = 0
δπp/δp2 = µ(1 + (λ/2) – (p2/q1)) = 0
δπp/δq1 = (2pb2 – 12cq
13 + 3p22µ)/(6q12).
Solving these first-order conditions, we obtain a profit of
π[
p = (2(3 + 2λ)
2 + 3µ(2 + λ)2)2/2304c.
The optimal profit from case 2 (S1 > S2) can be obtained from Proposition 1:
π*p= λ λ µc λ +
(
+)
+(
+)
(
6 4 2 2)
256 2 2 π*p−πp =λ λ λc µ λ . +(
+)
(
)
+(
+)
(
)
> 2 2 2 9 12 5 3 2 288 0Thus the seller will choose prices such that S1 > S2 and the optimal solution is obtained from solving case 2 where S1 > S2.
Appendix B: Proof of Propositions
Proof of Proposition 2
δπp*/δµ = [(2 + λ)2(6 + 4λ(2 + λ) + µ(2 + λ)2)]/(128c) > 0
δπp*/δλ = [(2(2 + µ) + λ(4 + µ))(6 + 4λ(2 + λ) + µ(2 + λ)2)]/(64c) > 0
δπp*/δc = –[(6 + 4λ(2 + λ) + µ(2 + λ)2)]2/(256c2) < 0
δq1*/δµ = [(2 + λ)2]/(16c) > 0 δq1*/δλ = [4 + 2µ + 4λ + µλ]/(8c) > 0 δq1*/δc = –[(6 + 4λ(2 + λ) + µ(2 + λ)2)]/(16c2) < 0. Q.E.D.
Proof of Proposition 4
δπs*/δµ = [(2 + λ)2(21 + 24λ + 7λ2 + 3µ(2 + λ)2)]/(384ω · c) →δπs*/δµ > 0 δπs*/δλ = [(12 + 7λ + 3(2 + λ)µ)(21 + 24λ + 7λ2 + 3µ(2 + λ)2)]/(576ω · c) →δπs*/δλ > 0 δπs*/δc = –[(21 + 24λ + 7λ2 + 3µ(2 + λ)2)]2/(2304ω · c2) →δπs*/δc < 0 δπs*/δω = –[(21 + 24λ + 7λ2 + 3µ(2 + λ)2)]2/(2304ω2 · c) →δπs*/δω < 0 δq1*/δµ = [(2 + λ)2]/(16ω · c) > 0 δq1*/δλ = [12 + 7λ + 3µ(2 + λ)]/(24ω · c) > 0 δq1*/δc = –[(21 + λ(24 + 7λ) + 3µ(2 + λ)2)]/(48ω · c2) < 0 δq1*/δω = –[(21 + λ(24 + 7λ) + 3µ(2 + λ)2)]/(48ω2 · c) < 0. Q.E.D.Proof of Proposition 5
Set ω = 1 in q∆. This yields q∆ (at ω = 1) = (3 – 5λ2)/(48c).
Solving (3 – 5λ2)/(48c) = 0 for λ, yields one positive root: λ = (3/5)1/2.
To obtain the difference in fixed product development costs, we calculate c(qs2 – q
p2)
at ω = 1. This yields ((3 – 5λ2)(39 + 48λ + 19λ2 + 6µ(2 + λ)2))/(2304c). Q.E.D.
Proof of Proposition 6
(a) At ω = 1, π∆ = [(3 –5λ2)(39 + 48λ + 19λ2 + 6(2 + λ)2µ)]/(2304c). Solving π
∆ = 0
for λ, we get λ = (3/5)1/2 as the only feasible root. A quick inspection of π
∆ shows that
(b) δπ∆/δµ = (2 + λ)2(3 – 5λ2)/384, which is clearly positive when λ < (3/5)1/2.
δπ∆/δλ = (18(2 + µ) – λ(69 + 51µ + 5λ(36 + 19λ + 6µ(3 + λ))))/576. Solving δπ∆/δλ = 0 for µ, we get
ˆ . µ λ λ λ λ λ λ =
(
−(
+(
+)
)
)
+(
)
(
(
+)
−)
(
)
36 69 5 36 19 3 2 10 1 3µ[ is feasible (0 ≤µ[≤ 1) only in the region: 0.268142 ≤λ≤ 0.282503.
It can be verified that δπ∆/δλ < 0 at λ = 1; δπ∆/δλ < 0 at λ = 0.28 for µ > µ[. Further,
δπ∆/δλ > 0 at λ = 0; δπ∆/δλ > 0 at λ = 0.28 for µ < µ[. Q.E.D.
Proof of Proposition 7
The condition for comparing quality under SaaS to perpetual licensing in Proposi-tion 7 can be obtained by solving for the value of ω that solves q∆ = 0. Similarly, the condition for comparing profits under SaaS and perpetual licensing can be obtained by solving for the value of ω that solves π∆ = 0. It can be verified that both ω[1 and ω[2
are positive within the feasible region for µ and λ. Q.E.D.
Proof of Proposition 8
(a) Solving SW∆ = 0 for ω yields ω[2. It can be verified that ω[2 is positive in the feasible region.
(b) The remaining results in Proposition 8 apply to SW∆ evaluated at ω = 1:
SW SW c ∆ ω ∆ λ λ λ µ λ =
(
1)
= =(
3 5−)
(
39 48+ +19 +6 2(
+)
)
1152 1 2 2 2 .(b)(i) Solving SW∆1 = 0 for λ, we find a unique feasible root at λ = (3/5)1/2. SW
∆1 > 0
for λ = 0, and SW∆1 < 0 for λ = 1.
(b)(ii) To see that SW∆1 increases with µwhen λ < (3/5)1/2, we compute δSW
∆1/δµ.
δSW∆1/δµ = (2 + λ)2(3 – 5λ2)/192c.
It is easy to verify that this derivative is positive for λ < (3/5)1/2 and negative
other-wise.
(b)(iii) To see that SW∆1 decreases with c when λ < (3/5)1/2, we compute δSW
∆1/δc. δSW δc λ λ λ µ λ c ∆1 2 2 2 2 3 5 39 48 19 6 2 1152 / = −
(
−)
(
+ + +(
+)
)
.It is easy to verify that this derivative is negative for λ < (3/5)1/2 and positive