Applying learning analytics to students’ interaction in business simulation games. The usefulness of learning analytics to know what students really learn Ana Beatriz Hernández-Lara a, Alexandre Perera-Lluna b, Enric Serradell-López c*
a Department of Business Management, Universitat Rovira i Virgili, Av. Universitat 1, 43204 Reus, Spain, [email protected]
b Automatic Control Department, Universitat Politècnica de Catalunya, C/Pau Gargallo 5, 08028 Barcelona, Spain, [email protected]
c* Business and Management Department, Universitat Oberta de Catalunya, Av. Tibidabo 39-43, 08035 Barcelona, Spain, [email protected], Tel: +34 932542112 Abstract
Nowadays, different ways of communication and interaction among multiple actors are dominating learning processes. However, there are critical opinions that question the contribution of student interaction to real learning. This study applies learning analytics and data mining techniques to explore the online discussion forums of 362 business students at the bachelor and master levels, who participated in business simulation games between 2011 and 2016. The findings revealed that the most frequent contents in the students’ online discussion forums were related, firstly, to the parameters and features of the business simulation game, and, secondly, to elements that fostered the students’ learning process, while small talk or regular conversation did not appear to be relevant. In addition, the contents with predictive power over learning results were related to uncertainty, time, interaction, communication and collaboration, although none of these elements influenced teacher assessment of student learning. This study reveals the usefulness of learning analytics tools to gain a more wide and holistic view of the learning process of students, discovering new aspects that affect students’ learning results.
Keywords: Student interaction; learning outcomes; online learning activities; business simulation games; learning analytics; data mining.
Applying learning analytics to students’ interaction in business simulation games. The usefulness of learning analytics to know what students really learn 1. Introduction
New teaching methods fostered by digital technologies, as well as information and communication technologies (ICT), offer new forms of teaching, training and learning that have allowed students to reap the benefits for their educational and professional development (John & Wheeler, 2012). These methods frequently constitute online learning activities that foster different types of learning interactions, which promote the achievement of educational objectives (Noeth & Volkov, 2004).
In this new scenario, students are positioned as the main actors of their learning process, which shifts the focus from teachers to students (Cheng & Chau, 2014; Fitó-Bertrán et al., 2015), with these latter being responsible for building their own knowledge and acquiring their own skills.
From a constructivist learning perspective, students learn both through their autonomous exposition to content that contributes to knowledge construction, and through richer interactivity that overcomes the communication style of the traditional classroom-based paradigm (Kent et al., 2016). In the new learner-centred paradigm, the evaluating achievements have been transformed (Kent et al., 2016), and the relevance of considering the opinions of students is emphasized in the design, monitoring and assessment of their learning process. Students’ opinions have become a powerful source used for determining the success of online learning activities and how they promote the learning outcomes of students (Pando-Garcia et al., 2015). These online learning activities offer more varied ways to interact by sharing ideas and experiences in online discussions, which could be used as richer and less biased sources of information in order to really understand the student learning experience and its outcomes (Lonn et al.,
2011).
Nevertheless, teachers are frequently unfamiliar with how students interact among themselves, because most of the time they do not take part in these interactions, and might not even be aware that they are occurring or under which circumstances they are carried out. Therefore, student interactivity is rarely evaluated or considered as a learning evaluation metric (Kent et al., 2016; Reich, 2015), which explains the current doubts concerning whether or not teacher assessment of the students’ learning outcomes reflects what the students really learn.
This study aimed to explore the online discussion forums of students participating in an online learning activity, more specifically a business simulation game. Therefore, the purpose was to respond to the following questions:
1. What are the most frequent contents that appeared in students’ interaction, which determined the communication pattern in their online discussion forums?
2. What are the contents that better explained and predicted the students’ learning results?
This study aspired to contribute to the open debate on the learning impacts of student interactivity, and to discover more about the learning process developed by students through the analysis of this interactivity. In addition, the study highlighted the usefulness of applying educational analytics and data mining techniques, such as natural language processing (NLP), in student forums. These techniques allow teachers and instructors to gain a more holistic view of student learning development, and to improve their decision-making for educational purposes.
2. Literature review
2.1. Conceptual framework of learners’ interactivity
There are different definitions and classifications of interactivity based on different aspects, such as the agents involved, the frequency, or the participation mode (Agudo-Peregrina et al., 2014). Moore (1989) proposed a classic definition for interaction based on digital technology centred on the agents involved, which traditionally distinguished between content interaction (video classes, questions, tests, etc.) and social interaction (Northrup, 2001; Paiva et al., 2016), the latter including learner-teacher interactions and learner-learner interactions (Moore & Kearsley, 1996). With the advance of technology and increasing complexity in online education, additional categories were subsequently added, such as interactions with the interface or the environment itself (logging in the environment, completing profile information, reading help files, etc.) (Paiva et al., 2016), as well as self-interaction (Soo & Bonk, 1998) based on the reflexive thinking process and self-directed learning fostered by e-learning.
Social interaction can be described as two-way communication between two or more people within a learning context (Gilbert & Moore, 1998). Learner-teacher interaction allows teachers to act as coachers, counsellors and supporters in the student learning process (Lonn et al., 2011), and provides teachers with useful information for the assessment of the students’ learning achievements. Learner-learner interaction, or what we call learners’ or students’ interactivity, on the contrary, does not involve teachers or instructors at all. This type of interaction contemplates a social interactivity where teachers do not participate (Hernández-García et al., 2015), because the learners
consider that they should not be included, with the result that these teachers are frequently unaware that such interaction occurs and what the consequences are in terms of student learning.
According to Kent et al. (2016) “social constructivism perceives knowledge as constructed between people by a social process of interacting”. Therefore, a relationship is established between social interactivity and learning outcomes, although it depends on the nature of the interactivity, which involves not only communication but also other complex activities that develop collaborative skills, such as teamwork, coordination, problem-solving, conflict resolution and negotiation (Boticki et al., 2015). Social interactivity also implies putting into practice other complex activities that are not always related to collaborative skills, although they are also involved in the learning process, such as engaging, reflecting, questioning, answering, elaborating, constructing and analysing, among others (Liaw & Huang, 2000). As long as social interactivity allows students to engage in all these activities, it contributes to knowledge construction, and hence learning, through the interactive exchange of information and the development of relatedness between pieces of information (Kent et al., 2016).
2.2. Learners’ interactivity and learning results
In the new educational era dominated by digital tools, computer technology and the Internet, more advanced ways of interaction have appeared that allow students to share ideas and experiences that contribute to their learning (John & Wheeler, 2012; Noeth & Volkov, 2004). In addition, these new technologies make more information available with regard to what the students really do while learning, making it easier to access the learners’ opinions, which become a powerful source of information concerning the learning process and its outcomes (Pando-Garcia et al., 2015).
However, a literature review on the relationship between learners’ interactivity and learning outcomes shows an unclear link and provides some inconclusive results (Adeyinka & Abdulmumin, 2011; Asterhan & Hever, 2015; Picciano, 2002; Song & McNary, 2011; Wei et al., 2015). This lack of consistency has enhanced the interest of researchers studying learner interactivity at an educational level (Kent et al., 2016).
The review reveals that most studies have applied a quantitative approach, looking for cause-effect relationships and/or correlations between interactivity and grades or classroom performance and achievements (Kent et al., 2016). As Romero et al. (2013) stated: “there is increasing interest in the use of discussion forums as an indicator of student performance”, however this research is not completely conclusive in its findings, being possible to find studies that point out a positive association between learners’ interactivity and learning outcomes, a negative one, or not relationship at all
between them (Kent et al., 2016). Some examples of recent studies that show a positive association are those of Wei et al. (2015), who analysed the relationship between the students’ self-reported perceptions, what they did online, and their performance in an online learning environment, and found that frequent accesses and interaction made the students learn more. Another example is the study of Boticki et al. (2015), who presented a mobile learning platform that relied on questions and promoted collaboration among students. Their results examined how the use of these tools, when focused on self-directedness (students manage their learning process on their own), quality of contributions, and answers to contextual questions, predicted the students’ examination results. Their findings suggested that badges or recognitions as an extrinsic motivational tool were related to an increase in the quantity and quality of the students’ contributions (interactions) and with better results in exams, given an appropriate educational context.
On the other hand, other studies found a negative association between learners’ interactivity and learning outcomes. For example, Song & McNary (2011) pointed out that interactivity did not necessarily mean an improvement in the learning outcomes, although most of the previous research supported the positive relationship between interactivity and satisfaction or engagement in online learning (Kent et al., 2016). In their study conducted with 18 students participating in an online course delivered via discussion board posting, Song & McNary found a considerable variability in the topic of postings across students and modules of the course, and more importantly, no correlation between the number of posts and student success measured as the global course mark. Their results showed that the theoretical foundation for determining what good quality interaction is and how it affects students’ learning success was lacking. In addition, some more recent studies show no significant relation between interactions and students’ perceived learning (Chaparro-Peláez et al., 2013), or the acquisition of generic competences like teamwork and commitment (Iglesias-Pradas et al., 2015).
These results are consistent with those showed by previous studies, being especially relevant the work of Picciano (2002) due to the wide approach used to capture interaction and also learning performance. In this study, he considered multiple measurements of interaction and sense of presence in a course, and different measurements of performance beyond the typical data on grades and withdrawal rates, including measurements specifically related to course objectives. The results concerning the effects exerted by actual postings on discussion boards and actual performance measurements related to the course objectives were not consistent, since they showed that there were no differences when learner interaction was low, medium or high. This result contrasted with the strong relationship detected between students’ perceptions of
the quality and quantity of interaction and their perceived performance, which noted the difference between the students’ perceptions about the relevance of interactivity for improving their learning performance and the actual association between the two.
The review of the above-mentioned studies concludes firstly, the lack of consensus concerning whether or not the relationship between learners’ interactivity and learning outcomes actually existed. Secondly, the excessive focus on quantitative indicators when analysing interactivity, such as posting frequency, the number of logins, the number of messages read, their lengths, the connection duration, etc. Online learning environments record most learning behaviours and provide large volumes of educational data (Foley & Kobaissi, 2006; Romero & Ventura, 2007), which most of the time teachers themselves do not know how to process and analyse (Paiva et al., 2016). Therefore, this interaction is mostly neglected in the evaluation of the knowledge construction and learning of students, and is not taken into account for effects on instructional and pedagogical issues. This fact explains that learners’ interactivity is rarely evaluated or considered as a learning evaluation metric (Kent et al., 2016). As Romero et al. (2013) stated: “with hundreds of contributions to review in an entire online forum, the instructor lacks a comprehensive view of the information embedded in the transcript […] and faced with the difficulty of interpreting and evaluating the learning and quality of the participation reflected in the students’ contributions”. Interactivity use, if any, has been restricted to reporting on student task completion or tracking students at risk of dropping out (Gašević et al., 2015), and it is not frequently used for assessing the learning process itself, the progress of the learners’ understanding, their ability to establish relationships among pieces of information and to build on existing knowledge (Reich, 2015). This knowledge gap makes it hard to discover more about the learning outcomes by considering learner interactivity (Song & McNary, 2011).
Nevertheless, some studies have integrated indicators more centred on the contents and quality of learner interaction and their effects on learning results. This research line has given an idea of what the interaction should be in order to be relevant for effective learning. A good example was the study of Ransdell (2013) that considered both the number of student posts and the tracking of meaningful posts, which are more difficult to produce and are more related to knowledge construction. The findings showed that online learning was highly correlated to meaningful posts, while the total online interactivity of students did not predict learning outcomes.
Research centred on the effects of the quality of interactivity on learning results (Gasevi et al., 2015; Kent et al., 2016; Ransdell, 2013), has frequently recommended the use of educational data mining techniques for extracting information and
conclusions. For example, Romero et al. (2013) proposed the use of different data mining techniques to predict whether students would pass their course or not, selecting instances and attributes and proposing different classification algorithms. They found that the students who passed a course were those that were more active in the forums not only in quantity but also in quality. The results of this study also concluded the suitability of using a subset of attributes and messages for the contents of the course instead of using all messages (Romero et al., 2013). However, this research centred on the quality of interactivity did not really develop an analysis of the content of the learners’ interactivity, and assessed this quality in terms of the centrality, prestige and value given to the messages (Romero et al., 2013), through the number of views or links on posts and the depth of viewed posts (Kent et al., 2016); through the analysis of different social network parameters (Hernández-García et al., 2015), etc., but left the actual content of learners’ interactivity mostly unexplored.
On the other hand, the studies centred on qualitative information have mainly applied a content analysis approach, but have neglected the use of educational data mining, avoiding to obtain a clearer model for the data in the discussion forums and transform them into an understandable structure for further use. Since the pioneer study of Henri (1992), who established several categories for analysing the cognitive dimensions of the learning process in computer conferencing environments, a wide variety of approaches has been used, which differ in their level of detail and the type of analysis categories used (De Wever et al., 2006). For example, Pena-Shaff & Nicholls (2004) used social constructivism learning theory to investigate the communication patterns and knowledge construction of students who used a computer bulletin board system. They analysed the content of the messages and the patterns of interactions and obtained a category system of indicators and descriptors, which included, among others: clarification, interpretation, conflict, assertion, consensus, judgement, reflection, questions, and support. Their results after revising 152 messages and 594 sentences, confirmed that student knowledge construction was mostly influenced by clarification, elaboration and reflection, although no correlation between these contents and learning outcomes was proved.
Another good example of the relevance of analysing content in learners’ interactivity is offered by the taxonomy of conversation behaviours of Soller (2001), used to distinguish effective from ineffective contributions in collaborative learning. This author identified three levels of skills that contributed to effective peer interaction: creative conflict, active learning and conversation, each of which was further divided into sub-skills, such as mediation, discussion, motivation, information, requirements, acknowledge, maintenance and task. The study indicated that successful online learning
was influenced by the acquisition of these skills, and recommended strategies for improving the most relevant ones, although it was restricted by certain limitations that avoided its generalization. In addition, although the work was based on case studies, it did not prove the correlation between these skills and learning outcomes.
Therefore, previous studies have offered only a partial view of the relationship between learning results and learners’ interactivity. This approach should be complemented by the quality and quantity indicators of learners’ interactions, centred on the content of student discussions, and supported by educational analytics, which allow teachers and instructors to really appreciate the learning construction favoured by peer-led discussion (Lonn et al., 2011). To fill this gap, the current study proposed research questions, which pretended to identify the most relevant contents and determine their effects on learning results by using NLP in students’ online forums. The response to these questions would allow us to understand more about:
- The most frequent contents in the online discussion forums of students while participating in a business simulation game,
- The game concepts in which the students were more interested, - Whether these concepts and contents were related,
- The contents, if any, that better explained and predicted the learning results, - Whether the contents that better explained and predicted the learning results were the same for different student performance indicators,
- The lessons teachers could extract from applying learning analytics to the online discussion forums of students while participating in a business simulation game.
3. Methodology
3.1. The business simulation game and online discussion forums
The purpose of this study related social interactivity and gamification as two elements that contribute to learning through communication and engagement. The game chosen to carry out this analysis was a business simulation game, Cesim Global Challenge (www.cesim.com), which is a management and strategy game that allows decision-making to be practiced by integrating various management-related disciplines, such as financial, human resources, accounting, production, logistics, research and innovation, taxes, and marketing.
Cesim Global Challenge simulates a business context in which players organised into teams develop and execute strategies for an international mobile telecommunications company operating in the USA, Asia and Europe. The focus of the game is centred on strategic management, international business, global operations and
business policy in a competitive and dynamic environment. The expected learning outcomes of this game is a better understanding of the complexity of global business and a comprehension of each of the management-related disciplines, highlighting the interrelationships between them, as well as valuable practices in teamwork, decision-making and problem solving. The simulation was inserted as a course that allows students to culminate and push forward knowledge and skills previously acquired during their studies in other subjects and disciplines. The game allows them to interrelate these previous knowledge and skills using a more practical orientation.
The game provided a participatory platform for students to contribute, share, and provide feedback by using online discussion forums that store this information for potential educational use. These forums were used to analyse the content of the students’ interactions. The use of the forums by students was not mandatory, so they could choose to use them, in isolation or in combination with other forms of communication, or not to use them at all. The teacher followed the suggestions of related research (Romero et al., 2013), and reminded students by email to participate in the online forums, trying to obtain a good level of participation, because the contributions of students to the online discussion forums constitute the only way for teachers/instructors to access to students’ interaction. In these emails, the instructor tried to motivate the students to participate in the forum, arguing that this tool offered a record of their involvement and work, and that this information was useful for the assessment of their performance in the game.
The students had two different online forums to share information with different participants during the game. The first one was the forum of the course (external forum), used to share information with all the participants in the same game, including the instructor. All the messages included in this forum also arrived to all the participants through email. The use of this first type was very marginal and only recorded test messages (e.g. “Hi, this is just a test”, “Hi, do you copy?? I am just entering now in the system…”), or messages to congratulate the winning teams (e.g. “Congratulations, Blue team”, “Congratulations Green team, but do not let your guard down, we will strike back…”).
The second type was the forum used to share information within the team (internal forum); thus, the messages were only visible for the members of each team and the instructor. The posts included in these internal forums did not arrive through email, so the team members and the instructor had to access explicitly to the internal forums to contribute and also to read the posts. Although the instructor had the chance to enter to the forum, the way to express doubts and communicate to the instructor was via email. It was explicitly recommended at the beginning of each game, because given the big
amount of information and contributions registered in the internal forums, some relevant information could be missing, being preferable that the communication with the instructor was more direct and personalized. These internal forums were frequently used by students within each team to record their decision-making process, and were the kind of learners’ interactions analysed in this study.
Some examples of the learners’ posts of these internal forums are included in Appendix 1.
3.2. Data collection
Data was collected from students of the Open University of Catalonia studying at bachelor and master levels. All the students were taking part in a non-compulsory subject concerning “Business Simulation and Practice” that involved participation in the business simulation game (Cesim Global Challenge), which was always administered online by the same teacher/instructor. Data were analysed from the students undertaking the subject and playing the game for nine consecutive academic semesters between 2011 and 2016.
The reason to conduct this study with information collected from students of the Open University of Catalonia obeys to the specific characteristics of this university. Its nature as an online educational institution makes that the students enrolled in its educational programmes share some specific features. For example, they frequently work and study at the same time, and their interactions are not face-to-face, but on the contrary, are based on the platforms and tools provided by digital technologies, like online discussion forums. These facts make them feel comfortable using digital technologies, and an interesting population to analyse the relationship between interactivity supported by digital technologies and learning outcomes.
We also decided to collect data from bachelor and master students. Previous research on the relationship between learners’ interactivity and learning outcomes has considered different populations to conduct their analyses, covering a wide range of educational levels, from primary school students (Boticki et al., 2015) to doctoral students (Song & McNary, 2011), passing through bachelor and master levels (Iglesias-Pradas et al., 2015; Wei et al., 2015). Also, some of these studies were focused just in one level (Boticki et al., 2015) or considered a mix of students from various educational levels and even academic disciplines (Kent et al., 2016; Song & McNary, 2011; Wei et al., 2015). However, none of the above-mentioned studies considered the educational level, or other demographic characteristics, like age or gender, to explain the differences in the association between learners’ interactivity and learning outcomes, comparing different groups of students. In our case, as mentioned before, the data belonged to
bachelor and master students, even although our focus was not on analysing the potential influence of the educational level on interactivity and learning outcomes. This decision was made to obtain a higher number of responses and because we did not expect relevant differences in the attitudes toward the use of digital technologies among them. As a matter of fact, students enrolled in educational programmes at the Open University of Catalonia are normally older than in traditional face-to-face educational institutions, and even despite two different educational levels were analysed, we expected that all the students would be prone to participate in the online discussion forums and would show a high experience in the use of educational digital technologies, which would justify that they had enrolled at the Open University of Catalonia in the first place. These expectations also applied to bachelor students, who had been enrolled at the Open University of Catalonia at least for two academic courses as far as they only could enrol in this non-compulsory subject “Business Simulation and Practice” during their third or fourth academic course at the university.
The population was composed of 442 students (60.2% at bachelor level and 39.8% at master level), who participated in the business simulation games by playing in teams. A total of 102 teams were considered, distributed between 16 different competitions.
Despite the advice of the teacher to use the online discussion forums of the game, not all the teams used these means of communication. The number of students who participated in these forums was 362, which represented an 81.9% sample of the population. Considering the final sample, 65.47% were bachelor students, while 34.53% were master students. Likewise, 59.4% were men and 40.6% were women. The average age of bachelor students was 32.43 old, and of master students was 37.72 years-old.
As it was indicated previously, only the internal forums were considered, being finally 84 the total number of forums.
3.3. Measurement of variables
The dependent variables included in this research were related to the students’ performance and their learning results. To measure the students’ learning results, their marks or grades (Marks) were considered for the subject where the business simulation game was implemented (Boticki et al., 2015; Kent et al., 2016; Song & McNary, 2011). The students were graded by considering various aspects, which consisted of three reports and the competitive position of the team in the game. The reports asked the students about their strategic and operational objectives, their competitive position, their main decisions and the reasons why they made them, the main adjustments in their
decision-making during the game, and the contribution of their decisions to their goals. Their performance and achievements in their grades while participating in the business simulation game were also considered. The success of players in the game was measured and compared by both operational and financial key performance indicators. These indicators included the following: the total cumulative shareholder return (TCSR), earnings per share (EPS), benefits at the end of the game (Profit), and the competitive position at the end of the game (Position), which provided the relative position of each team player in relation to the others (the lower the number, the better the position). The winners were decided in terms of the TCSR, which included the change in the value of shares, dividend paid out to shareholders by the company, and the interest that these dividends generated for the shareholders.
The 362 students participating in the sample contributed to 84 online discussion forums and posted a total of 11,017 messages. The complete text corpora contained 997,158 words in 100,758 lines of text, with an average of 11.2 lines per post (sd=9.48 lines) in an unstructured format.
With Catalonia being a bilingual region (Catalan and Spanish are de facto co-existing languages), forum content contained some messages in Catalan, some in Spanish and some mixing of both languages. All corpus was translated into Spanish, where necessary.
Natural language processing (NLP) consisted of pre-processing, creation of a data term matrix, and statistical analysis. Corpus was subject to a set of pre-processing steps, which were: white space stripping, conversion to lower case, removal of Spanish
stopwords1 (Rajaraman & Ullman, 2011) and removal of punctuation. Words in corpus
were stemmed (suffix stripped; Porter, 1980) using the Spanish stemmer implemented in the tm R package (v. 0.6-2; Feinerer et al., 2008). The stemmed corpus was later used to construct a document term matrix (DTM) containing the frequency of terms per forum in a sparse matrix representation of the corpora. Sparse terms were removed from the DTM (80% sparsity threshold). The DTM was normalized to the number of occurrences per message per forum. All NLP was carried out using R, version 3.3.2 (R Core Team, 2016) and the tm R package (v. 0.6-2, Feinerer et al., 2008).
4. Data analysis
Two different types of analyses were conducted in order to achieve the goals of this study. The first concerned exploratory analyses for describing the main 1stopwords list accessed from http://snowball.tartarus.org/algorithms/spanish/stop.txt, on 31/01/2017
characteristics of the variables of this study, especially in terms of communication patterns of students from the stemmed corpus; whereas the second analyses were more ambitious and had a greater explanatory nature that looked for the contents in the text corpora that were more related to the students’ learning results.
4.1. Exploratory analyses
As already mentioned, the students played the game organised in teams, and the average number of students in each team was 4.2. The average number of teams competing in each game was 6.375.
Table 1 displays the descriptive statistics for the dependent variables related to the students’ learning results.
Table 1. Descriptive statistics of dependent variables
Variables Min Max Mean SD
Marks 6.5 10 8.163 0.898
TCSR -91.866 23.912 -1.247 18.992
EPS -46.94 110.40 12.269 22.849
Profit -199,562 4,415,874 363,982 846,336.8
Position 1.000 11.000 3.849 2.38
Marks: Marks or grades of students in the subject where the business simulation game was implemented TSCR: Total cumulative shareholder return
EPS: Earnings per share
Profit: Benefits at the end of the round
Position: Competitive position at the end of the game
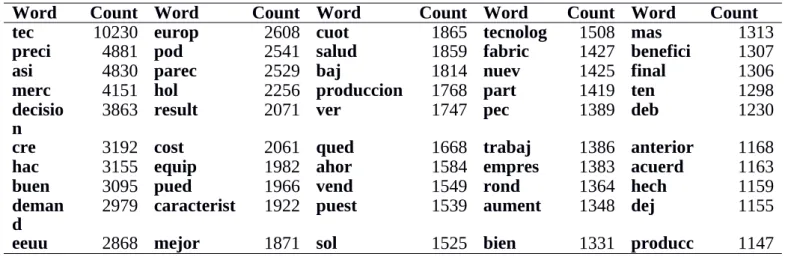
In terms of the online discussion forums, a description of the most frequent stems in the text corpora appears in Table 2, which displays the absolute count of the most frequent stems or roots in the corpus.
Table 2. Absolute count of most frequent stems
Word Count Word Count Word Count Word Count Word Count
tec 10230 europ 2608 cuot 1865 tecnolog 1508 mas 1313
preci 4881 pod 2541 salud 1859 fabric 1427 benefici 1307
asi 4830 parec 2529 baj 1814 nuev 1425 final 1306
merc 4151 hol 2256 produccion 1768 part 1419 ten 1298
decisio
n 3863 result 2071 ver 1747 pec 1389 deb 1230
cre 3192 cost 2061 qued 1668 trabaj 1386 anterior 1168
hac 3155 equip 1982 ahor 1584 empres 1383 acuerd 1163
buen 3095 pued 1966 vend 1549 rond 1364 hech 1159
deman
d 2979 caracterist 1922 puest 1539 aument 1348 dej 1155
This analysis showed that some of the most frequent stems referred to related concepts. For example, it can be seen that stems like technology and R&D development appeared very frequently, and these concepts are strongly related. This result was coherent with the core business of the simulated company in the game with stems such as “tec” (with appeared 10,230 times) and “caracterist” (1,922 times) representing the features added to each technology through R&D investments, and “tecnolog” (1,508 times). There were also frequent stems related among them as far as they referred to functional areas simulated in the game, such as “demand” (which appeared 2,980 times), “produccion”, which is the Spanish word for production (1,768 times), and word roots related to marketing and sales, such as “vend” (1,549 times), which is the root of the Spanish word for sales or to sell. Terms relative to position or that implied comparison also emerged in several topics in the corpus, as can be observed for the stems “mejor” (1,871 times), the Spanish word for better or best, and “puest” (1,539 times) related to position. In addition, there were frequent stems that involved decision-making, both the action of deciding itself as well as the object of the decisions. For example, the stem “decision” appeared 3,863 times, which could be expected since the game simulated the decision-making process at the top of a company, “acuerd” that refers to agreement or agree (1,163 times), “merc” referring to market (4,151 times) and “preci” referring to price (4,881 times), as well as “EEUU” referring to the USA (2,868 times) and “Europ” (2,608 times) as two of the markets where the simulated company worked. Some frequent stems also appeared that referred to the results and performance of the simulated companies as a consequence of their decision-making. This was the case for stems such as “result” (2,071 times), “cost” (2,061 times), or
“cuot” referring to the market share (1,865 times). Finally, there were frequent stems regarding teamwork, such as “equip” referring to the teams (1,982 times); time, such as “rond” that is the Spanish stem for round or period of time in which the game was split; or stems associated with generic actions, such as “pued” linked to the verb to be able,
“parec” linked to the verb to seem, “hac” referring to the verb to do, or “ver” linked to the verb to see.
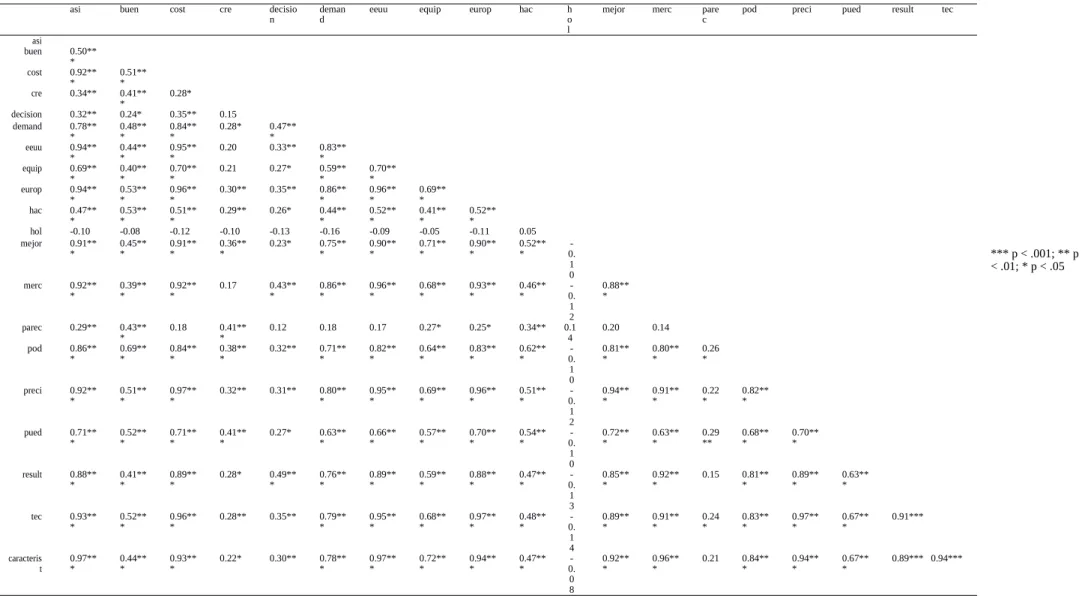
These exploratory analyses offer a first description of interactivity among students, indicating the most frequent stems, which show what the students’ conversations were about, and also suggesting the existence of some kind of relationships between the most frequent stems and concepts that appeared in the students’ online discussion forums. To confirm these relations, we conducted the bivariate correlation between the most frequent terms per posts. This analysis is depicted in Table 3 for 20 of the most frequent stems. In Appendix 2 and 3, the
correlation matrix and the correlogram (Feinerer et al., 2008) for the 50 most frequent stems have been also included.
Table 3. Correlation matrix
*** p < .001; ** p < .01; * p < .05
asi buen cost cre decisio
n demand eeuu equip europ hac ho
l
mejor merc pare
c pod preci pued result tec
asi buen 0.50** * cost 0.92** * 0.51*** cre 0.34** 0.41** * 0.28* decision 0.32** 0.24* 0.35** 0.15 demand 0.78** * 0.48*** 0.84*** 0.28* 0.47*** eeuu 0.94** * 0.44*** 0.95*** 0.20 0.33** 0.83*** equip 0.69** * 0.40*** 0.70*** 0.21 0.27* 0.59*** 0.70*** europ 0.94** * 0.53*** 0.96*** 0.30** 0.35** 0.86*** 0.96*** 0.69*** hac 0.47** * 0.53*** 0.51*** 0.29** 0.26* 0.44*** 0.52*** 0.41*** 0.52*** hol -0.10 -0.08 -0.12 -0.10 -0.13 -0.16 -0.09 -0.05 -0.11 0.05 mejor 0.91** * 0.45*** 0.91*** 0.36*** 0.23* 0.75*** 0.90*** 0.71*** 0.90*** 0.52*** 0. -1 0 merc 0.92** * 0.39*** 0.92*** 0.17 0.43*** 0.86*** 0.96*** 0.68*** 0.93*** 0.46*** 0. -1 2 0.88** * parec 0.29** 0.43** * 0.18 0.41*** 0.12 0.18 0.17 0.27* 0.25* 0.34** 0.14 0.20 0.14 pod 0.86** * 0.69*** 0.84*** 0.38*** 0.32** 0.71*** 0.82*** 0.64*** 0.83*** 0.62*** 0. -1 0 0.81** * 0.80*** 0.26* preci 0.92** * 0.51*** 0.97*** 0.32** 0.31** 0.80*** 0.95*** 0.69*** 0.96*** 0.51*** 0. -1 2 0.94** * 0.91*** 0.22* 0.82*** pued 0.71** * 0.52*** 0.71*** 0.41*** 0.27* 0.63*** 0.66*** 0.57*** 0.70*** 0.54*** 0. -1 0 0.72** * 0.63*** 0.29** 0.68*** 0.70*** result 0.88** * 0.41*** 0.89*** 0.28* 0.49*** 0.76*** 0.89*** 0.59*** 0.88*** 0.47*** 0. -1 3 0.85** * 0.92*** 0.15 0.81*** 0.89*** 0.63*** tec 0.93** * 0.52*** 0.96*** 0.28** 0.35** 0.79*** 0.95*** 0.68*** 0.97*** 0.48*** 0. -1 4 0.89** * 0.91*** 0.24* 0.83*** 0.97*** 0.67*** 0.91*** caracteris t 0.97*** 0.44*** 0.93*** 0.22* 0.30** *0.78** 0.97*** 0.72*** 0.94*** 0.47*** 0. -0 8 0.92** * 0.96*** 0.21 0.84*** 0.94*** 0.67*** 0.89*** 0.94***
The correlation matrix and the correlogram show that, by considering the bivariate correlations between the most frequent stems, it could be concluded in general that these correlations existed (except for small exceptions), were positive, and were quite strong between some of the stems. This result indicated that the most frequent contents appeared together, were not mutually exclusive, and formed a whole idea expressed by students concerning game development. The strongest correlations were observed between stems such as “demand”, “pod”, “sol”, “result”, “anterior”, “tec”, “Europ”, “cost”, “preci”, “aument”, “benefici”, “ten”, “cuot”, “EEUU”, “merc”, “empres”, “tecnolog”, “fabric”, “produccion”, “acuerd”, “baj”, “asi”, “caracterist”, “rond”, and “major”. This list of stems again highlighted the relationship in the students’ interactions between concepts such as technology, decision-making and seeking agreements, as well as functional areas such as production, demand and sales, outcomes such as results or costs, relative positions such as to enhance or to fall, and concepts related to time, such as round or past.
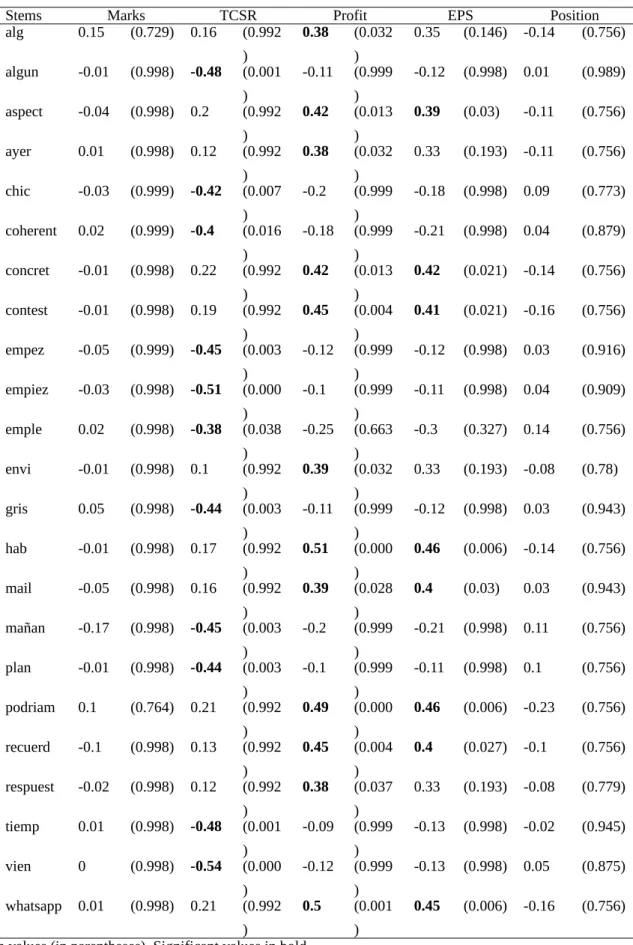
In addition, Table 4 shows the univariate correlation between the most frequent stems with significant effects on some of the five indicators related to the learning results (Pearson’s correlation). A total of 23 stems were found that individually correlated with some of the students’ learning results metrics, which suggest the convenience of conducting also explanatory analyses to determine the stems that better explain and predict the learning results.
Table 4. Pearson correlation coefficients between stems and learning results (univariate analysis)
Stems Marks TCSR Profit EPS Position
alg 0.15 (0.729) 0.16 (0.992 ) 0.38 (0.032 ) 0.35 (0.146) -0.14 (0.756) algun -0.01 (0.998) -0.48 (0.001 ) -0.11 (0.999 ) -0.12 (0.998) 0.01 (0.989) aspect -0.04 (0.998) 0.2 (0.992 ) 0.42 (0.013 ) 0.39 (0.03) -0.11 (0.756) ayer 0.01 (0.998) 0.12 (0.992 ) 0.38 (0.032 ) 0.33 (0.193) -0.11 (0.756) chic -0.03 (0.999) -0.42 (0.007 ) -0.2 (0.999 ) -0.18 (0.998) 0.09 (0.773) coherent 0.02 (0.999) -0.4 (0.016 ) -0.18 (0.999 ) -0.21 (0.998) 0.04 (0.879) concret -0.01 (0.998) 0.22 (0.992 ) 0.42 (0.013 ) 0.42 (0.021) -0.14 (0.756) contest -0.01 (0.998) 0.19 (0.992 ) 0.45 (0.004 ) 0.41 (0.021) -0.16 (0.756) empez -0.05 (0.999) -0.45 (0.003 ) -0.12 (0.999 ) -0.12 (0.998) 0.03 (0.916) empiez -0.03 (0.998) -0.51 (0.000 ) -0.1 (0.999 ) -0.11 (0.998) 0.04 (0.909) emple 0.02 (0.998) -0.38 (0.038 ) -0.25 (0.663 ) -0.3 (0.327) 0.14 (0.756) envi -0.01 (0.998) 0.1 (0.992 ) 0.39 (0.032 ) 0.33 (0.193) -0.08 (0.78) gris 0.05 (0.998) -0.44 (0.003 ) -0.11 (0.999 ) -0.12 (0.998) 0.03 (0.943) hab -0.01 (0.998) 0.17 (0.992 ) 0.51 (0.000 ) 0.46 (0.006) -0.14 (0.756) mail -0.05 (0.998) 0.16 (0.992 ) 0.39 (0.028 ) 0.4 (0.03) 0.03 (0.943) mañan -0.17 (0.998) -0.45 (0.003 ) -0.2 (0.999 ) -0.21 (0.998) 0.11 (0.756) plan -0.01 (0.998) -0.44 (0.003 ) -0.1 (0.999 ) -0.11 (0.998) 0.1 (0.756) podriam 0.1 (0.764) 0.21 (0.992 ) 0.49 (0.000 ) 0.46 (0.006) -0.23 (0.756) recuerd -0.1 (0.998) 0.13 (0.992 ) 0.45 (0.004 ) 0.4 (0.027) -0.1 (0.756) respuest -0.02 (0.998) 0.12 (0.992 ) 0.38 (0.037 ) 0.33 (0.193) -0.08 (0.779) tiemp 0.01 (0.998) -0.48 (0.001 ) -0.09 (0.999 ) -0.13 (0.998) -0.02 (0.945) vien 0 (0.998) -0.54 (0.000 ) -0.12 (0.999 ) -0.13 (0.998) 0.05 (0.875) whatsapp 0.01 (0.998) 0.21 (0.992 ) 0.5 (0.001 ) 0.45 (0.006) -0.16 (0.756)
Table 4 shows that the words with relationships with some learning outcome metrics, when they could be clearly identified by their stems, were the following:
“something”, “any”, “aspect”, “yesterday”, “coherent”, “precise”, “answer”,
“begin”, “employ”, “mail”, “tomorrow”, “plan”, “could”, “remember”, “time”, and
“whatsapp”. Some of these stems referred to similar concepts that pointed to uncertainty (“something”, “any”, “plan”, “could”), time (“yesterday”, “tomorrow”), interaction and collaboration (“could”, because the Spanish stem used implied a group of people), and communication media (“mail”, “whatsapp”).
The effect of all these stems on learning results was statistically significant and positive for Profit and EPS, which meant that, a greater presence of these stems in the corpus indicated a better learning result in terms of Profit and EPS. When TCSR was considered as the indicator of the learning result the findings showed the opposite, meaning that the higher the appearance of these stems, the lower the TCSR. These results were obtained especially for some stems related to actions such as “to begin”,
“to employ”, “to see” and “to plan”. No significant effect was observed for the rest of the relevant concepts, such as time, interaction, collaboration, and communication.
4.2. Explanatory analyses
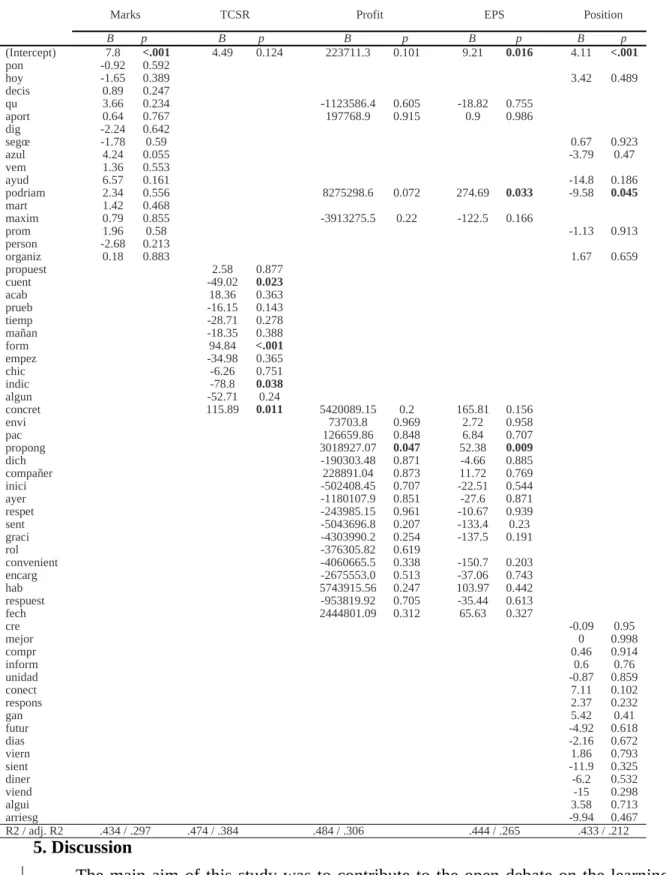
The second analyses aimed to build a linear model to explain the effects, if any, that the most frequent contents in the students’ online forums exerted on their learning results.
Table 5 showed to which extent the variance of the learning results could be explained by linear multivariate models of the stem vectors. The models could explain approximately between 21% and 38% of the variance of the learning results, depending on the model, with two stems having significant influence on more than one metric of the learning results. These stems were “podriam” (“could” in English) and “propong”
(“propose” in English). Both of them had a positive influence on learning results. The first one, “podriam”, had a positive effect on EPS and a negative effect for Position (β=274.69, p<0.05 for EPS and β=-9.58, p<0.05 for Position). The second one,
“propong”, had a positive influence on Profit and EPS (β=3018927.07, p<0.05 for Profit and β=52.38, p<0.01 for EPS). These stems were related to uncertainty, collaboration, decision-making or establishing alternatives, which are concepts from the very essence of the simulation business game used.
Table 5. Multivariate linear models
5. Discussion
The main aim of this study was to contribute to the open debate on the learning impacts of student interactivity. Therefore, advanced learning analytics were applied following the suggestions of previous research (Romero et al., 2013) and, more
Marks TCSR Profit EPS Position
B p B p B p B p B p (Intercept) 7.8 <.001 4.49 0.124 223711.3 0.101 9.21 0.016 4.11 <.001 pon -0.92 0.592 hoy -1.65 0.389 3.42 0.489 decis 0.89 0.247 qu 3.66 0.234 -1123586.4 0.605 -18.82 0.755 aport 0.64 0.767 197768.9 0.915 0.9 0.986 dig -2.24 0.642 segœ -1.78 0.59 0.67 0.923 azul 4.24 0.055 -3.79 0.47 vem 1.36 0.553 ayud 6.57 0.161 -14.8 0.186 podriam 2.34 0.556 8275298.6 0.072 274.69 0.033 -9.58 0.045 mart 1.42 0.468 maxim 0.79 0.855 -3913275.5 0.22 -122.5 0.166 prom 1.96 0.58 -1.13 0.913 person -2.68 0.213 organiz 0.18 0.883 1.67 0.659 propuest 2.58 0.877 cuent -49.02 0.023 acab 18.36 0.363 prueb -16.15 0.143 tiemp -28.71 0.278 mañan -18.35 0.388 form 94.84 <.001 empez -34.98 0.365 chic -6.26 0.751 indic -78.8 0.038 algun -52.71 0.24 concret 115.89 0.011 5420089.15 0.2 165.81 0.156 envi 73703.8 0.969 2.72 0.958 pac 126659.86 0.848 6.84 0.707 propong 3018927.07 0.047 52.38 0.009 dich -190303.48 0.871 -4.66 0.885 compañer 228891.04 0.873 11.72 0.769 inici -502408.45 0.707 -22.51 0.544 ayer -1180107.9 0.851 -27.6 0.871 respet -243985.15 0.961 -10.67 0.939 sent -5043696.8 0.207 -133.4 0.23 graci -4303990.2 0.254 -137.5 0.191 rol -376305.82 0.619 convenient -4060665.5 0.338 -150.7 0.203 encarg -2675553.0 0.513 -37.06 0.743 hab 5743915.56 0.247 103.97 0.442 respuest -953819.92 0.705 -35.44 0.613 fech 2444801.09 0.312 65.63 0.327 cre -0.09 0.95 mejor 0 0.998 compr 0.46 0.914 inform 0.6 0.76 unidad -0.87 0.859 conect 7.11 0.102 respons 2.37 0.232 gan 5.42 0.41 futur -4.92 0.618 dias -2.16 0.672 viern 1.86 0.793 sient -11.9 0.325 diner -6.2 0.532 viend -15 0.298 algui 3.58 0.713 arriesg -9.94 0.467 R2 / adj. R2 .434 / .297 .474 / .384 .484 / .306 .444 / .265 .433 / .212
specifically, natural language processing (NLP) was used for student online forums while participating in business simulation games.
Two research questions were proposed. The first research question was: What are the most frequent contents that appeared in students’ interaction, which determined the communication pattern in their online discussion forums? The application of NLP allowed us to stem words in the corpus and build a document term matrix (DTM) containing the frequency of terms per forum in a matrix that represented the text corpora.
The findings confirm that the most frequent stems were related to relevant concepts of the business simulation game and, to a lesser extent, to the learning process itself. The most frequent stems referred to technology and R&D investments, decision-making and seeking agreements, time, the functional areas recreated in the game (production, demand, sales), or the relevance of obtaining a position and the importance of relativeness because the decisions in the game would be good or bad depending on what the other players also decided. In addition, other frequent stems referred to certain relevant game parameters, such as plants, prices, markets, business or enterprises, etc., or they referred to measurements of performance in the game, such as the results or costs of the simulated companies. Finally, there were also frequent stems that referred to generic actions, such as to do or to make, to observe or to see, to propose, to seem or to be able. Some of these actions implied uncertainty and collaboration, as far as they were not developed individually, and they were also relevant parameters in the design of the game. Therefore, it was concluded by analysing all these frequent stems that the students’ interactions were concerned with specific features and parameters of the game, more than simple conversation or small talk. Another interesting conclusion was that students’ interactions involved more of these specific characteristics of the game than terms related to the learning process itself, which implied, for example, clarification, interpretation, discussion, conflict, assertion, motivation, acknowledge, consensus, judgement, reflection, questions, and support, among others (Pena-Shaff & Nicholls, 2004; Soller, 2001). In the text corpora, stems more related to the learning process were those referring to seeking agreement, uncertainty and collaboration.
Another interesting topic for discussion in the exploration of the communication patterns of the students was the relationship, if any, between the most frequent stems. The analysis confirmed that there were strong positive correlations between many of the most frequent stems, which meant that these stems together confirmed the ideas behind the students’ interactions. The strongest correlations highlighted the relationship between concepts such as technology, decision-making, seeking agreements, production, demand, sales, cost, results, relativeness and time.
The second research question was: What are the content that better explained and predicted the students’ learning results? The findings showed that there were stems with a certain type of significant influence on the learning results metrics. These stems pointed to relevant concepts directly related to learning results, which were uncertainty, decision-making, establishing alternatives, time, interaction, collaboration and communication. This latter was especially interesting because students with better learning results frequently included references to other communication media in their conversations, such as mail or whatsapp, which indicated that the online discussion forums were unable to capture all the students’ interactivity.
It was also interesting to note that the relationship of these concepts was not the same for all the learning results metrics considered in the study. For example, Profit, Earnings per share (EPS) and Position had a positive relationship with communication, uncertainty, collaboration, decision-making or time, while Total cumulative shareholder return (TCSR) was basically negatively related to actions involved in the development of the game, such as employ, see, begin or plan. Therefore, it was concluded that general actions involved in the students’ conversation did not really have a positive relationship with learning results but that, on the contrary, stems highlighting ideas around communication, uncertainty, decision, collaboration and time frequently emerged in the conversation of students who outperformed in the business simulation game. Another relevant result was that no stem had a significant relationship with Marks, which was the learning metric directly proposed by the teacher. This result was in line with previous research stating that teachers evaluated and assessed the learning process of students but neglected their interactions (Kent et al., 2016) because they often did not know how to process and analyse these huge quantities of data (Paiva et al., 2016). This finally meant that they assessed students and took educational and pedagogical decisions without looking into the learning process that students developed through collaboration and interaction when they used online methodologies (Reich, 2015).
These results highlight some relevant contributions in the field of learning analytics and more specifically, in the applications of cognitive computing as a pillar for innovation in learning. Firstly, this study makes a contribution in a field that is not fully mature (Kent et al., 2016), like the assessment of learning outcomes using analytics, and indicates the value of learning analytics tools, like natural language processing, to explore the students’ learning outcomes through their interactions, confirming the contribution of online interactivity for autonomous learning.
Secondly, this study contributes to the advance of learning analytics research, providing a learning analytics tool to deeply explore students’ interactions through
content analysis. This approximation to the study of learners’ interactivity and learning outcomes overcomes some limitations of previous research, mostly centred in qualitative analyses of interactivity that neglected learning analytics tools; or focused on the use of learning analytics tools from a quantitative perspective that limited the information extracted from interactions and neglected the analysis of their content.
Finally, the results of this research offer information for instructors about the specific content of the autonomous learning developed by students through their online interactions. This valuable information allows instructors to assess the learning process itself, the progress of the learners’ understanding, their ability to relate contents and to build on existing knowledge.
6. Conclusions
This study has highlighted that advanced educational analytics and data mining techniques are useful tools for teachers and instructors because they allow them to discover more about the learning process of their students, especially when they are not in a face-to-face situation, but rather involve in online educational activities.
Based on the findings, the present study has several important implications for future researchers on learning analytics and also for educators.
With regard to learning analytics research, this study shows that educational analytics and data mining techniques, such as NLP, in students’ online discussion forums constitute powerful instruments to understand the most relevant aspects in the students’ communication related to their learning outcomes. This communication takes place not involving instructors, and reveals different aspects to the ones appeared when instructors take part in the communication. NLP allows instructors to gain a wider and more holistic view of the learning process of students, discovering aspects and contents that affect students’ learning results and that perhaps were previously neglected or avoided as a consequence of instructors’ misinformation.
With regard to the implications for educators, in the specific case of business simulation games, this study established that to improve the learning results of students, teachers should pay special attention to the uncertainty involved in the game. Most of the learning problems of students when participating in business simulation games are caused by how they face uncertainty. In traditional learning environments, students generally do not develop the capacity to deal with uncertain situations, and at the beginning, when they start their participation in the game, this uncertainty takes them out of their comfort zone with negative effects on learning. Instructors should pay special attention to this problem, which might cause students’ demotivation and jeopardize their achievements, and consider how students address uncertainty as a
relevant aspect of their performance in the game. To do so, instructors must be aware of the concerns of students related to risk and insecure situations derived from managerial decision-making, asking the students to express these concerns and looking for solutions that would make the students more comfortable at dealing with uncertainty and risk, for assessing afterwards how have they evolved in dealing with these situations. For example, specific discussion groups could be formed, where the doubts that emerge from uncertainty could be shared with the teacher or the rest of the classmates. Teachers should also motivate collaborative work among students, not just by forming groups but also work teams, looking for the best team composition in order to foster this collaboration. They should also promote more fluent communication within the teams, which may include different media, and encourage active roles in the students by proposing different alternatives and solutions to apply in the decision-making process. Finally, teachers must be aware of the students’ skills in terms of time management, investigate which teams have problems with this ability and propose activities that develop such skills.
According to the results, the promotion of these aspects centred on uncertainty, collaboration, interaction, communication, decision-making and time management will improve the learning results of students. In fact, to be fair, all the student advances and improvements in these topics should be included in the teachers’ assessments and be considered in the students’ final marks, which would force the redesign of the evaluation parameters applied by teachers.
Nevertheless, this study also had limitations, such as the inability to capture all the communications developed by students while playing because, despite the teachers’ advice, some of them neglected to participate in the online discussion forums.
In addition, although the literature recognises that different types of students in terms of gender, age, or experience, could react differently with regard to their interactions with technology (Tao et al., 2012), this study did not consider these effects. To the authors’ best knowledge, although previous studies measured the experience in the use of digital technologies with educational purpose, together with other demographic characteristics like gender, level of education or ethnicity, when they describe their samples (Iglesias-Pradas et al., 2015; Picciano, 2002; Romero et al., 2013; Song & McNary, 2011; Wei et al., 2012), these features were not included in their analyses, and were not taken into account as explanatory or moderator variables of the students’ learning outcomes when analysing the influences of interactivity either. Therefore, the lack of consistency in the findings of previous research with regard to the relationship between interactivity and learning outcomes could be better understood if the different types and segments of students were taken into account. An interesting
research line for the future could be to include in this kind of analyses not only contents but also some demographic features of students, to better understand how is the relationship between interactivity and leaning outcomes when different types of students are considered.
The inclusion of more varied variables, comparative analyses among students’ categories, as well as different advanced learning analytics, including non-linear analyses, could improve the knowledge related to the learning process derived from students’ online discussion forums. Also, the design of causal inference model networks, and independent component analysis with this data, will constitute interesting methodologies and research lines to be developed in the future.
ACKNOWLEDGEMENTS
AP acknowledges the support of TEC2014-60337-R grants from the Ministerio de Economía y Competitividad (MINECO). AP is part of the 2014SGR-1063 consolidated research group of the Generalitat de Catalunya, Spain. CIBER of Bioengineering, Biomaterials and Nanomedicine is an initiative of ISCIII.
References
Adeyinka, T., & Abdulmumin, I. (2011). Pattern of undergraduate's participation in the online discussion forum at the Univeristy of Ilorin, Nigeria. Management, Journal of Information Technology, XXII (3), 59-76.
ISSN #1042-1319
Agudo-Peregrina, A. F., Iglesias-Pradas, S., Conde-González, M. A., & Hernández-García, A. (2014). Can we predict success from log data in VLEs? Classification of interactions for learning analytics and their relation with performance in VLE-suported F2F and online learning. Computers in Human Behavior, 31, 542-550. http://dx.doi.org/10.1016/j.chb.2013.05.031
Asterhan, C. S. C., & Hever, R. (2015). Learning from reading argumentive group discussions in facebook: Rhetoric style matters (again). Computers in Human Behavior, 53, 570-576.
Boticki, I., Baksa, J., Seow, P., & Looi, C. K. (2015). Usage of a mobile social learning platform with virtual badges in a primary school. Computers & Education, 86, 120-136.
http://dx.doi.org/10.1016/j.compedu.2015.02.015
Chaparro-Peláez, J., Iglesias-Pradas, S., Pascual-Miguel, F. J., & Hernández-García, A. (2013). Factors affecting perceived learning of engineering students in problem based learning supported by business simulation. Interactive Learning Environments, 21 (3), 244-262.
https://doi.org/10.1080/10494820.2011.554181
Cheng, G., & Chau, J. (2014). Exploring the relationship between learning styles, online participation, learning achievement and course satisfaction: An empirical study of a blended learning course. British Journal of Educational Technology, 47, 257– 278.
http://dx.doi.org/10.1111/bjet.12243
De Wever, B., Schellens, T., Valcke, M., & Van Keer, H. (2006). Content analysis schemes to analyze transcripts of online asynchronous discussion groups: A review. Computers & Education, 46 (1), 6-28.
http://dx.doi.org/10.1016/j.compedu.2005.04.005
Feinerer, I., Hornik, K., & Meyer, D. (2008). Text Mining Infrastructure in R. Journal of Statistical Software, 25, 1-54.
https://www.jstatsoft.org/article/view/v025i05 (doi: 10.18637/jss.v025.i05)
Fitó-Bertrán, A., Hernández-Lara, A. B., & Serradell-López, E. (2015). The effect of competences on learning results: An educational experience with a business simulator. Computers in Human Behavior, 51, 910-914.
http://dx.doi.org/10.1016/j.chb.2014.11.003
Foley, B. J., & Kobaissi, A. (2006). Using virtual chat to study in informal learning in online environments. In: American Educational Research Association: Annual Meeting, San Francisco, CA.
Gašević, D., Dawson, S., & Siemens, G. (2015). Let’s not forget: Learning analytics are about learning. TechTrends, 59, 64-71.
http://dx.doi.org/10.1007/s11528-014-0822-x
Gilbert, L., & Moore, D. R. (1998). Building interactivity into web courses: Tools for social and instructional interaction. Educational Technology, 38, 29-35.
ISSN: ISSN-0013-1962
Henri, F. (1992). Online education: Perspectives on a new environment. NY: Praeger.
Hernández-García, A., González-González, I., Jiménez-Zarco, A. I., & Chaparro-Peláez, J. (2015). Applying social learning analytics to message boards in online distance learning: A case study. Computers in Human Behavior, 47, 68-80.
https://doi.org/10.1016/j.chb.2014.10.038
Iglesias-Pradas, S., Ruíz-de-Azcárate, C., Agudo-Peregrina, A. F. (2015). Assessing the suitability of student interactions from Moodle data log as predictors of cross-curricular competencies. Computers in Human Behaviour, 47, 81-89.
https://doi.org/10.1016/j.chb.2014.09.065
John, P., & Wheeler, S. (2012). The digital classroom: Harnessing technology for the
future of learning and teaching. New York, NY: Routledge.
ISBN: 9781843124450
Kent, C., Laslo, E., & Rafaeli, S. (2016). Interactivity in online discussions and learning outcomes. Computers & Education, 97, 116-128.
http://dx.doi.org/10.1016/j.compedu.2016.03.002
Liaw, S., & Huang, H. (2000). Enhancing interactivity in web-based instruction: A review of the literature. Educational Technology, 40, 41-45.
https://eric.ed.gov/?id=EJ606830
Lonn, S., Teasley, S. D., & Krum, A. E. (2011). Who needs to do what where? Using
learning management systems on residential vs. Commuter campuses. Computers
& Education, 53, 686-694.
Moore, M. G. (1989). Three types of interaction. The American Journal of Distance Education, 3, 1-6.
http://aris.teluq.uquebec.ca/portals/598/t3_moore1989.pdf
Moore, M. G., & Kearsley, G. (1996). Distance education: A systems view. Belmont, CA: Wadsworth Publishing Company.
Noeth, R. J., & Volkov, B. B. (2004). Evaluating the effectiveness of technology in our schools. ACT policy report. Washington, DC: ACT.
Northrup, P. (2001). A framework for designing interactivity into web-based instruction. Educational Technology, 41, 31-39.
https://eric.ed.gov/?id=EJ625228
Paiva, R., Bittencourt, I. I., Tenório, T., Jaques, P., & Isotani, S. (2016). What do students do on-line? Modelling students’ interactions to improve their learning experience. Computers in Human Behavior, 64, 769-781.
http://dx.doi.org/10.1016/j.chb.2016.07.048
Pando-Garcia, J., Periañez-Cañadillas, I., & Charterina, J. (2015). Business simulation games with and without supervision: An analysis based on the TAM model.
Journal of Business Research, 69, 1731-1736.
http://www.sciencedirect.com/science/article/pii/S0148296315004695 (doi: 10.1016/j.jbusres.2015.10.046).
Pena-Shaff, J. B., & Nicholls, C. (2004). Analyzing student interactions and meaning construction in computer bulletin board discussion. Computers & Education, 42, 243-265.
http://dx.doi.org/10.1016/j.compedu.2003.08.003
Picciano, A. G. (2002). Beyond student perceptions: Issues of interaction, presence, and performance in an online course. Journal of Asynchronous Learning Network, 6, 21-40.
http://www.anitacrawley.net/Articles/Picciano2002.pdf
Porter, M. F. (1980). An algorithm for suffix stripping. Program, 14.3, 130-137. http://www.cs.toronto.edu/~frank/csc2501/Readings/R2_Porter/Porter-1980.pdf
Rajaraman, A., & Ullman, J.D. (2011) Mining of Massive Datasets. Cambridge University Press.
R Core Team (2016). R: A language & environment for statistical computing. Vienna: R Foundation for Statistical Computing.
Ransdell, S. (2013). Meaningful posts and online learning in Blackboard across four cohorts of adult learners. Computers in Human Behavior, 29, 2730-2732.
http://dx.doi.org/10.1016/j.chb.2013.07.021
Reich, B. J. (2015). Rebooting MOOC Research. Science, 347, 34-35. http://science.sciencemag.org/content/347/6217/34
(doi: 10.1126/science.1261627).
Romero, C., & Ventura, S. (2007). Educational data mining: A survey from 1995 to 2005. Expert Systems with Applications, 33, 135-146.
http://dx.doi.org/10.1016/j.eswa.2006.04.005
Romero, C., López, M. I., Luna, J. M., & Ventura, S. (2013). Predicting students’ final performance from participation in on-line discussion forums. Computers & Education, 68, 458-472.
http://dx.doi.org/10.1016/j.compedu.2013.06.009
Soller, A. L. (2001). Supporting social interaction in an intelligent collaborative learning system. International Journal of Artificial Intelligence in Education, 12, 40-62. https://telearn.archives-ouvertes.fr/hal-00197321/document
Song, N., & McNary, S. W. (2011). Understanding students’ online interaction: Analysis of Discussion Board Posting. Journal of Interactive Online Learning, 10, 1-14. http://www.ncolr.org/jiol/issues/pdf/10.1.1.pdf
Soo, K. S., & Bonk, C. J. (1998). Interaction: What does it mean in online distance education? In: Proceedings of the World Conference on Educational Multimedia and Hypermedia & World Conference on Educational Telecommunications. ED-MEDIA/ED-TELECOM 98, Freiburg, Germany.
Swan, K. (2002). Building learning communities in online courses: The importance of interaction. Education,Communication &