Quality of Experience in Telepresence and Remote Collaboration Cloud
Services
Pedro Casas, Dimitra Paraskevopoulou, Giuseppe Settanni,
Stefan Suette, Patrick Zwickl, Raimund Schatz
Telecommunications Research Center Vienna - FTW
{surname}@ftw.at
Abstract
Cloud-based systems are gaining enormous popularity due to a number of promised benefits, including ease of use in terms of deployment, administration and mainte-nance, high scalability and flexibility to create new ser-vices, and others. However, as more personal and busi-ness applications migrate to the Cloud, the quality of the service becomes an important differentiator between providers. This paper addresses the problem of Qual-ity of Experience in Telepresence and Remote Collabora-tion (TRC) services provided by Microsoft Lync Online (MLO). MLO is a Cloud-based service providing online meeting capabilities including videoconferencing, audio calls, and desktop sharing, and has become the default system for TRC in enterprise scenarios. We present a complete study of the QoE undergone by 44 MLO users (22 pairs, interactive sessions) in controlled subjective lab tests. The study is performed on three different inter-active scenarios running on top of the real MLO Cloud service, additionally shaping the Lync flows at the ac-cess network to influence the participants’ experience. The scenarios include audio conferencing, videoconfer-encing, and remote collaboration though desktop sharing. By passively monitoring the end-to-end QoS achieved by the Lync flows, and correlating it with the QoE feedbacks provided by the participants, this study enables better understanding of the interplays between network perfor-mance and QoE in TRC Cloud services.
Index Terms: Telepresence; Audioconferencing;
Video-conferencing; Remote Desktop Sharing; Cloud QoE; MOS.
1. Introduction
Cloud-based services are becoming more and more per-vasive, both for enterprises aiming to outsource parts of their IT activities to third-party data centers or Cloud plat-forms, as well as for the end-user. An increasing number of Cloud-based services like Dropbox, YouTube, Lync Online, Google Mail, etc. are finding their way to the desktops and mobile devices of the end-users. This grow-ing presence of Cloud-based services creates new
prob-lems for both users and providers, resulting in a number of challenges that need to be addressed in order to en-sure successful adoption of this new paradigm. Besides well known and frequently raised issues of privacy and security, a major problem the Cloud Computing ecosys-tem faces is about the quality experienced by those using Cloud services. If performance levels do not reach expec-tations because quality is compromised too much, cus-tomers will reject the service or refuse its adoption. En-suring that the users’ experience remains at least as good as it was before adoption will therefore be one of the key factors in promoting new Cloud services and migrations of existing ones. The issue becomes even more challeng-ing for mobile network operators, who need to offer high quality levels to reduce the risks of clients churning for quality dissatisfaction, particularly in current highly com-petitive mobile broadband markets.
For these reasons, the concept of Quality of Experi-ence (QoE) has the potential to become one of the main guiding paradigms for managing quality in the Cloud. Being very closely linked to the subjective perception of the end-user, QoE enables a broader, more holistic under-standing of the factors that influence the performance of systems, complementing traditional technology-centric concepts such as Quality of Service (QoS).
Migrating services to the Cloud has motivated the emergence of a novel networking domain in recent years, namely theCloud QoEdomain [1]. Some concrete Cloud QoE studies have been recently conducted [2–4], includ-ing Cloud services such as Cloud Storage, Cloud Gam-ing, and Virtual Remote Desktop Access. This paper pro-vides results in the same direction, for the specific case of Telepresence and Remote Collaboration (TRC) ser-vices provided by Microsoft Lync Online (MLO). MLO is a Cloud service providing onlinetelemeeting capabil-ities including videoconferencing, audio calls, and desk-top sharing. The MLO service is hosted on multi-tenant servers distributed around the globe in Microsoft data centers, and it is becoming the de-facto choice for TRC in enterprise scenarios. The terms telepresence and meeting are not to be misinterpreted as traditional tele-conferencing in this paper. We emphasize that
telepres-ence and telemeeting span a broader view of the remote communication and collaboration among distant partici-pants, providing interactive services such as videoconfer-encing and remote collaboration which actually comple-ment or even replace face-to-face meetings. In spite of the increased use of telepresence systems, there is cur-rently no standardized method to evaluate telepresence quality, or to efficiently plan and lay out such telemeet-ings. Given the wide deployment and usage of MLO Cloud services and the trends of service migration to the Clouds, we are interested in studying and understand-ing the complex interplays between network performance (i.e., network delay, bandwidth, etc.) and QoE in MLO services.
The standard approach to analyze the QoE of a sys-tem such as MLO is to conduct subjective lab experi-ments [12–18, 20]. The key benefits of such an approach rely on the participation of real end-users and on the full control the experimenter has on the overall evaluation process, providing as such tangible and solid results. In this paper we present a complete study of the QoE un-dergone by 44 MLO users in controlled subjective lab tests, spanning three different scenarios: audio confer-encing, video conferconfer-encing, and collaboration through desktop sharing. The study consists of multiple tests per-formed by groups of two participants connected through the real MLO Cloud service, interacting with each other using standard laptops. To emulate different network conditions and different access technologies, up-link and down-link traffic is shaped for each participant, using a customized Linux-based traffic emulator.
The remainder of the paper is organized as follows: Section 2 presents a brief overview of the related work on Cloud QoE and traditional teleconferencing services. Section 3 describes the evaluation methodology and the experimental setup employed in the QoE study. Section 4 presents the main results of the study, including both the characterization of the network traffic generated by the MLO application, as well as the overall quality and the service acceptability as declared by the participants of the different tests when confronted to changing network conditions. Finally, Section 5 concludes this work.
2. Related Work
The notion of Cloud QoE has been recently introduced in [1], but no concrete QoE studies are provided in that work. Some Cloud QoE studies have been recently con-ducted in [2–4], including for example the QoE in Cloud Storage and File Synchronization services [2], the QoE in Cloud gaming [3], and the QoE in Remote Virtual Desk-top services [4].
When it comes to QoE in telepresence services through the Cloud, i.e., like those provided by MLO, there are to the date no papers on the subject, and we are the first providing results in this direction.
Network Layer Application Layer User Layer User Feedback: MOS, Acceptability Network Control: QoS, Traffic Shapping Traffic Monitoring:
Traffic Traces Access
3G/HSDPA Core Network Apps Traffic
Audio Video Remote Desktop User Experience Application Monitoring: Response Times, Artifacts
QoE
User Personality Usage Context
User Expectations Device Usability
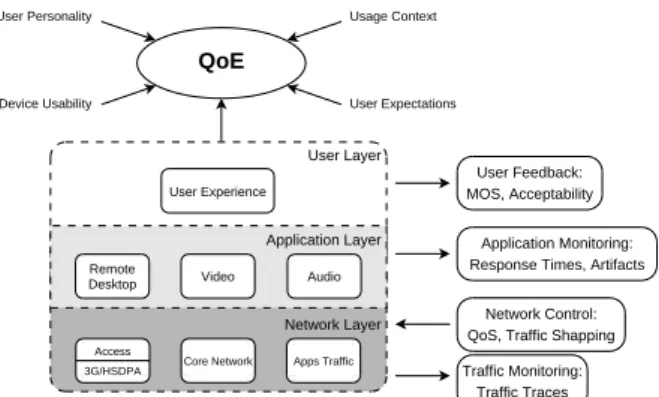
Figure 1: Layered QoE evaluation methodology for net-working applications.
If we consider the more generic field of QoE in au-dio and videoconferencing, there is of course an exten-sive list of papers [5–11] and standards [12–18] covering the subjective evaluation of audiovisual quality and con-versational quality. The ITU-T Study Group 12 [19] is devoted to the subject of Quality of Service (QoS) and QoE of Speech, Audio, Video and Multimedia, and has recently started to work on conferencing and telemeeting assessment.
3. Experimental Methodology
The MLO QoE study is realized through the layered eval-uation methodology depicted in Figure 1. In general terms, the experience of a user with any application is conditioned by multiple influence parameters, including dimensions such as technical characteristics of the ap-plication, user personality and expectations, user demo-graphics, device usability, and usage context among oth-ers. Particularly when evaluating networking-based ap-plications, the influence of the network and its interplays with the particular application have to be linked to the user’s opinions, additionally identifying those perceiv-able performance parameters that are most relevant to the user experience. This mapping is realized by ana-lyzing and correlating the three layers depicted in Fig-ure 1: thenetwork layeraccounts for the influence of the network QoS parameters (e.g., network bandwidth, RTT, etc.); theapplication layerconsiders both the technical characteristics (e.g., codecs, video resolution, etc.) and the perceivable performance parameters of the applica-tion (e.g., response times, video and audio artifacts, etc.); finally, theuser layerspans the user subjective opinions on the evaluated application (e.g., MOS values, accept-ability, etc.). The experimental evaluation conducted in this work was designed in such a way that all the three aforementioned layers could be properly measured.
The experimental subjective tests consist of 44 par-ticipants interacting through the Cloud MLO service in groups of two people, using standard laptops equipped
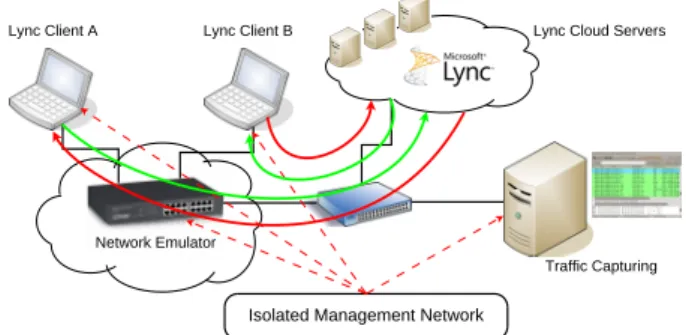
with multimedia capabilities. Figure 2 depicts a high-level diagram of the experimental testbed employed in the subjective tests for the MLO QoE analysis. The up-link and down-up-link traffic between the two Lync clients running on the end-point laptops is routed through a mod-ified version of the very well known NetEm network em-ulator [23] so as to control the different access network performance levels under evaluation. After the emulator, the two clients are connected to each other through the MLO real servers running in the Cloud. The end-point machines of the testbed are managed by a telecommander system controlled by the tests’ operator, which provides full control, automation, tracking, and most important, repeatability of the tests. Participants are instructed to evaluate three different MLO scenarios which cover the most common activities in TRC in enterprise scenarios:
audio conferencing, video conferencing, and desktop
sharing. To some extend, the reader might wonder if full
desktop sharing through MLO represents a reasonable scenario to evaluate, given that standard remote collabo-ration through MLO is performed by application sharing (e.g. PPT-slides sharing, white-board sharing, etc.) rather than full desktop sharing. We consider such a scenario as an interesting to analyze limit case for remote collabora-tion, given that the network QoS requirements are higher than in other remote collaboration scenarios.
Tests are performed in a dedicated lab for subjective studies, compliant with the recommendations provided by the QoE subjective studies standards [12–18, 20]. The audio conferencing scenario is realized through standard-ized Short Conversational Tests (SCT), which consists of short pre-defined interactive conversations aiming at sharing information and agreeing on a transaction (e.g., booking a flight, buying a product, scheduling a meeting, etc.). To increase the engagement of the participants on the evaluation tasks and to avoid user annoyance by the repeatability of the activities, both the videoconferencing and the desktop sharing scenarios are realized following agamificationapproach. Gamification means performing tests which are realized through a game, and they have proved to be very effective in our previous studies [4, 9]. Videoconferencing is evaluated through the well-known “Who Am I” game, in which participants interact with each other to guess the name of the personage laying on their headbands. Such a game forces participants to acti-avely use both the audio and video communication chan-nels, avoiding partial usage of the audiovisual capabilities of the communication [9]. In the case of desktop sharing, participants share their desktops and run remotely a puz-zle game, taking turns to fill it in, additionally relying on the audio channel to coordinate their actions.
All the traffic packets are captured and exported to standard pcap traces for off-line analysis and traffic characterization using high-performance Endance DAG cards. Regarding QoE feedbacks, participants were
in-Network Emulator
Traffic Capturing
Isolated Management Network
Lync Client A Lync Client B Lync Cloud Servers
Figure 2: Experimental testbed for subjective analysis of QoE in MLO services.
structed to rate the overall experience according to an ordinal ACR-9 Mean Opinion Score (MOS) scale [14], ranging from “bad” to “excellent”. Participants also pro-vided feedback on the acceptability of the application, stating whether they would continue using the applica-tion under the corresponding condiapplica-tions or not. The MOS ratings and quality feedbacks are issued by participants through a custom questionnaire application running on the laptops, which pops-up immediately after a condition was tested. Participants are compensated with vouchers for their participation in the tests, which proved to be sufficient for achieving correct involvement in previous studies [2, 4].
Telepresence and remote collaboration through Lync represents a complex service to evaluate from the QoE perspective, as it spans multiple QoE dimensions (inter-activity, image and audio quality, responsiveness), differ-ent QoS-based requiremdiffer-ents for each application (band-width, RTT, losses, jitter), and the usage of different transport protocols (TCP and UDP). In the case of au-dio and videoconferencing, the interactivity and real time requirements make of network delays a main influenc-ing QoS parameter. As both applications are transported on top of UDP, losses and bandwidth are additional net-work features to consider, specially for the case of video. Desktop sharing is realized on top of TCP, and the influ-ence of different QoS parameters boils down to delay and bandwidth [4].
To limit the number of network conditions to evaluate in the study, we focus the QoS part of the study on RTT and bandwidth (BW), both at the access network. RTT at the access is varied symmetrically for each participant between 30 ms and 500 ms, covering as such the different usage scenarios of MLO through multiple network access technologies (DSL, LTE, 3G/2G, etc.). These RTT val-ues particularly address broadband mobile scenarios, in which network delay is much more variable, and radio and cell-overloading issues result in very large latencies at the access network. For example, RTT in operational LTE and HSPA networks are close to 50 ms [21], whereas 500 ms are common values observed on EDGE scenarios.
Scenario T hdown max(T hdown)
Audioconferencing 58 kbps 105 kbps
Videoconferencing 200 kbps 530 kbps
Desktop Sharing + Audio 1170 kbps 1800 kbps
Table 1: Average and maximum throughput achieved by Lync flows in the down-link direction.
Access BW is considered as symmetrical for both users and for both up-link and down-link directions, and is var-ied between 256 kbps and 16 Mbps.
As the tests are performed using the real MLO Cloud service, we do not have full control of the end-to-end path between both participants, but only of the access network. This is normally not an issue, as the bottleneck is rarely located at the core of the network but at the access, and core network delays have normally low dynamics (i.e., only propagation delays). However, to reduce the im-pacts of QoS variations at the core of the network and at the Cloud itself, we rely on the packet traces and ad-ditionally monitor the end-to-end QoS of the MLO flows using the MLO QoS logs information. Combining both, we are able to re-allocate those tests in which end-to-end QoS conditions are different from each other, even if the network access conditions are exactly the same.
Finally, a brief summary on the participants’ demo-graphics: 23 participants were female and 19 male, the average age was 32 years old, with 24 participants being less than 30 years old. Around half of the participants were students and almost 43% were employees, and 70% of the participants have completed university or baccalau-reate studies.
4. Experimental Results & Discussion
In this section we present part of the results obtained in the study, including both the characterization of the network traffic generated by the MLO application in the three evaluated scenarios, as well as the overall quality and the service acceptability as declared by the partici-pants of the different tests when confronted to both RTT and BW changes at the access. An important note to un-derstand the following results is that the tested videocon-ferencing scenario corresponds to video in standard defi-nition (SD video). We have additionally performed tests for HD video, but do not include the obtained results due to space limitations.
4.1. MLO Traffic Characterization
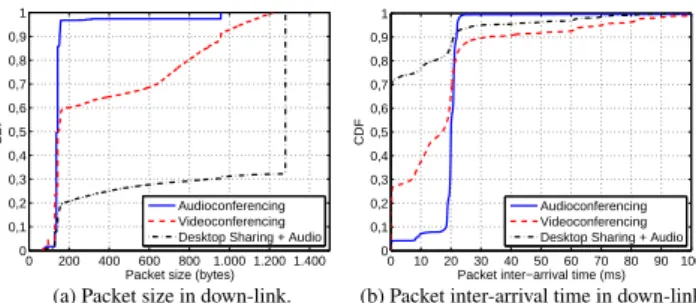
Figures 3 and 4 depict the characterization results of the traffic flows generated by MLO on the three different tested scenarios, in terms of achieved throughput, packet sizes, and packet inter-arrival times. Such a characteriza-tion is needed to better understand the QoS requirements of the different MLO applications. Table 1 reports the
av-0 200 400 600 800 1.000 1.200 1.400 0 0,1 0,2 0,3 0,4 0,5 0,6 0,7 0,8 0,9 1
Packet size (bytes)
CDF
Audioconferencing Videoconferencing Desktop Sharing + Audio
0 10 20 30 40 50 60 70 80 90 100 0 0,1 0,2 0,3 0,4 0,5 0,6 0,7 0,8 0,9 1
Packet inter−arrival time (ms)
CDF
Audioconferencing Videoconferencing Desktop Sharing + Audio
(a) Packet size in down-link. (b) Packet inter-arrival time in down-link.
Figure 3: Characterization of the traffic generated by MLO in different scenarios.
erage and maximum achieved down-link throughput val-ues for the three considered scenarios. Audio flows in MLO use the standard G.722 codec by default, resulting on an average throughput close to 60 kbps. The peaks at 100 kbps are caused by additional signaling traffic used by MLO. Videoconferencing traffic is much more bursty and achieves an average throughput of 200 kbps (in SD definition). Desktop sharing is the most demanding appli-cation in terms of bandwidth, peaking at nearly 2 Mbps for the specific tested task (drag & drop of images). Re-garding packet size and inter-arrival times, the differences among the three applications are very clear, and it be-comes easy to identify the specific type of flows being transmitted (audio, video, or desktop sharing).
4.2. QoE Analysis for MLO
In this section we present and discuss the results obtained from the subjective evaluation of the three aforemen-tioned scenarios. Figure 5 reports the impacts of RTT and BW at the access network on the QoE of both audio and videoconferencing. QoE is expressed in terms of both the overall experience of the participants and the accept-ability of the service under the evaluated QoS conditions. RTT is varied between 30 ms and 500 ms, whereas BW is varied between 256 kbps and 16 Mbps. The change in network QoS is done for one parameter a time, keeping the other one constant at an optimal-conditions value. To be more precise, access RTT is kept at 30 ms when BW is varied, whereas BW is kept at 16 Mbps when RTT is the tested parameter. Both values correspond to near optimal performance in mobile networks (e.g., LTE), considering real values observed in the practice for access RTT and up-link BW (remember that BW is considered as sym-metrical in this study).
Figure 5(a) depicts the overall MOS and the accep-tance rate for the SCT conversational tests. Before com-menting on the results, the reader should note that the maximum MOS ratings declared by the participants are never 5 but somewhere around 4.5. This is a well known phenomenon in QoE studies called rating scale satura-tion, where users hardly employ the limit values of the scale for their ratings [22]. So from now on, we shall
con-50 100 150 200 250 300 0 20 40 60 80 100 120 Time (seconds) Downlink Throughput (kbps)
(a) Audio flows (G.722).
50 100 150 0 100 200 300 400 500 600 Time (seconds) Downlink Throughput (kbps)
(b) Videoconferencing flows (video SD).
20 40 60 80 100 120 500 1000 1500 2000 Time (seconds) Downlink throughput (kbps)
(c) Desktop sharing and audio. Figure 4: Down-link throughput of MLO flows in standard utilization scenarios. Remote desktop sharing is a demanding application in terms of bandwidth. Video flows are less bandwidth eager, at least when it comes to SD resolution.
30ms,16Mbps 300ms,16Mbps 500ms,16Mbps 30ms,256kbps 1 1.4 1.8 2.2 2.6 3 3.4 3.8 4.2 4.6 5 Overall MOS
Access Network QoS (RTT, BW) Overall QoE Acceptability 0 10 20 30 40 50 60 70 80 90 100 Acceptance Rate (%)
(a) Audio QoE & Acceptability.
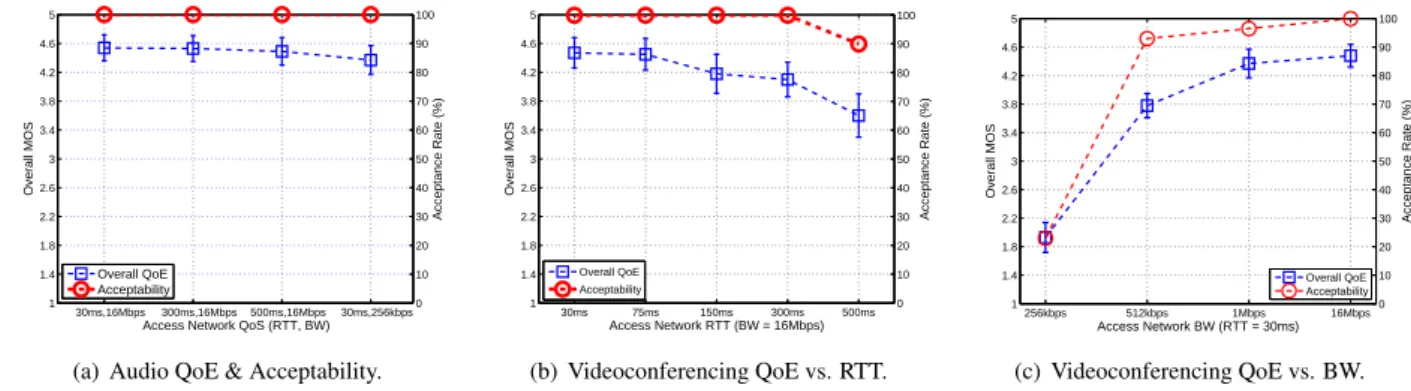
30ms 75ms 150ms 300ms 500ms 1 1.4 1.8 2.2 2.6 3 3.4 3.8 4.2 4.6 5 Overall MOS Access Network RTT (BW = 16Mbps) Overall QoE Acceptability 0 10 20 30 40 50 60 70 80 90 100 Acceptance Rate (%) (b) Videoconferencing QoE vs. RTT. 256kbps 512kbps 1Mbps 16Mbps 1 1.4 1.8 2.2 2.6 3 3.4 3.8 4.2 4.6 5 Overall MOS Access Network BW (RTT = 30ms) 0 10 20 30 40 50 60 70 80 90 100 Acceptance Rate (%) Overall QoE Acceptability (c) Videoconferencing QoE vs. BW. Figure 5: Overall QoE and acceptability for Audio and Videoconferencing (SD video resolution), for different RTT and BW conditions in the access network.
sider as optimal quality a MOS score close to 4.5. The first three conditions correspond to access RTT values from 30 ms to 500 ms, keeping access BW at 16 Mbps. As expected, the overall QoE and the acceptance rate are optimal and remain almost unchanged for the three condi-tions, with a MOS value between 4.5 and 4.6 and 100% of acceptance rate. In fact, it is well known that end-to-end RTT values of up to 1000 ms have almost no impacts on the experience of the interlocutors in conversational QoE tests [7]. These results are therefore provided just for the sake of completeness of the MLO services’ analysis. The fourth tested condition corresponds to an access BW of 256 kbps and optimal access RTT of 30 ms, and shows that even a very low BW provisioning is good enough for optimal QoE in audioconferencing through MLO. This is also coherent with the BW profile of audio flows as de-picted in Figure 4(a).
Figures 5(b) and 5(c) report the results for SD video-conferencing, for access RTT and BW variations respec-tively. The overall QoE is near optimal for an access RTT of up to 300ms, with an acceptance rate of 100%. Access RTT of up to 100 ms is almost imperceptible in terms of QoE, and QoE and acceptability start to drop from RTT
>300 ms. Regarding access BW, Figure 5(c) shows that BW should be high enough to avoid traffic shaping so as
to limit QoE degradation, as QoE markedly improves for BW>512 kbps (recall the BW profile of SD Videocon-ferencing depicted in Table 1). An access BW of 1 Mbps provides almost optimal results, with an overall MOS of 4.4 and an acceptance rate of 97%, and very limited gains are obtained for BW>1Mbps, already getting into QoE saturation.
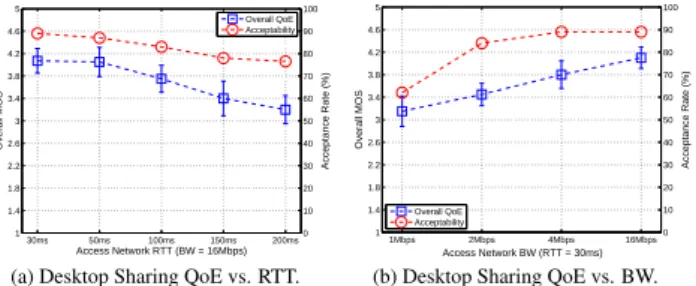
The last part of the results corresponds to the QoE for the desktop sharing scenario. Different from the other two scenarios, the experience of each participant in the desktop sharing evaluation is not symmetrical, basically because the participant sharing his desktop will work on it locally, whereas the participant who is remotely access-ing it will experience the effect of the network and the Cloud. Figure 6 reports the average results for both lo-cal and remote participants together. The first interest-ing observation from Figure 6(a) is that even under opti-mal access conditions (i.e., access RTT = 30 ms and BW = 16 Mbps), the QoE in not optimal but good, provid-ing an overall QoE MOS score around 4.1 and an accep-tance rate slightly below 90%. This is coherent with the fact that remote desktop services are highly sensitive to delays as shown in [4], and normally only LAN scenar-ios provide optimal quality for such services. QoE starts dropping for access RTT>50 ms, and quality drops to
30ms 50ms 100ms 150ms 200ms 1 1.4 1.8 2.2 2.6 3 3.4 3.8 4.2 4.6 5 Overall MOS Access Network RTT (BW = 16Mbps) Overall QoE Acceptability 0 10 20 30 40 50 60 70 80 90 100 Acceptance Rate (%) 1Mbps 2Mbps 4Mbps 16Mbps 1 1.4 1.8 2.2 2.6 3 3.4 3.8 4.2 4.6 5 Overall MOS Overall QoE Acceptability 0 10 20 30 40 50 60 70 80 90 100 Access Network BW (RTT = 30ms) Acceptance Rate (%)
(a) Desktop Sharing QoE vs. RTT. (b) Desktop Sharing QoE vs. BW.
Figure 6: Overall QoE and acceptability for Desktop Sharing, for changing RTT and BW conditions at the ac-cess network.
fair (i.e., MOS ≈3.5) for RTT = 150 ms. Figure 6(b) shows that bandwidth has a noticeable effect on MLO desktop sharing QoE, and near good QoE (i.e., MOS≈ 4) is reached for bandwidth values higher than 2 Mbps, with an acceptance rate close to 85%. There is a clear saturation effect in terms of acceptability from BW>4 Mbps, but the overall QoE still slightly improves with higher bandwidths. To sum up, RTT should be kept very low with an access bandwidth sufficiently high to avoid traffic shaping so as to attain good QoE in desktop shar-ing through MLO.
5. Concluding Remarks
Migrating services to the Cloud is pushing forward the need for a better understanding of the effects of the net-work QoS on the experience of the end customers. The Cloud QoE domain is becoming a very active research domain, and more and more studies are being conducted for understanding the interplay between QoS and QoE in cloud services. In this paper we presented the study on the QoE of Telepresence and Remote Collaboration (TRC) services, using Microsoft Lync Online (MLO) as specific Cloud application. By conducting subjective tests on the experience undergone by 44 MLO partici-pants in controlled scenarios, we showed interesting re-sults on the impacts of RTT and bandwidth at the access network on the overall QoE, specially targeting the usage of MLO in mobile networks. We expect that such results will not only shed light on the challenging problem of QoE provisioning for general Cloud-based applications, but also provide guidelines for the future deployment of better TRC services.
6. Acknowledgements
This work has been performed in the framework of the projects ACE 3.0 and U-0 at the Telecommunications Re-search Center Vienna (FTW), and has been funded by the Austrian Government and the City of Vienna through the program COMET.
7. References
[1] T. Hossfeld, R. Schatz, M. Varela, C. Timmerer, “Challenges of QoE Management for Cloud Applications”, inIEEE Communica-tions Magazine, vol. 50(4), pp. 28-36, 2012.
[2] P. Casas, H. Fischer, S. Suette, R. Schatz, “A First Look at Qual-ity of Experience in Personal Cloud Storage Services”, inProc. IEEE-ICC MCN Workshop, 2013.
[3] M. Jarschel, D. Schlosser, S. Scheuring, T. Hobfeld, “An Eval-uation of QoE in Cloud Gaming Based on Subjective Tests”, in
Proc. FINGNet, 2011.
[4] P. Casas, M. Seufert, S. Egger, R. Schatz “Quality of Experi-ence in Remote Virtual Desktop Services”, inIFIP/IEEE QCMan, 2013.
[5] N. Kitawaki and K. Itoh, “Pure Delay Effects on Speech Quality in Telecommunications”, inIEEE JSAC, vol. 9(4), pp. 586-593, 1991.
[6] S. Egger, R. Schatz, K. Schoenenberg, A. Raake, G. Kubin, “Same but Different? - Using Speech Signal Features for Comparing Conversational VoIP Quality Studies”, inIEEE ICC, 2012. [7] S. Egger, R. Schatz, S. Scherer, “It Takes Two to Tango -
As-sessing the Impact of Delay on Conversational Interactivity on Perceived Speech Quality”. inInterspeech, 2010.
[8] S. M¨oller, C. Bang, T. Tamme, M. Vaalgamaa, B. Weiss, “From Single Call to Multi-Call Quality: A Study on Long-term Qual-ity Integration in Audio-Visual Speech Communication”, in Inter-speech, 2011.
[9] S. Egger, M. Ries, P. Reichl, “Quality-of-Experience beyond MOS: Experiences with a Holistic User Test Methodology for In-teractive Video Services”, in21st ITC Specialist Seminar on Mul-timedia Applications - Traffic, Performance and QoE, 2010. [10] P. Calyam, M. Haffner, E. Ekici, C. Lee, “Measuring Interaction
QoE in Internet Videoconferencing”, inIFIP/IEEE MMNS, 2007. [11] G. Berndtsson, M. Folkesson, V. Kulyk, “Subjective Quality As-sessment of Video Conferences and Telemeetings”, in Interna-tional Packet Video Workshop, 2012.
[12] International Telecommunication Union, “Methodology for the Subjective Assessment of the Quality of Television Pictures”,
ITU-R Rec. B.500-12, 2009.
[13] International Telecommunication Union, “Subjective Assessment Methods for Image Quality in High-Definition Television”,ITU-R Rec. B.710-4, 1998.
[14] International Telecommunication Union, “Methods for Subjective Determination of Transmission Quality”,ITU-T Rec. P.800, 1996. [15] International Telecommunication Union, “Subjective Evaluation
of Conversational Quality”,ITU-T Rec. P.805, 2007.
[16] International Telecommunication Union, “Subjective Video Qual-ity Assessment Methods for Multimedia Applications”, ITU-T Rec. P.910, 2008.
[17] International Telecommunication Union, “Subjective Audiovisual Quality Assessment Methods for Multimedia Applications”, ITU-T Rec. P.911, 1998.
[18] International Telecommunication Union, “Interactive Test Meth-ods for Audiovisual Communications”,ITU-T Rec. P.920, 2000. [19] International Telecommunication Union, “ITU-T SG12:
Per-formance, QoS and QoE”,http://www.itu.int/ITU-T/ studygroups/com12.
[20] International Telecommunication Union, “Estimating End-to-End Performance in IP Networks for Data Applications”,ITU-T Rec. G.1030, 2005.
[21] M. Laner, P. Svoboda, P. Romirer, N. Nikaein, F. Ricciato, “A Comparison Between One-Way Delays in Operating HSPA and LTE Networks”, inProc. WINMEE, 2012.
[22] S. M¨oller, “Assessment and Prediction of Speech Quality in Telecommunications”,Springer - 1st edition, 2000.
[23] S. Hemminger, “Network Emulation with NetEm”, inProc. LCA, 2005.