* Department of Communication Science and Disorders, University of Pittsburgh, Pittsburgh, PA; † Department of Psychology, University of Nebraska at Omaha, Omaha, NE
Melissa N. Ruscetta, 4033 Forbes Tower, University of Pittsburgh, Pittsburgh, PA 15260; Phone: 692-8032; Fax: 412-692-6074; E-mail: [email protected]
Presented at the American Academy of Audiology 15th Annual Convention and Exposition, San Antonio, TX, Apr. 2–5, 2003.
This study was supported in part through funding received from the School of Health and Rehabilitation Sciences (SHRS) Research Development Fund, SHRS, University of Pittsburgh, and through funding received from the Pennsylvania Lion’s Hearing Research Foundation.
Validity, Internal Consistency, and Test/Retest
Reliability of a Localization Disabilities and
Handicaps Questionnaire
Melissa N. Ruscetta* Catherine V. Palmer* John D. Durrant* Judith Grayhack* Carey Ryan† AbstractPsychometric evaluations were performed on a self-perceived localization disabilities and handicaps questionnaire. Twenty individuals with normal hearing bilaterally, twenty with profound unilateral hearing impairment (UHI), and ten with any degree of bilateral hearing impairment participated. Each subject completed the questionnaire. Comparisons of the responses of the subjects with normal hearing and those with UHI revealed significant differences among the groups for both disabilities and handicaps, establishing construct validity. Cronbach’s Alpha correlational analyses of the responses of all subjects with hearing impairment revealed correlations of .900 (disabilities) and .800 (handicaps), establishing internal consistency. Each participant with hearing impairment was asked to complete the questionnaire again after three weeks. Pearson’s correlational analyses of the responses at time one versus time two revealed correlations of .900 (disabilities) and .700 (handicaps), establishing test/retest reliability. This questionnaire is an appropriate tool for investigating the self-perceived localization disabilities and handicaps of individuals with hearing impairment.
Key Words:Internal consistency reliability, localization disabilities, localization handicaps, questionnaire, self-perceived, test/retest reliability, validity Abbreviations: SSQ = Speech, Spatial and Qualities of Hearing Scale; UHI = unilateral hearing impairment; WHO = World Health Organization
Sumario
Se realizaron evaluaciones psicométricas con un cuestionario de discapacidades e impedimentos auto-percibidos para la localización. Participaron veinte individuos con audición normal bilateral, veinte con hipoacusia profunda unilateral (UHI) y diez con cualquier grado de hipoacusia bilateral. Cada sujeto llenó y completó el cuestionario. Las comparaciones de las respuestas de los sujetos con audición normal y aquellos con UHI revelaron diferencias significativas entre los grupos, tanto para discapacidades como para impedimentos, estableciendo una validez constructiva. Los análisis de Correlación Alfa de Cronbach de las respuestas de todos los sujetos con hipoacusia revelaron correlaciones de .900 (discapacidad) y de .800 (impedimento), mostrando consistencia interna. A cada participante con
B
ecause ameliorating the problem of hearing in noise is of primary importance to individuals with hearing impairment, it has been the objective of technological advances in amplification for several decades. Efforts have been made to develop circuitry that theoretically helps to reduce the effects of background noise with hearing aids. While theoretically sound, the promise of many of these circuits has not been realized in practice. However, research in the area of directional microphone technology has consistently produced reports of improved understanding of speech in noise (Nielsen, 1973; Sung et al, 1975; Mueller and Johnson, 1979; Hillman, 1981; Mueller, 1981; Hawkins and Yacullo, 1984; Mueller et al, 1993; Preves et al, 1999; Wouters et al, 1999; Jerger, 2000; Yueh et al, 2001; Cord et al, 2002; Ricketts et al, 2003).While communicating effectively in noise seems to be of highest priority for individuals with hearing impairment, a second utility of hearing is allowing the listener to sense their environment for safety and security. Evidence indicates that localizing sound sources is important to individuals with hearing impairment (Eriksson-Mangold et al, 1992). Noble et al (1995) showed that localization has significance in people’s reports of everyday hearing difficulty and that self-assessed disability associated with a decreased ability to localize was significantly associated with feelings of confusion and loss of concentration. A positive relationship has been suggested between speech hearing in competing noise and localization abilities (Hirsch, 1950; Carhart, 1965; Dirks and Wilson, 1969; MacKeith and Coles, 1971; Noble et al, 1997; Bronkhorst and Plomp, 1989; Freyman et al, 1998). Localization
considerations are not only important as they pertain to gaining an understanding of hearing impairment in general but also for understanding how the listening environment created through various types of amplification technology effects individuals with hearing impairment.
Hearing aids can disturb sound localization ability (Noble and Byrne, 1990; Byrne et al, 1992; Noble et al, 1998). The impact of listening in a directionally enhanced environment on the individual’s ability to localize is unclear. The very properties of directional microphone technology that promote enhanced performance in noise may create problems in localization. Briefly, individuals use timing and intensity differences in sounds arriving at their two ears to localize the source of the sound. Directional microphones use timing differences to determine which sounds come from in front of a listener versus which sounds come from other angles of incidence. More amplification is applied to sounds deemed to come from in front of the listener than to sounds that come from other angles of incidence. Therefore, the listener may be left unable to detect signals originating from much of the acoustic environment and unable to use naturally occurring intensity cues to help localize. It is not unreasonable to suggest that if localization is compromised when wearing directional microphone technology, then disability will be experienced in situations where localization is required. Individuals may withdraw from these situations because they do not feel safe, or they may require assistance and/or companionship and therefore experience a loss of independence. The impact that listening with directional microphones might hipoacusia se le pidió que completara de nuevo el cuestionario tres semanas
después. Los análisis de correlación de Pearson sobre las respuestas en el primer momento versus en el segundo momento, revelaron correlaciones de .900 (discapacidad) y de .700 (impedimento), demostrando confiabilidad test/retest. Este cuestionario es una herramienta apropiada para investigar la auto-percepción de discapacidad o impedimento para la localización en individuos con trastornos auditivos.
Palabras Clave: Consistencia interna, confiabilidad, discapacidad para la localización, impedimento para la localización, cuestionario, auto-percepción, confiabilidad test/retest, validez
Abreviaturas: SSQ = Escala Espacial, de Lenguaje y de Calidades de la Audición; UHI = Trastorno Auditivo Unilateral; WHO = Organización Mundial de la Salud
have on self-perceived localization and activities of daily living has yet to be determined.
Through responses to an untitled questionnaire, Noble et al (1995) examined self-assessed everyday disability resulting from or associated with impaired localization capacity and concomitant handicaps. The questionnaire consists of questions divided into sections (Noble et al, 1995). Section I explores self-perceived disabilities (as defined by the World Health Organization [WHO], 1980) associated with decreased localization abilities. Section II allows quantification of self-perceived handicap (as defined by the WHO, 1980) directly attributable to localization disability. By observing the responses of individuals with hearing impairment both with conventional omnidirectional amplification and without, a high positive correlation between localization disability and handicap due to localization was found. This indicates that those who perceive themselves to be disabled in terms of localization also experience handicaps that impact their quality of life because of this specific disability. This questionnaire appears to be an appropriate tool to investigate self-perceived disabilities and handicaps associated with impaired localization among individuals with hearing impairment and is the focus of the present investigation, the purpose of which is to establish the construct validity, internal consistency reliability, and test/retest reliability of Sections I and II. This could be an important clinical tool as various types of technology that alter one’s listening environment and ultimately one’s ability to localize become more popular. A clinician would want to balance hearing benefits with localization disturbances if those disturbances are being perceived as handicapping. Additionally, this tool could serve as a subjective outcome measure for research into the effects of wearing various types of amplification on the self-perception of one’s ability to localize and the subsequent impact that any identified disabilities may have on one’s life.
Another self-perception tool, developed by Noble and colleagues (Gatehouse and Noble, 2004), known as the Speech, Spatial and Qualities of Hearing Scale (SSQ), is designed to measure a range of hearing disabilities across several domains (hearing speech, spatial hearing, and quality of hearing). The
spatial hearing section is quite similar to the questionnaire evaluated in the present investigation. A separate set of 12 questions designed to determine level of handicap has been used in comparison with the SSQ. However, these questions are not specific to handicap that is associated specifically with localization disability. Two similar sets of questions (Ricketts et al, 2003), designed to be new subscales of the Profile for Hearing Aid Benefit (PHAB) (Cox et al, 1991), were developed to specifically address the situations in which directional hearing aids may provide different degrees of benefit than omnidirectional hearing aids. However, these questions do not attempt to uncover potential localization disabilities or handicaps; therefore, the present questionnaire is more appropriate for doing so and was chosen for this investigation.
A measure is not useful in research or for documenting a clinical intervention unless reliability and validity are established. In a 2001 paper, Flamme discusses the importance of knowing and understanding the psychometrics of the outcome measures one plans to use in clinic or in research. The goals of Flamme’s study were to examine the relationship among three hearing traits (direction and distance hearing, soft sounds hearing, and understanding in noise hearing) while also estimating the amounts of trait-related, method-trait-related, and other influences on tests designed to return estimates of these traits. In so doing, Flamme showed that the internal consistency reliability of Section I of the questionnaire developed by Noble and colleagues (1995) is .93 as determined by applying Cronbach’s Alpha. There are no published psychometric data for Section II of the questionnaire.
The validity of this scale has not been addressed. Assessing validity often is a difficult task. Construct validity is used to draw an inference from test scores to a psychological construct. The intended independent variable is the construct (in this case localization abilities), while the proxy independent variable is the indicator of the construct (in this case responses to the questionnaire). One uses the responses of the questionnaire to infer the level of localization ability or disability. Claiming construct validity implies that there is a gold standard or a very clear expectation of the results with a given population. To carry out
a validity study, one must compare the results of a measure to the results of a gold standard measure or have a definite preknowledge of what the results should be on a given measure. By definition, a group of individuals with unilateral hearing impairment should have localization difficulty because of a complete inability to take advantage of the interaural timing differences (ITD) and interaural intensity differences (IID) that provide cues for localization to those with normal bilateral hearing. Therefore individuals with unilateral hearing impairment can be expected to be identified as having problems by a measure of localization abilities. In addition, individuals with normal hearing in both ears should be identified as not having localization impairment by a scale designed to identify this problem. If one can show that responses on the scale have a strong correlation with the actual ability to localize, then construct validity will have been established. In this case, a valid scale of localization impairment should clearly differentiate between these two populations.
Internal consistency reliability is estimated by computing the correlation between items on a scale. The stronger the interrelationship between the items, the more likely the test is consistent. Item covariance is a measure of the distribution of any two items on a given scale. Cronbach’s Alpha examines the covariance of all possible pairs (e.g., item one versus item two, item one versus item three, item two versus item three, etc.) on a given scale.
Test/retest reliability allows one to show
temporal stability of a scale. This means that the test is just as likely to produce valid and consistent results at one administration as it is to do so at a subsequent administration. This type of reliability is important if one means to use a measure on multiple occasions to, for example, show the efficacy of treatment.
As stated, the purpose of this investigation was to establish the construct validity, internal consistency reliability, and test/retest reliability of Sections I and II of the questionnaire. The evaluation of the internal consistency reliability of Section I serves as a replication.
METHODS
Test Materials
The questionnaire uses a four-option forced-choice response method. The options for each item include “almost always,” “often,” “sometimes,” and “almost never.” Each response is assigned a number from one to four. A response is obtained for each item, and a four always represents the least amount of difficulty. See Appendix A for a copy of the questionnaire.
Subjects
Validity
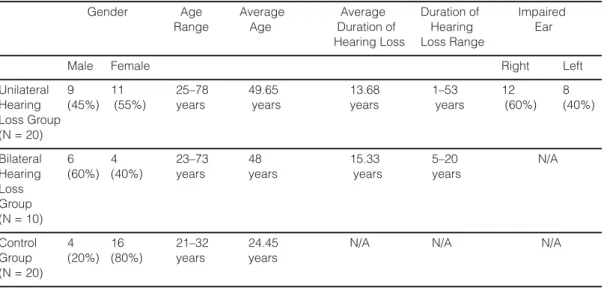
A power analysis was used to determine the appropriate number of participants per Table 1. Subject Characteristics
Gender Age Average Average Duration of Impaired
Range Age Duration of Hearing Ear
Hearing Loss Loss Range
Male Female Right Left
Unilateral 9 11 25–78 49.65 13.68 1–53 12 8
Hearing (45%) (55%) years years years years (60%) (40%)
Loss Group (N = 20)
Bilateral 6 4 23–73 48 15.33 5–20 N/A
Hearing (60%) (40%) years years years years
Loss Group (N = 10)
Control 4 16 21–32 24.45 N/A N/A N/A
Group (20%) (80%) years years (N = 20)
group (N = 20) for the validity portion of the study. A moderate effect size, a desired power of .80, and an alpha of .05 were assumed (Glass and Hopkins, 1996). Therefore, 40 total individuals (20 per group) age 18 or older participated in the validity portion of the study (see Table 1 for details).
Twenty participants (9 males, 11 females; age range: 25–78 years; mean age: 49.65
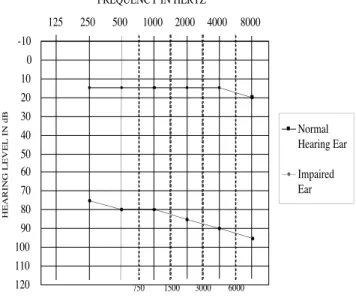
years) presented with severe/profound sensorineural or mixed unilateral hearing impairment (defined here as pure-tone average [500, 1000, and 2000 Hz] air-conduction thresholds ≥70 dB HL in one ear). The average, impaired ear PTA for these participants was 80.91 dB HL. The range of PTAs was from 70 dB HL to beyond the stimulus limits of the audiometer (patients did not respond to the loudest stimuli presented). Twelve (60%) of the individuals in this group were impaired in their right ear and eight (40%) in their left. These participants also presented with normal hearing (defined here as thresholds less than or equal to 20 dB HL at all frequencies tested [250–8000 Hz]) in the opposite ear. See Figure 1 for an average audiogram.
Among the etiology of hearing loss for this group was acoustic neuroma (n = 2), childhood illness/high fever (n = 3), Meniere’s disease (n = 2), and head trauma (n = 1). Etiology was unknown for 12 subjects, 7 of whom experienced sudden hearing loss where radiographic imaging studies were negative. The average duration of hearing loss for this group was 13.68 years (duration range = 1 to 53 years).
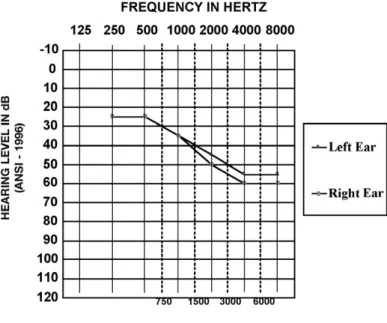
Twenty additional participants (4 males [20%], 16 females [80%]; age range: 21–32 years; mean age: 24.45 years) presented with normal hearing in both ears (defined here as thresholds less than or equal to 20 dB HL at all frequencies tested [250–8000 Hz]). See Figure 2 for an average audiogram.
Internal Consistency Reliability Because this measure is likely to be used with individuals with hearing impairment, it was felt that those participating in the evaluation of internal consistency reliability should have hearing impairment. The 20 participants described above with unilateral hearing impairment and ten additional participants (6 males [60%], 4 females [40%]; age range: 23–73 years; mean age: 48 years) with bilateral sensorineural hearing impairment (defined here as at least one air-conduction threshold in each ear greater than 20 dB HL at any frequency tested [250–8000 Hz]) participated in the internal consistency reliability portion of the experiment (total N = 30). A sample size of 30 participants is acceptable for a correlational study with a -10 0 10 20 30 40 50 60 70 80 90 100 110 120 125 250 500 1000 2000 4000 8000 FREQUENCY IN HERTZ HEARING LEVEL IN dB Normal Hearing Ear Impaired Ear 750 1500 3000 6000
Figure 1.Average audiogram for participants with unilateral hearing impairment.
-10 0 10 20 30 40 50 60 70 80 90 100 110 120 125 250 500 1000 2000 4000 8000 FREQUENCY IN HERTZ HEARING LEVEL IN dB (ANSI - 1996) Left Ear Right Ear 750 1500 3000 6000
Figure 2.Average audiogram for participants with normal hearing.
moderate effect size (Gay, 1992).
The average PTA for the ten additional participants with bilateral hearing impairment who were needed to complete the internal consistency and test/retest reliability portions of the study was 35.83 dB HL. The range of PTAs was from 5.83 dB HL to 75.83 dB HL. See Figure 3 for an average audiogram. All of these individuals reported gradual hearing loss over time. The average duration of hearing loss for this group was 15.33 years (duration range = 5–20 years).
Test/Retest Reliability
The thirty participants with hearing impairment participated in the test/retest reliability portion of the study. A sample size of 30 participants is acceptable for a correlational study with a moderate effect size (Gay, 1992).
PROCEDURES
S
tandard audiometric procedures were used to obtain hearing thresholds and confirm eligibility through air conduction between 250–8000 Hz and bone conduction between 500–4000 Hz (ANSI S3.6 – 1989). Once an individual met the eligibility requirements as described for each group above, they were asked to complete Sections I and II of the questionnaire. The 30 participants with hearing impairment were asked to complete Sections I and II of the questionnaire a second time, three weeks after their first completion. This was considered adequate time between administrations so that individuals would not be able to remember the answers they gave for specific items.RESULTS
Validity
Two-tailed t-tests using mean total scores for each section of the questionnaire were used to determine the validity of Sections I and II. Questions 1–14 make up Section I (disabilities) of the questionnaire. Because participants chose an answer from a scale of 1–4 for each question, total disability section
scores could range from 14–56. The mean total disability section score was 27.6 for the group with unilateral impairment and 49.5 for the group with normal hearing. A two-tailed t-test revealed significant differences between groups at the .05 level (p ≤.001).
Questions 15–25 make up Section II (handicaps) of the questionnaire. However, questions 22 and 25 were eliminated from analyses because they require the participant to have experience with hearing aids in order to be completed. None of the participants in this experiment had hearing aid experience. Therefore, there were nine questions in this section. Because participants chose an answer from a scale of 1–4 for each question, total handicap section scores could range from 9–36. The mean total handicap section response was 28.5 for the group with unilateral impairment and 32.4 for the group with normal hearing. A two-tailed t-test revealed significant differences between groups at the .05 level (p = .008). See Figure 4 for a graphic representation of these comparisons.
Internal Consistency Reliability The items in each section, responded to by 30 participants with hearing impairment, were compared to determine if each section addresses a specific premise and if the
Figure 3.Average audiogram for participants with bilateral hearing impairment.
questions within each section are similar in type as they relate to that topic. A priori, a correlation of ≥.80 was determined to be necessary to establish internal consistency reliability (Nitko, 2001). Cronbach’s Alpha correlational analyses revealed internal consistency reliability of .900 for the disability section and .800 for the handicap section. Test/Retest Reliability
The total scores in each section for 30 participants with hearing impairment, over two occasions, were compared to determine the consistency of responses from one trial to the next. A priori, a correlation of ≥.70 was determined to be necessary to establish test/retest reliability (Nitko, 2001). Pearson’s correlational analyses revealed test-retest reliability for Section I (Disabilities) at .900 and for Section II (Handicaps) at .700. Both correlations are significant at the .05 level (p ≤.001).
DISCUSSION
Validity
Though it is a challenge to establish the validity of a subjective measure, in the current study, a group likely to suffer from a specific disability based on their type and degree of impairment could be identified, and their responses could be compared with those of a group who is unlikely to suffer from those same disabilities. The results of this analysis support that this measure allows for a valid assessment of a participant’s self-perceived localization disabilities. Also, though those same participants were not necessarily expected to suffer from handicaps related to those disabilities, this measure does appear to allow an accurate assessment of such handicaps if they do exist.
Thereby, the construct validity of this scale has been established. The constructs, in this case, are self-perceived localization disabilities and concomitant handicaps. By establishing groups that should produce gold standard results in opposite directions (participants with UHI should score low, while participants with normal hearing should score high), comparing the groups’ scores, and finding a significant difference, we have shown that the questions on this scale
represent these constructs well. One is limited to the use of a proxy independent variable when the construct of interest is a subjective one (i.e., disabilities); however, in this instance one is fortunate to be able to identify a group that is known to experience difficulty with localization and therefore can assume that the group’s responses represent the gold standard for the extreme of the construct.
Internal Consistency Reliability Cronbach’s Alpha examines the covariance of all possible pairs on a given scale and computes the correlation between them. A strong interrelationship was found between the items on the disabilities section (.900) and between the items on the handicaps section (.800). For Section I, these results compare well with those previously reported (.93) (Flamme, 2001). Based on these measures, it can be said with confidence that each section of this measure examines a specific construct and that the questions within each section are similar in type as they relate to that construct.
Test-Retest Reliability
Unfortunately, one can not control for
Figure 4. Graphic representation of the results of the validity analyses. Error bars represent standard error of the mean. *p < .05.
the experiences, mood, and so forth of individual participants on any given occasion, or for how much memory a subject may have of their responses at the first completion when they complete the measure at the second visit. It was believed that the period of three weeks was enough time that it was unlikely that the subjects could remember their responses to individual items on the measure. In this study, participant responses from the first administration versus the second administration correlated positively and neither correlation appeared to be due to chance. Therefore, the temporal stability of this scale has been established. This is a good tool to use if one means to apply it on multiple occasions, for example, to evaluate the impact of wearing various types of hearing aid technology on self-perceived localization disabilities and handicaps.
General Discussion
Because directional microphones appear to be the most promising technology available to ameliorate the problem of understanding speech-in-noise, they are being widely prescribed to individuals with hearing impairment. The impact of listening with this type of amplification on one’s self-perception of his or her ability to localize is as yet unknown. Also unknown is the concurrent impact of any such localization problems on one’s activities of daily living.
Research is ongoing, using the questionnaire examined herein, to define this impact. The results of the present investigation allow one to use this measure with confidence for the above stated purpose as well as for examining the localization disabilities and concomitant handicaps of individuals with hearing impairment for other purposes. One example might be the assessment of outcomes in the case of bilateral versus unilateral remediation, a concept that was introduced by Noble and Gatehouse (2004) in their analysis of the SSQ.
CONCLUSION
T
he results of this investigation lend further support to confident use of the Noble et al (1995) questionnaire to obtain a valid and consistent assessment of a participant’s self-perceived localization disabilities and handicaps related to thosedisabilities. We also can conclude that the questionnaire is a reliable measure and is just as likely to produce valid and consistent results at one administration as it is to do so at a subsequent administration.
REFERENCES
American National Standards Institute. (1989)
Acoustics - Audiometric Test Methods - Part 1: Basic Pure Tone Air and Bone Conduction Threshold Audiometry (ANSI S3.6 – 1989). New York: American National Standards Institute.
Bronkhorst AW, Plomp R. (1989) Binaural speech intelligibility in noise for hearing-impaired listeners.
J Acoust Soc Am86:1374–1383.
Byrne D, Noble W, Lepage B. (1992) Effects of long-term bilateral and unilateral fitting of different hearing aid types on the ability to locate sounds. J Am Acad Audiol3:369–382.
Carhart R. (1965) Monaural and binaural discrimi-nation against competing sentences. Int Audiol 4:5–10. Cord MT, Surr RK, Walden BE, Olson L. (2002) Performance of directional microphone hearing aids in everyday life. J Am Acad Audiol 13:295–307. Cox RM, Gilmore CG, Alexander GC. (1991) Comparison of two questionnaires for patient-assessed hearing aid benefit. J Am Acad Audiol2:134–145. Dirks DD, Wilson RH. (1969) The effect of spatially separated sound sources on speech intelligibility. J Speech Hear Res12:5–38.
Eriksson-Mangold M, Hallberg LRM, Ringdahl A, Erlandsson SI. (1992) The development of a short-ened Hearing Measurement Scale: the HMS-25. J Aud Med 1:161–175.
Flamme G. (2001) Examination of the validity of audi-tory traits and tests. Trends Amplif 5:111–138. Freyman RL, McCall DD, Clifton RK. (1998) Intensity discrimination for precedence effect stimuli. J Acoust Soc Am103:2031–2041.
Gatehouse S, Noble W. (2004) The Speech, Spatial and Qualities of Hearing Scale (SSQ).Int J Audiol
43:85–99.
Gay LR. (1992) Educational Research: Competencies for Analysis and Application.New York: Macmillan Publishing Company.
Glass GV, Hopkins KD. (1996) Statistical Methods in Education and Psychology.Needham Heights, MA: Allyn and Bacon.
Hawkins DB, Yacullo WS. (1984) Signal-to-noise ratio advantage of binaural hearing aids and directional microphones under different levels of reverberation.
J Speech Lang Hear Disord49:278–286.
Hillman N. (1981) Directional hearing aid capabili-ties. Hear Instrum32:7–11.
Hirsch IJ. (1950) The relation between localization and intelligibility. J Acoust Soc Am22:196–200.
Jerger J. (2000) Directional microphones—they work.
J Am Acad Audiol11:3.
MacKeith NW, Coles RR. (1971) Binaural advantages in hearing of speech. J Laryngol Otol 85:213–232. Mueller HG. (1981) Directional microphone hearing aids: a 10-year report.Hear Instrum 32:18–20, 66. Mueller HG, Grimes AM, Erdman SA. (1993) Subjective ratings of directional amplification. Hear Instrum34:14–16, 47–48.
Mueller HG, Johnson RM. (1979) The effects of var-ious front-to-back ratios on the performance of directional microphone hearing aids. J Am Aud Soc
5:30–34.
Nielsen HB. (1973) A comparison between hearing aids with a directional microphone and hearing aids with conventional microphone. Scand Audiol2:45–48. Nitko AJ. (2001) Educational Assessment of Students.
3rd ed. Upper Saddle River, NJ: Merril.
Noble W, Byrne D. (1990) A comparison of different binaural hearing aid systems for sound localization in the horizontal and vertical planes. Br J Audiol
24:335–346.
Noble W, Byrne D, Ter-Horst K. (1997) Auditory local-ization, detection of spatial separateness, and speech hearing in noise by hearing impaired listeners. J Acoust Soc Am102:2343–2352.
Noble W, Gatehouse S. (2004) Interaural asymmetry of hearing loss, Speech, Spatial and Qualities of Hearing Scale (SSQ) disabilities, and handicap. Int J Audiol43:100–114.
Noble W, Sinclair S, Byrne D. (1998) Improvement in aided sound localization with open earmolds: obser-vations in people with high-frequency hearing loss.
J Am Acad Audiol 9:25–34.
Noble W, Ter-Horst K, Byrne D. (1995) Disabilities and handicaps associated with impaired auditory localization. J Am Acad Audiol6:129–140.
Preves DA, Sammeth CA, Wynne MK. (1999) Field trial evaluations of switched directional/omni-direc-tional in-the-ear hearing instruments. J Am Acad Audiol10:273–284.
Ricketts T, Henry P, Gnewikow D. (2003) Full time directional versus user selectable microphone modes in hearing aids. Ear Hear24:424–439.
Sung GS, Sung RJ, Angelelli RM. (1975) Directional microphones in hearing aids: effects on speech dis-crimination in noise. Arch Otolaryngol 101:316–319. World Health Organization. (1980) International Classification of Impairments, Disabilities, and Handicaps.Geneva: World Health Organization. Wouters J, Litiere L, van Wieringen A. (1999) Speech intelligibility in noisy environments with one and two microphone hearing aids. Audiology38:91–98. Yueh B, Souza PE, McDowell JA, Collins MP, Loovis CF, Hedrick SC, Ramsey SD, Deyo RA. (2001) Randomized trial of amplification strategies. Arch Otolaryngol Head Neck Surg127:1197–1204.
APPENDIX A
Questionnaire for Disabilities and Handicaps Associated with Impaired Auditory Localization Noble et al, 1995
Section I – Localization
1. You are at home in a quiet room. There are other people in the house (friends or family). They are talking in another room and you can hear them. Can you tell which part of the house those people are in?
1) Almost never, 2) Sometimes, 3) Often, 4) Almost Always
2. Do you turn the wrong way when someone that you can’t see calls out to you? 1) Almost Always, 2) Often, 3) Sometimes, 4) Almost never
3. You are outdoors in an unfamiliar place. You can hear the sound of someone mowing a lawn. You can’t see where they are. Do you know where the sound is coming from?
1) Almost never, 2) Sometimes, 3) Often, 4) Almost Always
4. You are sitting around a table or at a meeting with several people. There is some background noise. You can’t see everyone. Do you find it hard to know which person is speaking? 1) Almost Always, 2) Often, 3) Sometimes, 4) Almost never
5. You are in an unfamiliar house. It is quiet. You hear a door slam. Can you tell what part of the house the sound came from?
1) Almost never, 2) Sometimes, 3) Often, 4) Almost Always
6. You are in a high-rise apartment or office building. You can hear sound from another floor. Can you tell whether the sound is coming from above or below you?
1) Almost never, 2) Sometimes, 3) Often, 4) Almost Always
7. You are standing on the footpath of a busy street. A car horn sounds. Do you have difficulty telling which direction it came from?
1) Almost Always, 2) Often, 3) Sometimes, 4) Almost never
8. You are outside. A dog barks loudly. Can you tell where it is without having to look? 1) Almost never, 2) Sometimes, 3) Often, 4) Almost Always
9. You are standing on the footpath of a busy street. Can you hear which direction a bus or truck is coming from before you see it?
1) Almost never, 2) Sometimes, 3) Often, 4) Almost Always
10. In the street, can you judge how far away someone is, from the sound of their voice or footsteps?
1) Almost never, 2) Sometimes, 3) Often, 4) Almost Always
11. You are outdoors in an unfamiliar place. Someone calls out from somewhere above you (such as a balcony or bridge). Do you find it hard to tell where the voice is coming from? 1) Almost Always, 2) Often, 3) Sometimes, 4) Almost never
12. You are standing on the footpath of a busy street. Can you tell, just from the sound, roughly how far away a bus or truck is?
13. You are outside. You can hear an airplane. Do you find it hard to tell where the plane is in the sky, by the sound alone?
1) Almost Always, 2) Often, 3) Sometimes, 4) Almost never
14. If you have a problem telling where something is coming from, does it help if you move around to try to locate the sound?
1) Almost never, 2) Sometimes, 3) Often, 4) Almost Always
Section II – Handicap 15. Are you a confident person?
1) Almost never, 2) Sometimes, 3) Often, 4) Almost Always
16. You are in a place that is unfamiliar to you. Do you get nervous or feel uncomfortable in this situation because of trouble telling where sounds are coming from?
1) Almost Always, 2) Often, 3) Sometimes, 4) Almost never
17. Does difficulty telling where sounds are coming from lead you to avoid busy streets and shops?
1) Almost Always, 2) Often, 3) Sometimes, 4) Almost never
18. Because of difficulties telling where sounds come from, is a visit to the shops something you don’t do by yourself?
1) Almost Always, 2) Often, 3) Sometimes, 4) Almost never
19. You are invited into a stranger’s home. Do you feel less at ease in the stranger’s home than in a home that is familiar to you?
1) Almost Always, 2) Often, 3) Sometimes, 4) Almost never
20. If you are in a busy place, such as a crowded shopping center or city street, do the sounds you hear seem all mixed up or confused?
1) Almost Always, 2) Often, 3) Sometimes, 4) Almost never
21. When sounds are mixed up or confused, does this cause you to feel confused or unsure about exactly where you are?
1) Almost Always, 2) Often, 3) Sometimes, 4) Almost never
22. Does wearing your hearing aid(s) reduce any feelings of confusion you may experience? 1) Almost never, 2) Sometimes, 3) Often, 4) Almost Always
23. When sounds are mixed up or confused, does this cause you to lose concentration on what you were doing or thinking?
1) Almost Always, 2) Often, 3) Sometimes, 4) Almost never
24. You are in a place where sounds seem mixed up and confused. You are by yourself. Do you feel a need to leave that place quickly to go to a place where you will feel more comfortable? 1) Almost Always, 2) Often, 3) Sometimes, 4) Almost never
25. Does wearing your hearing aid(s) increase any feelings of confusion you may experience? 1) Almost Always, 2) Often, 3) Sometimes, 4) Almost never