Project title: Occupational hearing loss in Washington State Grant number: CDC/NIOSH 5 R01 OH 03894-03
Budget period: 9/30/2001 thru 9/29/2003
Date: January 10, 2005
Principal investigator: William E Daniell, MD MPH Affiliation/institution: Associate Professor
Department of Occupational and Environmental Health Sciences University of Washington, Box 357234
Seattle, WA 98195-7234
Telephone: 206-685-3160
Email: [email protected]
Co-investigators: Susan S Swan, MS CIH Janice Camp, MN MSPH CIH Mary M McDaniel, MS CCCA 1 Martin Cohen, ScD CIH 2 John Stebbins, MS CIH 3 Robert Leo, MS 4
Affiliations: 1 Pacific Hearing Conservation, Inc. Seattle, WA
2 Department of Labor & Industries [former affiliation] Olympia, WA
3 Department of Labor & Industries [current affiliation] Olympia, WA
4 Department of Labor & Industries [current affiliation] Seattle, WA
Table of Contents
Final Progress Report i
Table of Contents ii List of Tables iv List of Figures v Abstract vii Significant Findings ix Scientific Report 1 A Overview 1 B Background 2
B.1 Occupational noise induced hearing loss 2
B.2 Hearing loss prevention 3
B.3 Surveillance: Closing the loop 3
C Institutional Review 4
D Project 1 – Pilot Project 4
D.1 Methods 4
D.1.1 Population and study sample 4
D.1.2 Data collection: In summary, the work site evaluations included: 4
D.2 Results and Conclusions 5
E Projects 2 and 3 – Shared methods 6
E.1 Study population 6
E.2 Data sources 6
E.3 Target industries 7
E.4 Statistical measures of OHL claims 7
F Projects 2 and 3 – Descriptive study of OHL claims, 1984-1998 9
F.1 Results 9
F.2 Conclusions 9
G Project 2 – Telephone Survey of OHL Claimants 10
G.1 Methods 10 G.1.1 Sample selection 10 G.1.2 Subject recruitment 10 G.1.3 Survey procedure 11 G.1.4 Data analysis 12 G.2 Results 14 G.2.1 Background information 14 G.2.2 Employment history 14 G.2.3 Hearing ability 15
G.2.4 Awareness of hearing loss 15
G.2.5 Influential people or things 16
H Project 3 – Using OHL Claims as a Surveillance Tool to Target Industries 23
H.1 Methods 23
H.1.1 Study population 23
H.1.2 Company selection and recruitment 23
H.1.3 Subject selection and recruitment 24
H.1.4 Data collection 24
H.1.5 Data transformations 27
H.1.6 Data analysis 27
H.1.7 Technical reports and "guidebooks" 28
H.2 Results – Current exposures and practices; differences between industries 29
H.2.1 Background information 29
H.2.2 Noise exposure 29
H.2.3 Interviews 30
H.2.4 Use of hearing protection 33
H.2.5 Reliability analyses: Self-reported exposure and use of hearing protection 34
H.2.6 Audiometry 36
H.3 Conclusions – Current exposures and practices; differences between industries 39
H.3.1 Noise exposure and noise controls 39
H.3.2 Hearing loss prevention programs 41
H.3.3 Use of hearing protection 42
H.3.4 Hearing ability 43
H.4 Results – Comparison of workplace practices with OHL claims experience 44
H.4.1 Comparisons between industries 44
H.4.2 Relationships at the company level 45
H.5 Conclusions – Comparison of workplace practices with OHL claims experience 47 I Publications and Presentations 49
I.1 Peer-reviewed articles 49
I.2 Monographs 49
I.3 Presentations 49
J Cited Literature 50
Miscellaneous 52
K Inclusion of Gender and Minority Study Subjects 52
L Inclusion of Children 52
Tables and Figures 53
List of Tables
E1 Target industries
E2 Selected industries with high numbers and incidence rates of occupational hearing loss claims
G1 Background of phone survey participants
G2 Employment background of phone survey participants
G3 Conditions at most recent noisy job, reported by phone survey participants G4 Hearing ability of phone survey participants
G5 Awareness of hearing loss, by phone survey participants
G6 People or things cited as important or very important in decision to file an OHL claim, depending on age and how soon claim was filed after "date of injury"
G7 People or things cited as important or very important in decision to file an OHL claim, depending on whether a hearing tester or screening program outside work was important or not
G8 People or things cited as important or very important in decision to file an OHL claim, depending on whether an advertisement was important or not
H1 Worksite survey: Number of participating companies linked to an OHL claim H2 a Worksite survey: Data collected
H2 b Data collected: observations of hearing protector use, and post-shift interviews H3 Primary questions in management and employee interviews
H4 Background information about studied companies, by industry H5 Background information about interviewed employees, by industry H6 Major findings of work site evaluations, by industry
H7 Responses to selected questions on management interview, relative to overall interview score
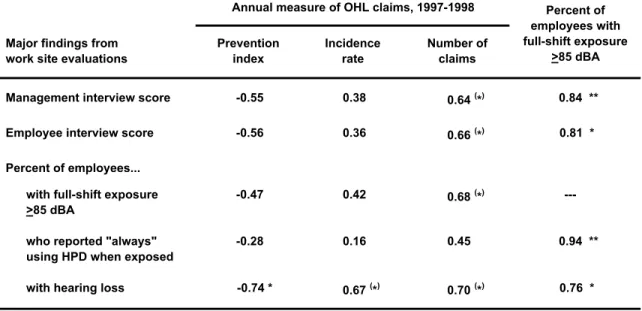
H8 Responses to selected questions on management interview, by industry H9 Hearing threshold values in three reference databases (ANSI S3.44-1996) H10 Correlation between annual measures of OHL claims and findings from work site
List of Figures
E1 Industry-specific measures of OHL claims during 1992-1998 and 1997-1998 G1 Subject recruitment for telephone survey
G2 Percent of subjects who said a person or thing (grouped) was an important or very important influence in their decision to file a claim
G3 Percent of subjects who said a person or thing (itemized) was an important or very important influence in their decision to file a claim
G4 Referral source and specialty of health care providers (other than the subject's usual provider) reported to be important in the decision to file an OHL claim
G5 Percent of subjects who said a person or thing was an important influence in their decision to file an OHL claim, relative to industry category, timing of claim, and subject age
G6 Percent of subjects who said a person or thing was a very important influence in their decision to file an OHL claim, relative to industry category, timing of claim, and subject age
G7 Percent of subjects who said an advertisement was important influence in their decision to file an OHL claim, relative to industry category, timing of claim, and subject age
H1 Duration of personal noise monitoring, by industry H2 a Full-shift personal noise exposure (Lave), by industry H2 a Full-shift personal noise exposure (Leq), by industry
H3 Prevalence of excessive employee noise exposure (Lave >85 dBA) at each company, by industry
H4 a,b Amount of time spent in noisy areas (>85 dBA), by industry and full-shift noise exposure H5 a Management interview scores, by industry
H5 b Company-average employee interview scores, by industry H6 Management interview score quartiles, by industry
H7 a Company-average employee interview scores relative to management interview scores H7 b Company-average employee interview scores relative to management interview scores,
by industry
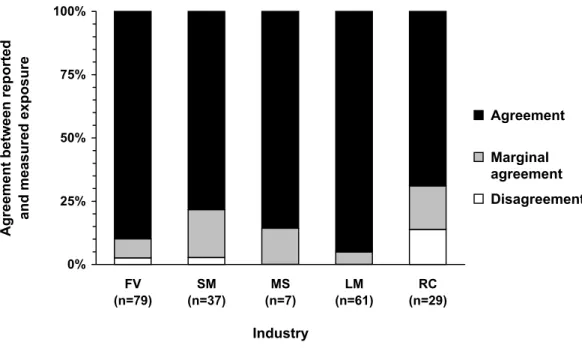
H8 a,b Reported use of hearing protection, when exposed to loud noise H9 a Agreement between reported and measured exposure
H9 b Agreement between reported and observed use of hearing protection
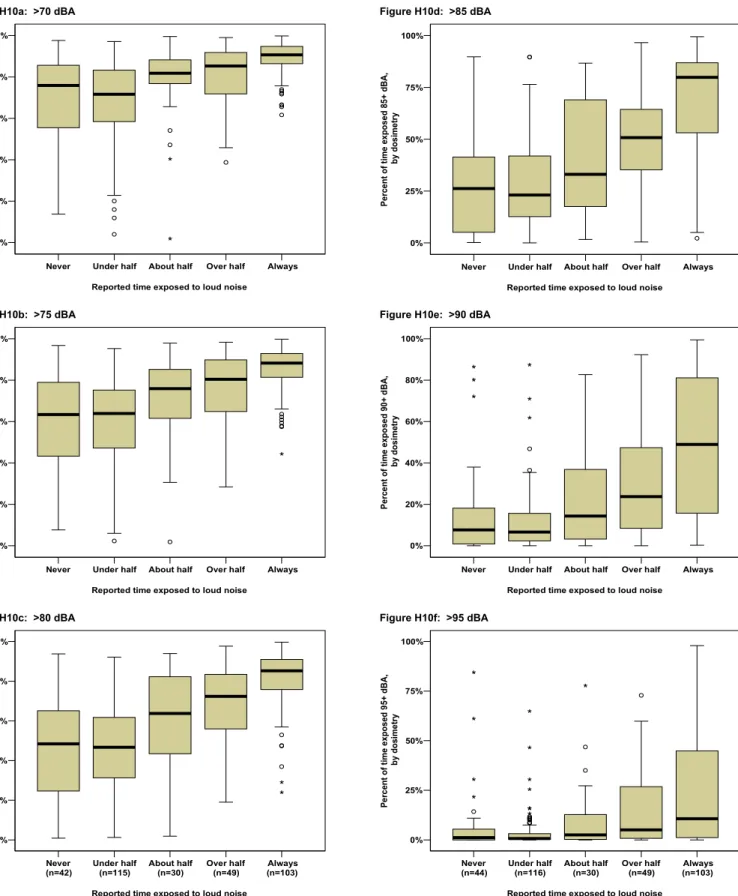
H10 Relationship between reported and measured time exposed to loud noise, using different noise level thresholds
H11 Hearing loss on existing audiograms, by industry
H13 a Hearing threshold levels at 0.5-1-2-3 kHz by industry category and age, relative to three reference databases (ANSI S3.44-1996)
H13 b Hearing threshold levels at 3-4-6 kHz by industry category and age, relative to three reference databases (ANSI S3.44-1996)
H14 Relationship of claims incidence to noise exposure, hearing loss prevention practices, and hearing loss in eight industries
H15 Relationship of claims number (count) to noise exposure, hearing loss prevention practices, and hearing loss in eight industries
H16 Relationship of claims prevention index to noise exposure, hearing loss prevention practices, and hearing loss in eight industries
H17 Relationship of noise exposure to hearing loss prevention practices, and hearing loss in eight industries
H18 Findings of work site evaluations compared to findings of Project 2 telephone survey of OHL claimants
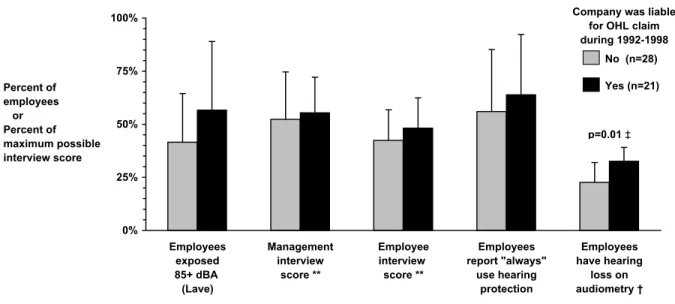
H19 a Findings of work site evaluation, relative to whether or not the company was liable for an OHL claim during 1992-1998
H19 b Findings of work site evaluation, relative to whether or not the company was identified by a surveyed OHL claimant as their most recent noisy employment H20 Findings of work site evaluations in three industries, relative to whether or not the
company was liable for an OHL claim during 1992-1998 or mentioned in the phone survey
Abstract
Washington State experienced a large increase in workers' compensation claims for occupa-tional hearing loss (OHL) during the 1990s, continuing to the present. The findings of studies of these claims, and studies elsewhere, indicate that a substantial segment of the contemporary work force still faces a significant risk for developing OHL. There is a need for actions to address the underlying problems. There is also a critical need for information to guide any actions in a constructive and efficient manner.
This study included two main projects: 1) a telephone survey of people with recent OHL claims, and 2) field evaluation of noise exposures and hearing loss prevention practices at 76 companies in eight industries with higher than average rates of OHL claims. The study also analyzed
previously collected pilot data from field evaluations in ten foundries, and incidentally yielded a descriptive study of OHL claims filed during 1984-1998. The overall study had four specific aims. Aim 1: To identify the major pathways and influential factors by which individuals with OHL are identified and reported to the workers' compensation system.
Thetelephone survey found that the decision by a current or former worker to file an OHL claim is commonly influenced by a number of factors. The most important influence on decisions to file an OHL claim was social contacts, especially family members, but also friends and coworkers. Several types of health care providers were identified as important or very important influences on decisions to file a claim. Most subjects said a screening program conducted outside of work had an important influence on their decision to file an OHL claim, but they generally described this as less important than other influences, particularly family members and friends.
Only about a quarter of subjects said an advertisement or other media source of information was an important influence, and most did not say it was a very important influence.
There was a relative lack of influence by workplace representatives on decisions to file an OHL claim. This raises concern about the completeness or adequacy with which audiometry findings are communicated to workers when they are tested in workplace annual monitoring programs. Aim 2: To identify factors that may have contributed to the increased reporting of OHL in Washington State.
The telephone survey of did not identify any factors – "smoking guns" – that clearly accounted for why so many more current and former workers chose to file an OHL claim in recent years, than in the past. As noted, most of the surveyed claimants said that a screening program conducted outside of work had an important influence on their decision to file an OHL claim, but they generally described this as less important than other influences, particularly family and friends. It is possible, however, this study underestimated the direct or indirect influence of screening programs, advertisements, and media information on decisions to file a claim. Aim 3: To determine whether there is any substantial work-related risk at the present time for OHL in industries with high numbers and/or rates of OHL claims.
The information provided by the telephone survey subjects about conditions at their most recent noisy job – most of which occurred since OSHA/WISHA hearing conservation regulations were implemented – suggested that many employers are not optimally compliant with regulations. Based on the subject reports, employers in some industries, particularly construction and other non-manufacturing industries, are generally less compliant than employers in other industries.
The evaluation of work sites in selected industries found that excessive noise exposure was common in all of the study industries. Nearly all companies had employee exposures that required a hearing loss prevention program, and more than half had employee exposures that required the employer to consider possible noise controls. In general, the possibility of new noise controls received no or low priority in all of the study industries.
Most of the evaluated companies had substantial shortcomings in their hearing loss prevention programs. In general, there was little difference between industries in the use of noise
measurements or consideration of noise controls. However, policies and practices related to employee training, hearing protection, and audiometric testing were generally more complete in some industries than others. Within each industry, there were substantial differences between companies in the completeness of hearing loss prevention policies and practices. Every industry included some companies with relatively complete policies and practices and some companies where policies and practices were substantially incomplete.
Hearing protection was commonly underused. Reported use was highest at companies with relatively complete hearing conservation programs, and in industries where excessive noise exposure was most prevalent and least intermittent. Many employees had difficulty estimating how often, and presumably when, their noise exposure was excessive. This can pose a problem in situations where exposure is intermittent and hearing protection is used only during exposure. Aim 4: To assess the effectiveness of using workers' compensation claims information to "target" or identify industries and worksites with remediable risk factors for a chronic occupational health problem, using OHL as a case in point.
The evaluation of work sites in selected industries found little evidence that claims statistics for OHL – and conceivably for other occupational illnesses that manifest many years after first exposure to a hazard – are useful for identifying industries where there is a high risk for developing that condition and where additional preventive measures are most needed.
In general, the reports by OHL claimants in the telephone survey about their most recent noisy workplace also were not an effective source of information for identifying industries that were substantially more in need of intervention than other industries, nor companies that were more in need of intervention than other companies within the same industry.
It is conceivable that claims statistics or claimants' reports could be useful for targeting specific industries, if supplemented with other information about candidate target industries.
The OHL claims statistics for the study industries showed a significant correlation with the average prevalence of hearing loss on audiometry records in each industry. In industries where OHL claims were more common, monitored employees were more likely to have hearing loss. Claims statistics for OHL – and conceivably other occupational illnesses – may be useful for targeting initiatives to identify workers who have that condition and who may not be aware they have the condition. Information about the usual extent of noise in an industry is probably a better source of information for targeting interventions to reduce risk for developing OHL, than is information about hearing loss claims, although the two may be useful when considered together. In general, the average completeness of hearing loss prevention policies and practices at work sites in a study industry was strongly associated with the extent of noise overexposure in that industry. Furthermore, the intuitive response to information about noise levels would not
necessarily be the best response. The industries with greatest margin for improving hearing loss prevention efforts are not necessarily the noisiest industries, but may be industries where noise exposure is more moderate or intermittent.
Significant Findings
Washington State experienced a large increase in workers' compensation claims for occupational hearing loss (OHL) during the 1990s, continuing to the present. Almost half of these claims involved persons beyond the usual retirement age, indicating at least part of the increase represents hearing loss caused by noise exposures that occurred many years or decades ago. However, the findings of studies of these claims, and studies elsewhere, indicate that a
substantial segment of the contemporary work force still faces a significant risk for developing OHL. There is a need for actions to address and remediate the underlying problems. There is also a critical need for information to guide any actions in a constructive and efficient manner.
This study had four specific aims:
• Aim 1: To identify the major pathways and influential factors by which individuals with OHL are identified and reported to the workers' compensation system.
• Aim 2: To identify factors that may have contributed to the increased reporting of OHL in Washington State.
• Aim 3: To determine whether there is any substantial work-related risk at the present time for OHL in industries with high numbers and/or rates of OHL claims.
• Aim 4: To assess the relative effectiveness of using workers' compensation claims
information to "target" (i.e., appropriately identify) industries and worksites with remediable risk factors for a chronic occupational health problem, using OHL as a case in point. This study consisted of three related projects:
• Project 1 involved analysis of data collected by the pilot project, in which noise exposures and hearing conservation practices were evaluated at ten foundries.
• Project 2 was a cross-sectional study – using telephone interviews – of individuals with workers' compensation claims that were filed during 1997-1998 and accepted for OHL. In addition, the claims data obtained for this project were combined with OHL claims data from a separate project (1984-1996) to conduct a descriptive analysis of OHL claims.
• Project 3 was a cross-sectional study – evaluating noise exposures and hearing loss prevention activities – at a representative sample of worksites in each of nine industries with relatively high industry-specific rates of OHL claims.
Aim 1: To identify the major pathways and influential factors by which individuals with OHL are identified and reported to the workers' compensation system.
Project 2 originally planned to characterize the "awareness-healthcare-claim pathways," or sequences of events, by which persons become aware of their hearing condition, receive a diagnosis, and enter the workers' compensation system. However, the pilot telephone survey found that many subjects did not know or recall which provider had filed their claim, or the sequence of provider contacts before and after claim filing. In addition, many subjects did not know or understand differences between different types of hearing professionals. Consequently, characterization of the healthcare pathway focused on: the health care provider who was
involved in filing the claim; any referral made by that provider; and the referral source for any non-usual provider who was "important" in the decision to file a claim.
The Project 2 telephone survey of OHL claimants found that the decision by a current or former worker to file an OHL claim is commonly influenced by a number of factors. The most important influence on individuals' decisions to file an OHL claim was social contacts, especially family members, but also friends and coworkers.
Several types of health care providers were identified as important or very important influences on decisions to file a claim.Most subjects said a screening program conducted outside of work had an important influence on their decision to file an OHL claim, but they generally described this as less important than other influences, particularly family members and friends.
Only about a quarter of subjects said an advertisement or other media source of information was an important influence, and most did not say it was a very important influence. It is possible, however, that this study underestimated the direct or indirect influence of screening programs, advertisements, and media information on decisions to file a claim.
There was a relative lack of influence by workplace representatives on decisions to file an OHL claim. This raises concern about the completeness or adequacy with which audiometry findings are communicated to workers when they are tested in workplace annual monitoring programs.
• For the majority of individuals with an OHL claim, the decision to file a claim was not triggered by recent awareness of hearing loss or its possible relationship to noise at work, nor by progressive worsening of hearing loss. However, recent information from a health care provider about their hearing loss, and its possible relationship to noise at work, probably had an important influence on a near majority of the subjects. The survey did not attempt to distinguish which provider, or type of provider, communicated this information.
• Several types of health care providers were identified as important or very important influences on many subjects' decisions to file a claim. About two-thirds of subjects said a hearing tester in a screening program outside of work played an important role in their decision to file an OHL claim, although that role was rarely considered very important. In contrast, one-quarter of subjects said their usual health care provider played an important role; however, more often than not, they considered that role to be very important.
• About one-quarter of subjects said a health care provider other than their usual provider played an important, and often very important role, in their decision to file an OHL claim. Most of those providers were otolaryngologists, audiologists, or other hearing-related professionals. Subjects came under the care of those important other providers through a variety of routes, but most often by self-referral. The next most common route was by referral from the subject's usual health care provider.
• Most of the providers who helped subjects file their OHL claim or evaluated them before they filed their claim were otolaryngologists or a type of hearing specialist the subject could not identify. Subjects' usual providers served this role in less than 20% of claims, but generally also referred subjects to a hearing professional.
Since this survey, the State of Washington implemented a requirement that OHL claims be filed within two years after diagnosis of OHL or cessation of occupational noise exposure (i.e., the "date of injury"), to be fully eligible for potential benefits. Claims filed after two years are still
eligible for coverage of medical expenses, including hearing aids, but not disability compensation. In the absence of such a requirement, about half of the subjects, including about one-third of those who were younger than 65 years of age when they filed their claim, did not file their claim in what would now be considered a timely manner.
• In the absence of a two-year filing requirement, there were some identifiable differences between individuals who filed their claim sooner or later than two years after the "date of injury." However, many of those differences were explainable by the difference in age.
• Among subjects who were younger than usual retirement age, those who filed more than two years after the date of injury were, on average, identical in age to those who filed in more timely manner but had ended their last noisy job about five years earlier. It is possible that age – or age-related phenomena such as retirement or impending retirement, onset of concomitant non-occupational hearing loss, particularly presbycusis, or the development of other health problems – may be a more important stimulus than the recency of final noise exposure for filing an OHL claim, at least in the absence of a two-year filing requirement. Aim 2: To identify factors that may have contributed to the increased reporting of OHL in Washington State.
The Project 2 telephone survey of OHL claimants did not identify any factors – "smoking guns" – that clearly accounted for why so many more current and former workers chose to file an OHL claim in recent years, than in the past. As noted, most of the surveyed claimants said that a screening program conducted outside of work had an important influence on their decision to file an OHL claim, but they generally described this as less important than other influences, particularly family and friends. It is possible, however, this study underestimated the direct or indirect influence of screening programs, advertisements, and media information on decisions to file a claim.
• A majority of survey subjects said hearing screening programs conducted outside of work were important, but not very important, in their decision to file a claim, and a substantial minority said advertisements and media sources of information were important. Most subjects attributed greater importance to family members and other social contacts, whose presence would not be expected to vary substantially from one period of time to another. Of note, subjects who said a screening program was an important influence were even more likely than those who did not say so, to report that family members and friends were important, and even very important, influences on their decision to file a claim.
• This study could have underestimated the influence of advertisements, media information, and screening programs on subjects' decisions to file an OHL claim. It is possible that publicly disseminated information, including intermediate person-to-person communication of that information, could have had a greater indirect than direct influence on subjects' decisions, by stimulating the people whom subjects considered to be important or more important influences. Similarly, it is plausible that the relative importance of publicly disseminated information and screening programs was under-appreciated by subjects. Aim 3: To determine whether there is any substantial work-related risk at the present time for OHL in industries with high numbers and/or rates of OHL claims.
The information provided by Project 2 telephone survey subjects about conditions at their most recent noisy job – most of which occurred when OSHA/WISHA hearing conservation regulations were in force – suggested that many employers are not optimally compliant with those
regulations. Based on the subject reports, employers in some industries, particularly construction and other non-manufacturing industries, are generally less compliant with regulations than employers in other industries.
Project 3, the evaluation of work sites in selected industries, found that excessive noise exposure was common in all of the study industries. Nearly all companies had employee
exposures that required a hearing loss prevention program, and more than half had employee exposures that required the employer to consider possible noise controls. In general, the possibility of new noise controls received no or low priority in all of the study industries.
• The percent of employees with excessive noise exposure differed significantly between the study industries. However, excessive exposure was common in all industries. In addition, the percent of employees with excessive noise exposure differed widely between companies within most of the study industries.
• Excessive employee noise exposure would have been 1.5 to 3 times more common if the NIOSH-recommended Leq was used to characterize full-shift noise exposures, rather than the OSHA-specified Lave.
• Employee noise exposures were relatively continuous at lumber mills. However, In all other industries, employee exposures generally were intermittent, and most employees spent at least several hours daily in areas where noise levels were under 85 dBA.
• In general, the possibility of new noise controls received no or low priority in all of the study industries. The study team judged that it would have been feasible for all or nearly all of the participant companies to implement one or more effective noise controls, at reasonable cost, to achieve a meaningful reduction in noise exposures for one or more employees. However, most companies had insufficient information about noise exposures in their workplace, and most had no plans to consider or implement any new noise controls.
Most of the evaluated companies had substantial shortcomings in their hearing loss prevention programs. In general, there was little difference between industries in the use of noise
measurements or consideration of noise controls. However, policies and practices related to employee training, hearing protection, and audiometric testing were generally more complete in some industries than others. Within each industry, there were substantial differences between companies in the completeness of hearing loss prevention policies and practices. Every industry included some companies with relatively complete policies and practices and some companies where policies and practices were substantially incomplete.
• Employers are required to provide hearing loss prevention training upon first assignment of a new or relocated employee to a noise exposed position, and at least annually thereafter for all exposed employees. Annual training was not conducted by more than one-third of companies, and training had shortcomings at many other companies. Many employees who had annual training at their present company did not recall ever having such training.
• Employers are required to provide at least two different types of hearing protection for noise exposed employees. At most companies, all or nearly all employees reported that hearing protectors were readily available for them at no personal cost, although this was often limited to only one type of protector. However, at 25% of companies, between 11% and 48% of employees said that no hearing protectors were readily available for them.
• Employers are required to ensure that employees use appropriate hearing protection when noise exposure is excessive. Most company representatives reported no formal company policy or enforcement practices requiring use of hearing protection, either in the entire production area or in specific noisy areas. According to employees, however, hearing protector use policies were more common than reported by company representatives. The findings suggest a need for more enforcement at many companies and improved
coordination of enforcement policies at other companies.
relatively complete hearing conservation programs, and in industries where excessive noise exposure was most prevalent and least intermittent. Many employees had difficulty estimating how often, and presumably when, their noise exposure was excessive. This can pose a problem in situations where exposure is intermittent and hearing protection is used only during exposure. • Overall, only 62% of interviewed employees said they always or almost always used hearing
protection when they were exposed to loud noise. The reported use of hearing protection differed significantly between industries and, in general, was highest in industries where excessive noise exposure was most prevalent and least intermittent. The reported use of hearing protection was also generally highest at companies with relatively complete hearing conservation programs, particularly companies with actively enforced requirements to wear hearing protection. This suggests that greater company effort to ensure hearing protection can, on average, result in better employee hearing protective behavior.
• Overall, 25% of employees said they sometimes used hearing protection when they were exposed to loud noise, and another 13% said they either never (or almost never) used protection or were never exposed. It may be appropriate to consider these distinctions in endeavors to increase the use of hearing protection.
• Employees were often incorrect in estimating how often – and presumably when – they were exposed to loud noise. A commonly taught rule-of-thumb guideline for estimating noise levels was found to have limited reliability. This inaccuracy of employee perception could pose an important problem in industries where noise levels are intermittent and hearing protection may not be needed continuously, unless employees are given more than subjective guidelines for when and when not to wear hearing protection.
Hearing loss was common on existing audiometry for current and recent employees. • Overall, 15% had enough hearing loss to meet American Medical Association criteria for
impairment, and another 11% had moderate or worse high frequency loss without impairment. Among employees 55 years or older, 53% had evidence of impairment, and another 21% had moderate or worse high frequency hearing loss.
• Hearing loss was significantly more common in some industries than others. The difference between industries in the extent of hearing loss was seen in all except the youngest age group of employees, suggesting that the risk of hearing loss continues to the present, in at least six of the study industries.
• Employers are required to inform employees about abnormal findings on audiometry, and such findings can provide an important teaching opportunity, to inspire an employee to improve personal efforts to protect his/her hearing. However, the majority of workers whose audiometry revealed a clinically significant amount of hearing loss had not been informed – or did not recall being informed – that their audiometry showed an abnormality. More than a third had no tell-tale symptoms of hearing loss and were unaware of their hearing loss.
• Employers are required to provide written notification and training to individual employees who have a specified amount of hearing change over time, known as a standard threshold shift (STS). This important early indicator of possible noise effects on hearing was not being used effectively. Most employees whose audiometry showed an STS while they were
employed at the present company did not recall ever being informed of that finding, and only about half of those who thought they had an STS had truly experienced one. Employee recollection of this important indicator was essentially no better than a random guess.
Aim 4: To assess the relative effectiveness of using workers' compensation claims
information to "target" (i.e., appropriately identify) industries and worksites with remediable risk factors for a chronic occupational health problem, using OHL as a case in point.
Project 3, the evaluation of work sites in selected industries, found little evidence that claims statistics for OHL – and conceivably for other occupational illnesses that manifest many years after first exposure to a hazard – are useful for identifying industries where there is a high risk for developing that condition and where additional preventive measures are most needed. In general, the reports by OHL claimants in the Project 2 telephone survey about their most recent noisy workplace also were not an effective source of information for identifying industries that were substantially more in need of intervention than other industries, nor companies that were more in need of intervention than other companies within the same industry.
It is conceivable that claims statistics or claimants' reports could be useful for targeting specific industries, if supplemented with other information about candidate target industries.
• This study evaluated companies in a limited number of industries, mostly in manufacturing, and included only one primary production industry, one construction industry, and no industries within the broad sector of "other" industries. Therefore, the study findings may have limited generalizability, particularly for the industries outside manufacturing sectors.
• The OHL claims statistics for the study industries showed no consistent relationship with either the average extent of employee overexposure to noise or the average completeness of hearing loss prevention policies and practices, at companies evaluated in those industries.
• One study industry, road construction, was an exception to this general conclusion. This industry had a very high incidence rate of OHL claims, and the companies evaluated in this industry tended to have substantially incomplete hearing loss prevention policies and
practices. However, the average extent of employee overexposure to noise and completeness of hearing loss prevention policies and practices in this industry were comparable to what this study found in other industries with much lower rates or absolute numbers of OHL claims.
• Information about OHL claims may have limited or no usefulness for identifying specific companies where there is a relatively high need for additional preventive measures. Individual companies were no more likely to have incomplete hearing loss prevention policies or practices, if they had been assigned liability for one or more OHL claims or if an OHL claimant described them as a recent noisy workplace, compared to other companies that were not linked to an OHL claim, in the same industry.
The OHL claims statistics for the study industries showed a significant correlation with the average prevalence of hearing loss on audiometry records in each industry. In industries where OHL claims were more common, monitored employees were more likely to have hearing loss. Claims statistics for OHL – and conceivably other occupational illnesses – may be useful for targeting initiatives to identify workers who have that condition and who may not be aware they have the condition. Information about the usual extent of noise in an industry is probably a better source of information for targeting interventions to reduce risk for developing OHL, than is information about hearing loss claims, although the two may be useful when considered together. In general, the average completeness of hearing loss prevention policies and practices at work sites in a study industry was strongly associated with the extent of noise overexposure in that industry. Furthermore, the intuitive response to information about noise levels would not
necessarily be the best response. The industries with greatest margin for improving hearing loss prevention efforts are not necessarily the noisiest industries, but may be industries where noise exposure is more moderate or intermittent.
Scientific Report
A
OVERVIEW
Washington State experienced a large increase in workers' compensation claims for occupational hearing loss (OHL) during the 1990s, continuing to the present.1 Almost half of these claims involve persons beyond the usual retirement age, indicating at least part of the increase
represents hearing loss caused by noise exposures that occurred many years or decades ago. However, the findings of studies of these claims, and studies elsewhere, indicate that a
substantial segment of the contemporary work force still faces a significant risk for developing OHL. There is a need for actions to address and remediate the underlying problems. There is also a critical need for information to guide any actions in a constructive and efficient manner.
This study had four specific aims:
• Aim 1: To identify the major pathways and influential factors by which individuals with OHL are identified and reported to the workers' compensation system.
• Aim 2: To identify factors that may have contributed to the increased reporting of OHL in Washington State.
• Aim 3: To determine whether there is any substantial work-related risk at the present time for OHL in industries with high numbers and/or rates of OHL claims.
• Aim 4: To assess the relative effectiveness of using workers' compensation claims
information to "target" (i.e., appropriately identify) industries and worksites with remediable risk factors for a chronic occupational health problem, using OHL as a case in point. This study consisted of three related projects:
• Project 1 involved analysis of data collected by the pilot project, in which noise exposures and hearing conservation practices were evaluated at ten foundries.
• Project 2 was a cross-sectional study – using telephone interviews – of individuals with workers' compensation claims that were filed during 1997-1998 and accepted for OHL. In addition, the claims data obtained for this project were combined with OHL claims data from a separate project (1984-1996) to conduct a descriptive analysis of OHL claims.
• Project 3 was a cross-sectional study – evaluating noise exposures and hearing loss prevention activities – at a representative sample of worksites in each of nine industries with relatively high industry-specific rates of OHL claims.
The nine study industries were: • Road construction
• Lumber milling
• Pulp and paper production • Heavy gauge metal fabrication • Machine shops
• Sheet metal fabrication
• Fruit and vegetable processing (i.e., packing, canning and freezing) • Printing
B
BACKGROUND
Occupational hearing loss (OHL) provides an excellent model for studying the preventability of chronic occupational illnesses. There are fewer gaps in knowledge about OHL than for virtually all other occupational illnesses, and the primary barriers to prevention lie in implementation of that knowledge. If workers cannot be effectively protected against the development of OHL, then one must question how workers could ever be protected against other, more complex or less well understood hazards.
B.1 Occupational noise induced hearing loss
Noise induced hearing loss is one of the most common, best understood, and readily
preventable occupational illnesses. The dose-response relationships between repeated noise exposure and hearing loss are well understood,2 more so than for almost any other occupational health hazard. Studies in the 1980s concluded more than nine million workers in the U.S. are exposed daily to potentially harmful levels of noise.2 Fortunately, noise is easily measurable with widely available and affordable instruments. Similarly, the most prevalent health effect of noise, hearing loss, is readily detectable at early stages of development using a commonplace clinical instrument, the audiometer, potentially before symptoms or clinically important dysfunction can manifest. Detection of the hazard or the health effect can occur in time to take actions to prevent development or progression of hearing loss. There are well established noise control strategies and affordable personal protection devices that can, in principle, reduce almost any worker's noise exposure to levels that are widely recognized as safe. Finally, federal and state regulations have been in place since the 1980s, requiring employers to implement noise controls or other hearing loss prevention measures, when noise exposures reach action or permissible levels. The consequences of occupational noise exposure can be devastating for the affected worker. Hearing loss, which often develops and progresses insidiously, may not reach a level that is bothersome to the worker until decades later in life, when effects of aging on hearing ability can compound any previous injury caused by noise. Unfortunately, personal protective efforts at that point in life generally have much less benefit than if they had been used sooner in life. The progressive onset of hearing loss can impact a worker's life in myriad ways. At work, the inability to hear important production sounds, warning sounds, or communication can predispose a worker to making errors or experiencing an injury. Outside of work, hearing loss may cause or contribute to social withdrawal, strained personal relationships, and inability to appreciate enjoyable sounds such as music, children's voices, and sounds of nature. Tinnitus, or ringing in the ear, is another common consequence of repeated noise exposure.3 For some, tinnitus can be even more distressing than the loss of hearing.
In spite of its preventability, noise induced hearing loss remains a prevalent occupational health problem. In Washington state, for example, the annual number of workers' compensation claims for hearing loss increased more than ten-fold in a decade, with annual disability compensation costs exceeding $50 million in recent years.1 Much of this increase occurred among individuals older than the usual retirement age, suggesting the increase is at least partially a reporting phenomenon and not related to contemporary work circumstances. Credible explanations include noisy work conditions that existed in the past but that may no longer exist, and possible changes in clinical service and marketing practices. However, substantial increases in claims also occurred among younger individuals who have more recent or ongoing noise exposures, suggesting that recent or current workplace practices may place contemporary workers at risk for hearing loss. The magnitude of the claims increase and uncertainty make it important to evaluate the current extent of occupational noise exposure and adequacy of hearing loss prevention efforts.
B.2 Hearing loss prevention
In Washington state, when an employee's average noise exposure can reach or exceed 85 dBA (decibels), employers must maintain an effective hearing loss prevention program. The hearing loss prevention rule, formerly the hearing conservation rule, was recently updated and rewritten for clarity and ease of use, but the basic requirements are largely unchanged since 1984.4 A hearing loss prevention program must include representative noise monitoring, employee training, appropriate hearing protection, audiometric monitoring, and ongoing program
evaluation. When employee exposures reach 90 dBA, the employer must utilize feasible noise controls. The Washington rule applies to construction and agriculture, as well as fixed industry. There are several lines of evidence that hearing conservation efforts can be effective. Longitudi-nal surveillance in Sweden and British Columbia, Canada, has shown declines in rates of hearing loss after implementing industry-wide, comprehensive hearing conservation programs.5,6 Large manufacturing companies have reported similar success reducing rates of hearing loss with hearing conservation programs.7,8 A larger number of studies have examined training and related interventions and found increases in workers' use of hearing protection, at least in the short term.9 It is reasonable to assume, although it is not clearly established, that increased and continued use of hearing protection will in the long term lead to reductions in hearing loss. Reducing or eliminating a hazard is generally the preferred strategy for mitigating the associated health risk. However, personal hearing protection devices, rather than noise controls, remain a cornerstone of most contemporary hearing loss prevention programs. Unfortunately, many investigators have found that hearing protectors are commonly underused in noisy industries,10,11 although studies of temporal trends indicate that usage has increased in recent times.12
B.3 Surveillance: Closing the loop
Workplace noise and OHL provide a framework for testing strategies to "close the loop" in surveillance for occupational illness.13 Closing the loop means making the final, essential steps. One definition of surveillance is, "continuous analysis, interpretation, and feedback of systemati-cally collected data.... By observing trends in time, place, and persons, changes can be observed or anticipated, and appropriate action, including investigative or control measures, can be taken."14 Occupational illnesses, with latency periods that may span years or decades, present extreme challenges for surveillance systems. The most hazardous situations or places that caused cases seen today, may no longer exist, at least not in the same places. With hearing loss, there is a good chance that operations that were noisy enough in the past to cause hearing loss, are still noisy. However, it is now twenty years since hearing conservation regulations came into effect, and historically noisy workplaces and industries may, or may not, have already taken the necessary and required steps to prevent new cases of hearing loss.
There is limited experience with action-oriented surveillance for OHL. At least two state SENSOR (Sentinel Event Notification Systems for Occupational Risks) programs include a focus on hearing loss, but generally more effort has been directed to other conditions.15 In one study, investigators interviewed 1,378 individuals with a fixed hearing loss, out of 1,477 reported to the state of Michigan during 1992 to 1997.12 Descriptive statistics were compiled. In addition, based on the interviews plus review of State OSHA reports of past inspections at companies mentioned by interviewees, 43 work sites were identified for inspection: 23 had excessive noise levels, and 17 of those had a deficient or no hearing conservation program. The investigators concluded that the targeted inspections helped to protect 758 noise-exposed workers in those 17 facilities.
The primary goal of the present study was to explore further the use of information from workers' compensation claims for surveillance of OHL.
C
INSTITUTIONAL REVIEW
All study procedures were initially reviewed and approved by institutional review boards (IRBs) at the University of Washington (UW) and at the State Department of Health (DOH). After the initial review, modifications to study procedures were reviewed and approved only by the UW IRB, as agreed by all parties under the existing UW/DOH cooperative agreement. All transfers of data from DLI to the UW researchers were overseen by Barbara Silverstein or Steven Cant, DLI employees designated in a DLI/UW Memorandum of Understanding to serve as a Data Utilization Supervisor.
D
PROJECT 1 – Pilot Project
The goal of the pilot project was to determine, in a noisy industry with high rate of OHL claims, whether contemporary hearing loss prevention practices were sufficient to reduce the risk of hearing loss from noise exposures in that industry. The methods and findings are described in a published journal article,16 which is included as Appendix 1, and are summarized here.
Funds from the present grant were used only to support analysis of data, which had been collected previously. The work site evaluations were conducted by the Washington State OSHA (WISHA) as a special emphasis program, primarily in one region (King County, which includes Seattle). Daniell and Swan collaborated with the WISHA team to develop a systematic protocol for evaluating compliance with the State noise and hearing conservation regulation, at targeted work sites. Swan, working as a student intern at WISHA, had primary responsibility (overseen by DLI inspectors) for conducting the noise component of each inspection.
D.1 Methods
D.1.1 Population and study sample
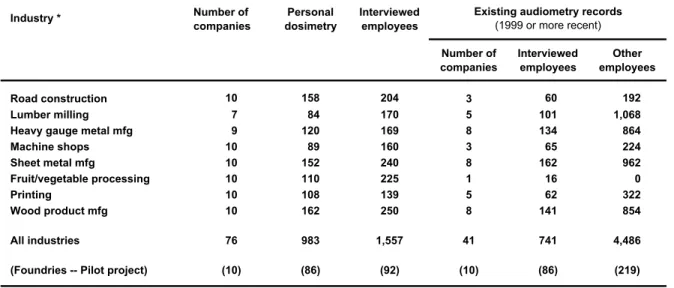
The WISHA team chose foundries as the target industry, in part because of the high number and rate of hearing loss claims, but also because of the number of hazards in this industry besides noise. Twenty-nine candidate companies were identified. Ten were selected for inspection based on their larger size, presence on another WISHA targeting list, and/or prior history of a WISHA citation (but not within the preceding two years).
D.1.2 Data collection: In summary, the work site evaluations included:
• Dosimetry: Full-day, personal noise dosimetry was conducted for a representative sample of employees (n=86) in jobs where noise exposures were most likely to exceed 85 dBA.
• Interviews: The management representative responsible for hearing loss prevention activities and a sample of employees underwent a structured interview. The employee sample included all employees (except one) who wore a dosimeter, plus a convenience sample of 40 employees in noise-exposed jobs. Interviews were excluded for 33 employees who could not speak English well enough to complete all of the interview. Summary scores were calculated for the 92 employee interviews and the 10 management interviews, using the number of favorable responses on selected, representative, non-duplicated questions.
• Audiometry: Existing audiometry records were reviewed for 305 employees who were tested at the most recent annual session, at the eight companies that had conducted any testing. Audiometry was available for 86 interviewed employees. Records were reviewed for the presence of hearing loss and any past occurrence of a "standard threshold shift" (i.e.,
the amount of hearing loss over time that triggers the WISHA requirement for employer actions including written notification of the affected employee).
D.2 Results and Conclusions
In summary, Project 1 found that:
• Employee full-shift noise exposures routinely exceeded 85 dBA, the level at which a hearing loss prevention program is required in Washington.
• All ten foundries had serious, citable deficiencies in their hearing loss prevention programs.
• Employees often were not aware of important findings on their audiograms, including hearing loss or a standard threshold shift.
• There was a strong positive correlation between the management interview score and the average employee interview score at each work site (r=0.70, p=0.02). This suggests that companies where more effort is put into compliance with hearing loss prevention
requirements can achieve a greater favorable impact on employee awareness of noise and efforts to prevent hearing loss.
• Companies with the highest interview scores still had broad deficiencies in their hearing loss prevention programs. This indicates that workers in this industry probably face a continuing substantial risk of OHL.
E
PROJECTS 2 AND 3 – Shared methods
E.1 Study populationThe study samples for Projects 2 and 3 were drawn from the population of workers and employers whose industrial insurance is provided or regulated by the Washington State Department of Labor and Industries (DLI). The DLI regulates workers' compensation covering nearly all non-federal employers and workers in the state, except for workers covered by special laws or programs, self-employed individuals, corporate officers, and domestic employees. About 400 employers, generally among the largest in the state, have individual self-insured programs, providing coverage for approximately one-third of workers in the DLI jurisdiction. Self-insured programs are regulated by DLI, and limited information about each self-Self-insured claim is reported to DLI. The DLI administers the State Fund, which directly provides industrial insurance for the other two-thirds of workers. The State OSHA program, WISHA, is also based in the DLI. The study population for Project 3 was restricted to employers listed in one of the nine industry categories chosen as a "target" industry for this study (see below).
E.2 Data sources
The study populations for Projects 2 and 3 were identified using DLI industrial insurance records. The DLI Insurance Services Division maintains computerized databases with
administrative data for workers' compensation claims filed in the DLI jurisdiction. The records used for the study were:
• OHL Claims, 1997-1998: The primary data source for identifying the claimant population in Project 2 was DLI records for workers' compensation claims that had filing dates during 1997-98 and were accepted for OHL. Information in the DLI records includes: claimant identity, contact information, and demographics; condition reported at claim filing;
administrative dates and outcomes; and employer identification. The reported condition was coded by DLI with U.S. Department of Labor Z16.2 codes
Claims were identified using inclusion criteria adapted from a previous study of OHL claims:1 (1) the claim was filed during 1/1/97 to 12/31/98; (2) the claim was subsequently accepted for a work-related condition; and (3) Z-16.2 codes for the condition reported at filing were: (a) nature of illness or injury = hearing loss (230), and/or (b) source of illness or injury = noise (4400). There were 10,180 claims that met these criteria.
Industry was coded by DLI with DLI "risk classes," which are used for industrial insurance premium adjustment purposes. For this study, risk classes were grouped into about 100 larger industry categories using standard and modified DLI classifications.1,17,18
• OHL Claims, 1992-1996: The study also utilized records for OHL claims filed during 1992-1996, together with the records for 1997-1998 OHL claims, to produce industry-specific summary statistics for selecting the nine "target" industry categories. These claims were identified using the same criteria as above, but with a filing date during 1/1/92 to 12/31/96. There were 12,280 claims that met these criteria.
• Employment, 1992-1998: The DLI provided summary data for the total hours of reported employment (i.e., summed for all employers) in all DLI risk classes, for each year during 1992-1998, separately for State Fund and self-insured employers. These data were used to calculate industry-specific incidence rates of OHL claims. By DLI convention, employment hours were divided by 2,000 to estimate the number of "full-time equivalent" (FTE) workers, and that figure was used to calculate industry-specific incidence rates of OHL claims.
• Employers, 2000: The primary data source for identifying the employer population in Project 3 was DLI records for all employers who, at the time of data extraction (2000), reported any hours of employment in the nine target industry categories, whether or not the employer was linked to an OHL claim. The records included: employer identity, contact information, and total hours of reported employment, by risk class. The employer records were linked to the 1992-1998 claim files to determine whether the employer was liable for an OHL claim filed during that period.
E.3 Target industries
Industry-specific statistics for OHL claims were used to select nine "target" industries that broadly represented the observed distribution of those statistics across the 106 industry categories, based on claims filed during 1992-1998.
The industries were categorized on the basis of their prevention index.19 The prevention index (PI) is based on the ranked industry-specific number of claims and the ranked industry-specific incidence rate of claims, and is calculated as the average of those ranks in each industry. An industry with a higher number and higher incidence rate of OHL claims has a lower PI. The PI distribution was divided into quartiles, among prevention index values that were lower than the PI median value (PI <53), and three industries were selected from each of three categories: quartile 1 (ranked PI, 1-13); quartile 2 (14-26); and quartiles 3 and 4 (27-53).
Other selection criteria, based on data in the DLI database, were: (1) >20 employers in the industry with >10 but <500 employees, and a business address in the extended Puget Sound region, making it feasible to drive from UW to a work site and back in one day; and (2) overall diversity in the types of selected industries. Some industries were excluded or assigned low priority for selection: (1) logging, because work sites are transient and far from UW; and (2) construction, because work sites are transient and often involve more than one employer. Road construction was selected for the study because work sites primarily involve one
employer, and the industry has a very high OHL claims incidence rate. The fruit and vegetable processing industry was selected in spite of the distance to work sites, because additional funding became available to cover overnight travel expenses.
The selected target industries and the abbreviations used for them in this report were:
• Road construction RC
• Lumber milling LM
• Pulp and paper production PP
• Heavy gauge metal product manufacturing HM
• Machine shops MS
• Sheet or stamped metal product manufacturing SM • Fruit and vegetable processing FV
(i.e., packing, canning and freezing)
• Printing PR
• Wood product manufacturing WP
The DLI risk classes that defined each industry are listed in Table E1.
E.4 Statistical measures of OHL claims
The number, incidence rate, and prevention index of OHL claims in each industry are shown in Table E2. In most tables in this report, and in the list above, the target industries are listed in order of the industry-specific incidence rate for OHL claims filed in 1997-1998. Although selection of target industries was primarily based on the OHL claims prevention index, the
incidence rate was chosen as the basis for list order of the industries, because this measure showed a very high correlation with the prevention index (see below), and because incidence rates are generally more widely understood by readers than the prevention index.
It is noteworthy that the annual number of OHL claims increased during the 1992-1998 period. Overall, the statewide average incidence rate increased 1.8-fold, from 1.39 claims per 1,000 FTEs per year in 1992-1996 to 2.56 in 1997-1998. The OHL claims filed in the last two years, 1997-1998, represented 45% of all OHL claims filed during the entire seven year period, 1992-1998. Some industries experienced more change than others. However, all of the selected target industries remained in the same prevention index category throughout the 1992-1998 period, except for one, fruit and vegetable processing (Figure E1). The OHL claims incidence rate increased 3.1-fold in that industry, from 1.67 in 1992-1996 to 5.15 in 1997-1998.
There was a high degree of correlation between the three measures of OHL claims within industries, particularly among the target industries. Considering only the claims filed during 1997-1998 and the industries eligible for the study (PI <53), Pearson correlation coefficients were moderately high between the prevention index and number of claims (r= -0.71, p<.001) or incidence rate (r= -0.49, p<.001). In contrast, there was no significant correlation between number of claims and incidence rate (r = 0.20, p=.15). When only the nine target industries were considered, the amount of correlation was even higher, between all three measures: PI-number, r= -0.83 (p=.005); PI-incidence, r= -0.90 (p=.001); and number-incidence, r= 0.76 (p=.02). Correlation coefficients were very similar for the measures of 1992-1998 claims.
These associations reflect influences of the industry selection criteria. The criteria weighed against smaller industries even if they had a high claims incidence rate. For example, pile driving and dredging had an incidence rate of 66.8 (claims per 1000 per year) but "only" 12 claims per year and 90 FTE workers, during 1997-1998. The criteria also weighed against large industries, particularly those with a small number of large employers. For example, aircraft manufacturing had the seventh highest number of OHL claims (n=398) and a prevention index of 39, but had a below-average claims incidence rate (1.92), and predominantly represented one very large employer.
F
PROJECTS 2 AND 3 – Descriptive study of OHL claims, 1984-1998
The claims data obtained for this project were combined with OHL claims data from a separate project (1984-1996) to conduct a descriptive analysis of OHL claims. The results were published in a journal article, included as Appendix 2.
F.1 Results
In summary, the analysis of OHL claims found:
• The number of claims increased 12-fold during 1984-1998. The annual incidence reached 2.6 claims per 1,000 workers statewide, and 70/1,000 in the most impacted industry.
• Most claimants (90%) received permanent partial disability compensation. In 1998, the identifiable medical and disability costs exceeded $57 million dollars.
• Jurisdiction: The increase in claims and the average amount of associated impairment was higher for claims filed with the State Fund than for claims filed with self-insured employers.
• Industry: During 1992-1998, the incidence of OHL claims was highest in primary production and construction industries, averaging nine claims per 1,000 workers per year, and
accounting for half (49.5%) of all OHL claims but only 9.5% of the work force covered by DLI. The manufacturing and service sectors each accounted for about 20% of OHL claims. These statistics may point to industries with the greatest risk for hearing loss, at least in the past, but conceivably still at present.
• Claimant age: The greatest increase occurred with individuals who were older than 65 years of age when they filed their claim. Retirement-age claimants accounted for almost half of the claims filed in 1998. Therefore, a large share of the OHL claims "epidemic" was undoubtedly caused by noise exposures that must have occurred well in the past. However, the increase in claims was evident among individuals who were as young as their mid 30s. Even though these workers' earliest injurious noise exposures may have occurred a decade earlier, it was likely that those noisy situations had not disappeared in that time. Therefore, claims data, at least for pre-retirement age claimants, may have surveillance utility.
• Providers: A small number of providers accounted for a major share of the claims. Among providers who helped file a claim during 1992-1996, 4% of providers accounted for 66% of claims. This finding, and the marketing strategy used by many hearing aid vendors in this state ("If you feel that you have a hearing loss which was caused by a work situation, whether present or in your past history, you may be eligible for compensation...."),
suggested that a shift in reporting practices might account for much of the observed rise in claims. If this reporting bias was differential (i.e., if marketing had been focused on people in particular industries), then the relative differences in industry incidence rates might have a very limited relationship to the past or present disease risk.
F.2 Conclusions
The striking increase in OHL claims was probably due in large part to reporting phenomena unrelated to current work circumstances. However, OHL is probably much more common than usually recognized, and contemporary workers may still face substantial risk for hearing loss.
G
PROJECT 2 – Telephone Survey of OHL Claimants
G.1 MethodsProject 2 was a cross-sectional study – using telephone interviews – of individuals with workers' compensation claims that were filed during 1997-1998 and accepted for OHL.
G.1.1 Sample selection
The study population included all individuals who had a DLI workers' compensation claim that was filed during 1997-1998 and was accepted for OHL (see section E.2).
The potentially eligible claimants were divided into samples:
• Sample A was selected by stratified random sampling from the population of 1997-1998 OHL claimants, excluding claimants who were from one of the target industries and were <65 years old when they filed their claim (see sections E.2 and E.3). The eligible population was categorized by age and jurisdiction (see below), producing eight age-jurisdiction cells, and potential subjects were selected randomly within each cell. Claimants who were selected but not recruited into the study were replaced with another randomly selected claimant until the recruitment goal for each cell was attained. The recruitment goal in each cell approximated the population distribution.
<55 yrs 55.1-65 yrs 65.1-75 yrs >75 yrs
State fund 75 109 111 75 370 (70%)
Self insured 31 40 40 30 141 (30%)
106 (20%) 149 (30%) 151 (30%) 105 (20%) 511
An error occurred during selection of Sample A. The exclusion of claimants from the target industries was inadvertently extended to all claimants in eight of the nine industries (not LM), regardless of age. Consequently, the study sample did not include claimants >65 years old from those eight industries. In view of this, analyses of survey data relative to industry were stratified by subject age (i.e., subjects <65 and >65 were analyzed separately).
• Sample B was selected in similar manner within the nine targeted industry categories, restricted to claimants who were <65 years old when they filed their claim. The recruitment goal of n=30 in each industry category was not achieved in two industries (printing, n=20; wood products manufacturing, n=28). Two extra subjects were recruited in one industry (road construction, n=32), yielding an overall sample size of n=260.
The recruitment goal of 30 subjects from the population of 1997-1998 OHL claimants was not achieved in six target industries (WP, PR, FV, HM, SM, MS). Therefore, eligibility in those industries was expanded to include individuals with an OHL claim filed in the two previous years (1/1/1995 to 12/31/1996). This yielded 39 subjects in total, ranging from 2 (MS) to 11 (WP) in each target industry.
G.1.2 Subject recruitment
Recruitment was conducted by a private research survey contractor, Gilmore Research. Individuals identified as potential subjects were mailed informational material about the study, describing: reasons for the study; why and how the individual was selected; their right to refuse participation without loss of benefits; content and procedures of the survey; steps taken to protect privacy; and investigator contact information. Individuals were then contacted by