warwick.ac.uk/lib-publications
Manuscript version: Author’s Accepted Manuscript
The version presented in WRAP is the author’s accepted manuscript and may differ from the
published version or Version of Record.
Persistent WRAP URL:
http://wrap.warwick.ac.uk/129176
How to cite:
Please refer to published version for the most recent bibliographic citation information.
If a published version is known of, the repository item page linked to above, will contain
details on accessing it.
Copyright and reuse:
The Warwick Research Archive Portal (WRAP) makes this work by researchers of the
University of Warwick available open access under the following conditions.
Copyright © and all moral rights to the version of the paper presented here belong to the
individual author(s) and/or other copyright owners. To the extent reasonable and
practicable the material made available in WRAP has been checked for eligibility before
being made available.
Copies of full items can be used for personal research or study, educational, or not-for-profit
purposes without prior permission or charge. Provided that the authors, title and full
bibliographic details are credited, a hyperlink and/or URL is given for the original metadata
page and the content is not changed in any way.
Publisher’s statement:
Please refer to the repository item page, publisher’s statement section, for further
information.
XXX-X-XXXX-XXXX-X/XX/$XX.00 ©20XX IEEE
Protein Binding Affinity Prediction Using Support
Vector Regression and Interfecial Features
Adiba Yaseen
Department of Computer and information Science
Pakistan Institute of Engineering and applied Science (PIEAS)
Islamabad, pakistan
Wajid Arshad Abbasi
Department of Computer and information Science
Pakistan Institute of Engineering and applied Science (PIEAS)
Islamabad, pakistan
Fayyaz ul Amir Afsar Minhas
Department of Computer and information Science
Pakistan Institute of Engineering and applied Science (PIEAS)
Islamabad, pakistan
Abstract— In understanding biology at the molecular level, analysis of protein interactions and protein binding affinity is a challenge. It is an important problem in computational and structural biology. Experimental measurement of binding affinity in the wet-lab is expensive a nd time consuming. The refore, machine learning approaches are widely used to predict protein interactions and binding affinities by learning from specific properties of existing complexes. In this work, we propose an innovative computational model to predict binding affinities and interaction based on sequence, structural and interface features of the interacting proteins that are robust to binding associated conformational changes.
We modeled the prediction of binding affinity as classification and regression problem with least-squared and support vector regression models using structure and sequence features of proteins. Specifically, we have used the number and composition of interacting residues at protein complexes interface as features and sequence features. We evaluated the performance of o ur prediction models using Affinity Benchmark Dataset version 2.0 which contains a diverse set of both bound and unbound protein complex structures with known binding affinities. We evaluated our regression performance results with root mean square error (RMSE) as well as Spearman and Pearson’s correlation coefficients using a leave-one-out cross-validation protocol. We evaluate classification results with AUC-ROC and AUC -PR. Our results show that Support Vector Regression performs significantly better than other models with a Spearman Correlation coefficient of 0.58, Pearson Correlation score of 0.55 and RMSE of 2.41 using 3 -mer and sequence feature. It is interesting to note that simple features based on 3-mer features a nd the properties of the interface of a protein complex are predictive of its binding affinity. These features, together with support vector regression achieve higher accuracy than existing sequence based methods.
Keywords—S upport vector machine (S VM), Area under the Receiver Operating Characteristic Curve (AUC-ROC), Area under the Precision-Recall Curve (AUC-PR)
I. INT RODUCT ION
Proteins are long linear chains of amino acids that form the basis of life [1]. Protein molecu les do not function in isolation
and most of their functions are e xecuted th rough interactions or binding with other proteins [2].When two proteins bind each other, the strength of their binding is called binding affinity. Binding affin ity is an important para meter in the study of proteins, especially in protein interaction pred iction, drug design, computation protein design, etc. [3]. It also plays a ma jor role in understanding the relationship between structure and function of protein comple xes and biochemica l pathways[4].
There are various experimental and biophysical methods for measure ment of binding a ffinity like Nuclear magnetic resonance spectroscopy, Surface Plasmon Resonance (SPR), pull-down assays, analytical ultracentrifugation and some other methods [5]. Ho wever, these e xperimental methods are not applicable on a large-scale due to high costs in terms of time, money and personnel. An accurate computational model for binding affinity predict ion can solves this issue. As a consequence, binding affinity prediction fro m sequen ce and structure of proteins is an important research problem.
Co mputation methods for binding affin ity predict ion can be divided into three categories: Force field or mo lecula r simu lation based methods, docking and machine learning methods [6]– [8]. Due to their high co mputational cost, e xisting scoring function methods are trained and tested using small datasets and are not applicable on a large scale. Doc king methods are applicable only if proteins do not undergo large changes in their structural conformat ions fro m unbound to bound state. Among computational methods for binding affinity predict ion, machine learn ing methods are particularly suitable due to fle xib le learning function and better generalization performance [9]
methods are more widely applicable. However, development of effect ive prediction models using sequence information alone is d ifficu lt because protein binding a ffinity and interaction depend upon structure and function of proteins. In e xisting literature, the highest accuracy for sequence based binding affin ity prediction has been reported for a machine learning method by Yugandar and Gro miha with a Pearson correlation score of 0.739 to 0.992 for different types of comple xes [14]. Ho wever, the accuracy of their method could not be independently verified [15]. It was also found that their proposed method does not work well on an independent test set. In this paper, we build on these findings and present a mach ine lea rning model using sequence and interface features . The rest of the paper is organized as follows: Section II presents materia ls and methods with co mplete details of the proposed algorith m, section. Results and conclusions are presented in sections III and IV, respectively.
II. MAT ERIALS AND MET HODS
A. Dataset and pre-processing
We evaluated the performance of our prediction models using Affinity Bench mark Dataset (version 2.0) which contains 135 non-redundant and diverse structures of ligand and receptor proteins in both bound and unbound forms with known binding a ffinit ies. The dataset has binding affinities for all these complexes in the form o f free energy ∆G (ranges from -18.58 to -4.29) and disassociation constant (𝐾𝑑) [14].
B. Feature extraction
We model the prediction of binding affin ity as both regression and classification proble ms. Specifica lly, least-squared and support vector regression models are used for regression using structure and sequence features of proteins. These machine learn ing models require mean ingful features to be extracted fro m a g iven comple x to predict binding affinity. We begin the description of our method by introducing various feature extraction schemes used in this work. Following features are e xtracted fro m both ligand and receptor proteins in a given protein comple x and the two individual feature representations are concatenated to form a feature vector for the protein complex.
1) Amino acid composition
Amino acid co mposition of a protein or protein co mple x is a 20-dimensional vector 𝜑𝐴𝐴𝐶(𝒙) which contains the frequency
of occurrence of all 20 natural amino acids in the sequences. 2) BLOSUM-62 Average
In order to capture physiochemica l similarity of a mino ac ids forming a protein or a co mple x, we used the average of the rows of the BLOSUM-62 substitution matrix corresponding to diffe rent a mino acids in the sequence. This results in a 20 -dimensional feature vector 𝜑𝐵𝐿𝑂𝑆 𝑈𝑀(𝒙) for a given sequence
[16].
3) 3-mer Features
In order to capture sequence characteristics, we used the frequency of occurrence of all possible 3-me rs of amino acids in a g iven sequence. This results in an 8000-d imensional feature vector and has been useful in our previous work[17].
4) Propy features
We also e xtracted Propy features for a g iven sequence us ing the Propy package in Python [18]. It e xtracts 13 different types of features fro m a g iven protein sequence such as dipeptide composition, tripeptide composition, pseudo amino acid (PseAAC) co mposition, Moran autocorrelation, norma lized Moreau-Broto autocorrelation, quasi-sequence-order descriptors, co mposition [19]. These features capture both local and global level features in a protein sequence. 5) Interfacial amino acid composition
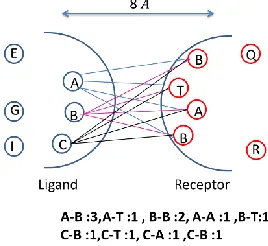
Since p roteinprotein b inding is a consequence of non -covalent interactions between interfacial residues of ligand and receptor proteins, features extracted fro m protein interface can be very useful in predicting binding affinity. For th is purpose, we ca lculated frequency of non-repeating pairs of residues at the interface of a protein co mple x. It is important to note that, unlike prev iously discussed features, these features are extracted from the structure of a protein complex.
Figure 1 Number of Inte racting Interface Features that lie within 8 Angstorm distance between ligand and receptor residues.
Specifically, a 211-d imensional feature vector is fo rmed with each ele ment corresponding to the number of times a specific amino acid pa ir occurs in the interface. Interface residues were identified as residues that occur on the two proteins in a protein comp le x within a d istance of 8 Angstroms fro m each other as shown in the Figure 1.
C. Classification
Initia lly we mode lled b inding affinity predict ion as a classification proble m in wh ich the objective was to classify a given protein comple x into low (below median) or high (above median) a ffinity classes. For this purpose, we used a support vector machine c lassifier (SVM ) with a radial basis function kernel. Given a t rain ing dataset containing 𝑁 protein comple xes each with a feature representation 𝝋(𝑥𝑖) and
known class label 𝑦𝑖 ∈ {−1, +1}, a support vector machine
learns a discriminant function 𝑓(𝒙) = 𝒘𝑇𝝋(𝑥) + 𝑏 by solving
the following optimization problem:
min
𝒘,𝑏,𝝃≥0
1
2||𝒘||² + 𝐶 ∑ 𝜉𝑖
𝑁
𝑖=1
Such that for all 𝑖: 𝑦𝑖(𝒘𝑇𝝋(𝑥𝑖) + 𝑏) ≥ 1 − 𝜉𝑖
[image:3.612.369.503.267.390.2]The hyper-parameter 𝐶 controls the extent of regula rizat ion vs. training error minimization and is selected through cross -validation. An SVM can a lso perform non-linear c lassification through the use of ke rnel functions such as a rad ial basis function [20].
D. Regression Methods
We also modelled the binding affinity predict ion proble m using linear and support vector regression as discussed below. In these formulations, the rea l va lue of binding affin ity is used as the target 𝑦𝑖 for a co mple x instead of binary (low or h igh)
labels as in the classification problem. 1) Linear regression
Linear regression fits least squared linear function to a given data set by solving the following optimization proble m:
𝑚𝑖𝑛𝒘 ,𝑏∑𝑁𝑖=1(𝒘𝑻𝝋(𝑥𝑖) + 𝑏 − 𝑦𝑖)2. We used least squared
regression as a baseline due to its limitations such as sensitivity to outliers, inability to account for non -linear relationships and degradation in performance in high dimensions. Given the feature representation of a tes t protein comple x𝝋(𝑥), its predicted binding affin ity is calcu lated by the function: 𝑓(𝒙) = 𝒘𝑇𝝋(𝑥) + 𝑏.
2) Support vector regression
In order to overcome the limitations of simp le linear regression, we have also used support vector regression (SVR). Due to the use 𝜖-insestive loss instead of least-squared error, SVR is more robust to outliers and can perform non -linear reg ression using kernel functions [21]. Specifica lly, SVR works by solving the following optimization problem:
min
𝒘,𝑏,𝝃≥0
1
2||𝒘||² + 𝐶 ∑ 𝜉𝑖
𝑁
𝑖=1
Such that for all 𝑖:|(𝒘𝑇𝝋(𝑥
𝑖) + 𝑏) − 𝑦𝑖| ≤ 𝜖 + 𝜉𝑖
In this formulat ion, the first term is the regularization term and it controls the capacity of the machine learning mode l whereas the second term performs error min imization. Similar to an SVM c lassifier, the hyper-para meter 𝐶 controls the extent of regularization.
E. Performance Evaluation and Hyper-parameter selection The proposed models were imp le mented in Python 2.7. We have used leave-one-out cross validation (LOOCV) for evaluating our mach ine learn ing models. In LOOCV, a mach ine learning mode l is tra ined on all but one of the comple xes wh ich is used for testing and this procedure is repeated for all co mple xes and then the performance metrics are evaluated by co mparing the predictions to known labe ls or target values. Hyper-parameters (such as 𝐶 or the spread parameter in radia l basis function kernels) a re obtained by nested grid search. In order to evaluate the performance of our classification model, we used the following performance metrics:
Area Under the Receiver Operating Characteristic Curve (AUC-ROC): This metric captures the quality of classification by calculating the area under the curve formed by plotting the true positive rate vs. the false positive rate. A perfect classifie r will have an
AUC-ROC score of 1.0 whereas a rando m classifie r will have AUC-ROC of 0.5.
Area Under the Precision-Recall Curve (AUC-PR): AUC-PR is obtained by calculating the area under the curve obtained by plotting precision of the classifie r vs. recall o r true positive rate. A perfect classifie r will have AUC-PR of 1.0.
The performance of regression models is evaluated using the following metrics:
Root Mean Square Error (RMSE): RMSE ca lculates the average error between the true and predicted binding affinities of test complexes as follows:
𝖱𝖬𝖲𝖤 = √∑ (𝑓(𝑥𝑖) − 𝑦𝑖)
2 𝑁
𝑖=1
𝑁
Pearson Correlation Coefficient: Pearson correlation coeffic ient captures the degree of correspondence between the true and predicted binding affinity values. A value close to 1.0 indicates very good correspondence or linear dependence between the two entities whereas a value of 0.0 indicates no correlation between them.
Spearman Correlation Coefficient: Spearman correlation ca lculates the degree of linear dependence between the ranks of true and predicted binding affinity values of co mple xes. Similar to Pearson correlation coeffic ient, the Spearman corre lation coeffic ient also indicates very good correspondence between true and predicted binding affin ities if its value is close to 1.0.
III. RESULTS ANDDISCUSSION
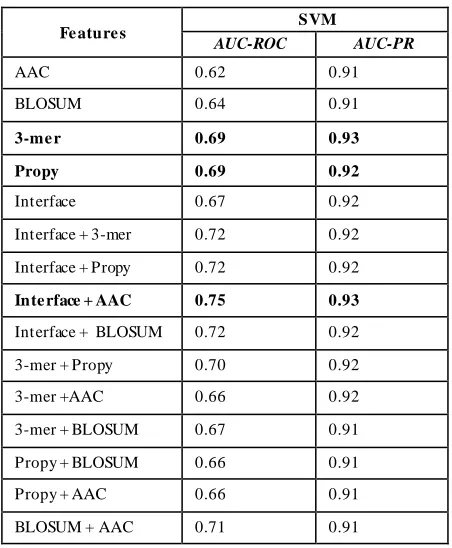
We evaluate the performance of three types of models, SVM, SVR and linear regression using one interface and four sequence features. Table 1 presents (LOOCV) SVM classification results using sequence features amino acid composition (AAC), 3-me r, Propy, BLOSUM and interface features together with various feature combinations . It is interesting to note that the highest accuracy is obtained with 3 -me r features (AUC-ROC: 0.69, AUC-PR: 0.93) which is higher than interface features (AUC-ROC: 0.67, AUC-PR: 0.92). A mong combinations of features, a mino acid composition and interface features given the highest accuracy. However, no significant imp rovement in terms of AUC-PR is recorded.
We evaluate regression model using RM SE and Spearman correlation 𝑆𝑟 and Pearson correlation 𝑃𝑟for linear regression
and SVR. It is clear fro m Table 2 that linear regression is unable to predict binding a ffinity e ffective ly. This is because linear regression is affected by outliers and produces larger errors when the number of feature dimensions is large. SVR results shows that single interface features are most informat ive as expected with RMSE: 2.47, 𝑆𝑟: 0.55 and
𝑃𝑟: 0.52. Although performance of sequence features are
considered more important because they do not require protein comple x structures to be available. 3-me r sequence feature performs better than all other sequence feature with RMSE: 2.55, 𝑆𝑟: 0.50 and 𝑃𝑟: 0.45.
Results in the Table-2 a lso demonstrate that combination of sequence and interfacia l features (interface and 3-mer) performs better than sequence features alone with RMSE: 2.41, 𝑆𝑟: 0.58 and 𝑃𝑟: 0.55. Figure 2 shows these results in the
form of a scatter plot of true vs. predicted binding affinity values. Results of both classification and regression models show that our model performs better using only sequence features than the previous state of the art [12] as reported by [15] which gives a Pearson correlation coefficient of 0.07.
IV. CONCLUSIONS &FUT URE WORK
In this work, we have presented a machine learn ing based methods for protein binding affinity prediction. We have shown that simple sequence based features can be used to predict binding affinity with only a minima l loss in performance in co mparison to using interfacia l a mino ac id composition which requires availab ility of structures of protein comple xes. The proposed model can be used for prediction of binding a ffinit ies of novel protein co mple xes and can be improved by e xtracting evolutionary features. We aim to develop a webserver for the proposed model in the future. The code for the proposed model will also be made public ly available upon acceptance of this paper.
Table 1 Le ave one out C ross validation SVM Re sults
Fe ature s SVM
AUC-ROC AUC-PR
AAC 0.62 0.91
BLOSUM 0.64 0.91
3-me r 0.69 0.93
Propy 0.69 0.92
Interface 0.67 0.92
Interface + 3-mer 0.72 0.92
Interface + Propy 0.72 0.92
Inte rface + AAC 0.75 0.93
Interface + BLOSUM 0.72 0.92
3-mer + Propy 0.70 0.92
3-mer +AAC 0.66 0.92
3-mer + BLOSUM 0.67 0.91
Propy + BLOSUM 0.66 0.91
Propy + AAC 0.66 0.91
BLOSUM + AAC 0.71 0.91
Figure 2 C orrelation be twe e n Expe rime ntal and Pre dicte d Binding Affinity values using Interface and 3-mer feature of sequence. Spearman corre lation of 0.58, Pearson correlation of 0.55 and RMSE of 2.41 we re
re corde d.
Table 2 Le ave one out C ross validation Re gre ssion Re sults
REFERENCES
[1] J. R. Perkins, I. Diboun, B. H. Dessailly, J. G. Lees, and C. Orengo, “Transient Protein-Protein Interactions:
Structural, Functional, and Network Properties,” Structure, vol. 18, no. 10, pp. 1233–1243, Oct. 2010. [2] S. A. Hassan, L. Gracia, G. Vasudevan, and P. J.
Steinbach, “Computer simulation of protein-ligand interactions: challenges and applications,” Methods Mol.
Biol. Clifton NJ, vol. 305, pp. 451–492, 2005. [3] H. Jubb, T. L. Blundell, and D. B. Ascher, “Flexibility
and small pockets at protein–protein interfaces: New insights into druggability,” Prog. Biophys. Mol. Biol.,
vol. 119, no. 1, pp. 2–9, Oct. 2015.
[4] B. Alberts, A. Johnson, J. Lewis, M. Raff, K. Roberts, and P. Walter, Molecular Biology of the Cell, 4th ed.
Garland Science, 2002.
[5] G. Sudha, R. Nussinov, and N. Srinivasan, “An overview of recent advances in structural bioinformatics of protein -protein interactions and a guide to their principles,” Prog.
Biophys. Mol. Biol., vol. 116, no. 2–3, pp. 141–150, Dec. 2014.
Features SVR Linear Regression
RMSE 𝑺𝒓 𝑷𝒓 RMSE 𝑺𝒓 𝑷𝒓
3-me r 2.55 0.50 0.45 - 0.18 0.11
Propy 2.56 0.45 0.44 - -0.11 -0.03 BLOSUM 2.60 0.41 0.39 3.15 0.21 0.21 AAC 2.61 0.39 0.39 3.00 0.25 0.27
Inte rface 2.47 0.55 0.52 - 0.20 0.09
Interface +
3-me r 2.41 0.58 0.55 - 0.002 0.02
Interface+
Propy 2.41 0.57 0.54 - -0.05 -0.10 Interface+
AAC 2.42 0.55 0.53 4.42 0.22 0.23 Interface+
BLOSUM-62
2.49 0.51 0.47 4.43 0.18 0.18
3-mer+
Propy 2.58 0.49 0.45 - -0.03 0.01 3-mer+AAC 2.56 0.49 0.43 3.23 0.31 0.29 3-mer+
[image:5.612.340.531.58.185.2] [image:5.612.329.573.256.483.2] [image:5.612.58.284.393.667.2][6] G. L. Warren et al., “A critical assessment of docking programs and scoring functions,” J. Med. Chem., vol. 49,
no. 20, pp. 5912–5931, Oct. 2006.
[7] J. Qin, M. J. Li, P. Wang, M. Q. Zhang, and J. Wang, “ChIP-Array: combinatory analysis of ChIP-seq/chip and
microarray gene expression data to discover direct/indirect targets of a transcription factor,” Nucleic Acids Res., vol. 39, no. Web Server issue, pp. W430-436,
Jul. 2011.
[8] A. Vangone and A. M. Bonvin, “Contacts -based prediction of binding affinity in protein–protein
complexes,” eLife, vol. 4, p. e07454, Jul. 2015. [9] Q. U. Ain, A. Aleksandrova, F. D. Roessler, and P. J.
Ballester, “Machine-learning scoring functions to improve structure-based binding affinity prediction and virtual screening,” Wiley Interdiscip. Rev. Comput. Mol.
Sci., vol. 5, no. 6, pp. 405–424, Dec. 2015. [10] P. L. Kastritis et al., “A structure-based benchmark for
protein-protein binding affinity,” Protein Sci. Publ. Protein Soc., vol. 20, no. 3, pp. 482–491, Mar. 2011. [11] F. Tian, Y. Lv, and L. Yang, “Structure-based prediction
of protein–protein binding affinity with consideration of allosteric effect,” Amino Acids, vol. 43, no. 2, pp. 531–
543, Aug. 2012.
[12] I. H. Moal, R. Agius, and P. A. Bates, “Protein–protein binding affinity prediction on a diverse set of structures,”
Bioinformatics, vol. 27, no. 21, pp. 3002–3009, Nov. 2011.
[13] A. Erijman, E. Rosenthal, and J. M. Shifman, “How Structure Defines Affinity in Protein-Protein Interactions,” PLoS ONE, vol. 9, no. 10, Oct. 2014.
[14] K. Yugandhar and M. M. Gromiha, “Protein–protein binding affinity prediction from amino acid sequence,”
Bioinformatics, vol. 30, no. 24, pp. 3583–3589, Dec. 2014.
[15] K. Yugandhar and M. M. Gromiha, “Response to the comment on ‘protein‐protein binding affinity prediction from amino acid sequence,’” Bioinformatics, vol. 31, no.
6, pp. 978–978, Mar. 2015.
[16] S. R. Eddy, “Where did the BLOSUM62 alignment score matrix come from?,” Nat. Biotechnol., vol. 22, no. 8, pp.
1035–1036, Aug. 2004.
[17] T. Zhou et al., “Quantitative modeling of transcription factor binding specificities using DNA shape,” Proc. Natl. Acad. Sci. U. S. A., vol. 112, no. 15, pp. 4654–4659,
Apr. 2015.
[18] D.-S. Cao, Q.-S. Xu, and Y.-Z. Liang, “propy: a tool to generate various modes of Chou’s PseAAC,” Bioinformatics, vol. 29, no. 7, pp. 960–962, Apr. 2013. [19] I. Limongelli, S. Marini, and R. Bellazzi, “PaPI: pseudo
amino acid composition to score human protein -coding variants,” BMC Bioinformatics, vol. 16, p. 123, Apr.
2015.
[20] “An overview of statistical learning theory - IEEE Journals & Magazine.” [Online]. Available: http://ieeexplore.ieee.org/abstract/document/788640/.
[Accessed: 01-Oct-2017].
[21] A. J. Smola and B. Schölkopf, “A tutorial on support vector regression,” Stat. Comput., vol. 14, no. 3, pp. 199–