Contents lists available atScienceDirect
Journal of Power Sources
journal homepage:www.elsevier.com/locate/jpowsour
Micro-scale graded electrodes for improved dynamic and cycling
performance of Li-ion batteries
Chuan Cheng
a,∗, Ross Drummond
b, Stephen R. Duncan
b, Patrick S. Grant
aaDepartment of Materials, University of Oxford, Oxford, OX1 3PH, UK bDepartment of Engineering Science, University of Oxford, Oxford, OX1 3PJ, UK
H I G H L I G H T S
•
Composition graded cathodes are fab-ricated by a layer-by-layer spray printing method.•
Micron-resolution distribution of electrode components across thickness is realized.•
C-rate performance and degradation are improved due to gradient material distribution.•
Graded cathodes have lower charge transfer resistance and polarization than uniform.•
This technique is feasible for large area, fast production.G R A P H I C A L A B S T R A C T
A R T I C L E I N F O
Keywords:
Graded electrode
Layer-by-layer spray printing Li-ion battery
Electrode engineering
Electrochemical impedance spectroscopy Solid electrolyte interphase
A B S T R A C T
Li-ion battery cathodes based on LiFePO4are fabricated by a layer-by-layer spray printing method with a continuous through thickness gradient of active material, conductive carbon, and binder. Compared with cathodes with the more usual homogeneous distribution, but with the same average composition, both C-rate and capacity degradation performance of the graded electrodes are significantly improved. For example at 2C, graded cathodes with an optimized material distribution have 15% and 31% higher discharge capacities than sprayed uniform or conventional slurry cast uniform cathodes, and capacity degradation rates are 40–50% slower than uniform cathodes at 2C. The improved performance of graded electrodes is shown to derive from a lower charge transfer resistance and reduced polarization at high C-rates, which suggests a more spatially homogeneous distribution of over-potential that leads to a thinner solid electrolyte interphase formation during cycling and sustains improved C-rate and long-term cycling performance.
1. Introduction
Improvements in the power, energy density, and lifetime of lithium ion batteries are critical for their greater penetration of electric vehicle markets [1]. While much effort continues to be made in searching for new materials, or the chemical modification/decoration of existing materials [2,3], less attention has been paid to radical approaches to
electrode engineering that includes more careful control of the elec-trode structure [4]. Research into these structured electrodes has however strengthened in recent years, including detailed optimization of the fraction of each electrode constituent, layered electrodes, and optimized and/or directional porosity distributions [5–7]. This growing interest is driven by the desire to overcome the conventional constraints placed on electrode microstructural design when manufacture is
https://doi.org/10.1016/j.jpowsour.2018.12.021
Received 14 September 2018; Received in revised form 17 November 2018; Accepted 9 December 2018
∗Corresponding author.
E-mail address:[email protected](C. Cheng).
Journal of Power Sources 413 (2019) 59–67
Available online 15 December 2018
0378-7753/ © 2019 The Authors. Published by Elsevier B.V. This is an open access article under the CC BY license (http://creativecommons.org/licenses/BY/4.0/).
restricted to slurry casting only [5,8], and which include: increasing the fraction of conductive additive to reduce electrode impedance by which sacrifices gravimetric energy density [9]; increasing electrode porosity to facilitate lithium ion transfer by which sacrifices volumetric energy density [10,11]; and using thinner electrodes to improve sluggish ion transfer kinetics by which reduces the overall energy density because it increases the current collector weight fraction [12,13]. When alter-native manufacturing routes are available that allow for control over pore channel direction through the thickness of the electrodes, for ex-ample by magnetic guided templating [6], or magnetic particle align-ment [4], ion transport and electrode kinetics can be significantly im-proved due to the reduced tortuosity of lithium ion pathways [4,6,14,15]. Similar aligned pore channels in electrodes have also been realized by ice-templating [16–18] or co-extrusion followed by sin-tering [14]. However, these improvements rely on relatively sophisti-cated manufacturing techniques that may be, in some cases, limited to the laboratory scale, or too expensive for industrialization.
Graded electrodes with a continuous or layered distribution of mi-crostructure and functionality through the electrode thickness may circumvent conventional microstructural design restrictions, but have been explored primarily only through modelling and simulation due to the lack of corresponding practical manufacture techniques [19–21]. Some predictions have been discouraging for graded porosity elec-trodes, with only marginal forecast improvements in energy density when compared with constant porosity electrodes [20], or only a marginal decrease in electrode resistance [19]. However, simulations have also predicted more uniform overpotential distributions through the electrode thickness [19], and a reduction of ohmic heat generation of up to 14% [21]. If realized in practice, both effects may mitigate battery degradation during long-term cycling. Recent work on two-layer graded porosity cathodes also showed reduced capacity fade of approximately 8% in full-cells and 5% in half-cell configuration over 50 cycles [22].
Graded electrode designs need not be restricted to spatial variations in porosity only. Composition variations may also provide improve-ments in some aspects of electrode and cell performance but are largely unexplored, especially by experiment.
In this paper we use a large area, layer-by-layer spray printing ap-proach [7,23–26] to fabricate compositionally graded lithium-ion bat-tery cathodes based on LiFePO4 that have a micro-scale continuous gradation through the electrode thickness of active material, carbon electron conductive additive, and polymer binder fraction. C-rate per-formance and capacity degradation is compared with equivalent homogeneous electrodes made by spray printing and by industry-standard slurry casting. Critically, all electrodes are fabricated with an identical average composition ratio of active material:carbon:binder of 80:10:10 (wt.%), and had similar thickness, overall porosity, and active material loading per area in order to isolate the effect of material dis-tribution only on electrode performance.
2. Experimental
2.1. Spray printing apparatus
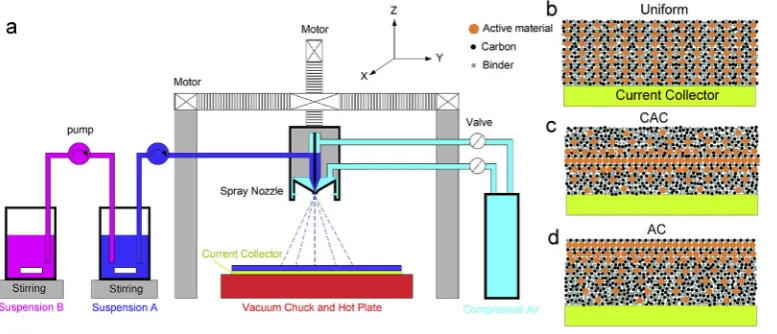
The layer-by-layer spray printing equipment has been developed over several years [7,23–26] and is shown schematically inFig. 1. An industrial spray nozzle was attached to a stiffx-y-zlinear manipulator gantry in which the position and speed of the nozzle was precisely controlled by computer. A mixture of the electrode materials sus-pended/dissolved in a liquid (suspension A) was pumped into the nozzle at a controlled volumetricflow rate by a peristaltic pump. The suspension was continuously atomized by compressed air (e.g. 0.4 bar) and the resulting spray of suspension droplets deposited as a well-fo-cused spray cone onto a metallic foil current collector placed on a constant temperature heated vacuum chuck at typically 140 °C so that the liquid fraction of the spray evaporated almost instantaneously. The
electrode formed incrementally layer-by-layer with each pass, or cycle, of the spray nozzle.
2.2. Suspension preparation
The gradient distribution of materials within the electrode was realized by continuously changing the composition of suspension A, by mixing it with suspension B as deposition proceeded.Table 1shows the experimental conditions for seven different types of LiFePO4-based cathodes with different material distributions, where LiFePO4 and Super-P carbon black were obtained from MTI (USA); PVDF (poly-vinylidene fluoride, Mw∼534,000) binder, NMP (1-Methyl-2-pyrroli-dinone,≥99.0%), and IPA (2-propanol, 99.5%) were obtained from Sigma-Aldrich (UK). LiFePO4 was chosen as a widely available ex-emplar or “model” material with generic insights on the effects of grading translatable to any similar cathode or anode material.
PVDF wasfirst dissolved in NMP with magnetic stirring; in parallel, LiFePO4and Super-P were mixed with IPA by ball milling at 300 rpm for 1 h, and then the two liquids mixed together with stirring. If the suspension did not contain PVDF, only ball milling of the solid material in a mixture of NMP and IPA was conducted. The suspensions were further dispersed by high energy ultrasonication at 20 Hz and 750 W for 2 h (Vibra-cell, Sonics Inc., USA) and then vigorously stirred by mag-netic stirring at∼800 rpm overnight.
2.3. Cathode preparation
For each type of spray printed cathode listed inTable 1the total weight of solid material within the suspension (suspension A + sus-pension B) wasfixed at 3 g, and the overall weight ratios were kept constant at LiFePO4(AM):Super-P (Carbon):PVDF (Binder) = 80:10:10. The spray nozzle moved in a zig-zag trajectory over the current col-lector and the active material (LiFePO4) loading for different electrodes was approximately constant at 11.4 ± 1.8 mg cm−2, measured by a balance (accuracy 0.1 mg, Sartorius, Germany).
For example with reference toTable 1, to fabricate the CAC elec-trode, which has an active-material-rich region sandwiched by two carbon-rich regions, suspension A in spray step 1 was pumped into the spray nozzle; at the same time, suspension B, in spray step 1, was pumped into suspension A. Due to the difference in weight ratios of the two suspensions, the active material loading in suspension A gradually increased from zero towards 100 wt % as time increased and the frac-tion of suspension B in A increased, while both the carbon and binder loading decreased from 50 wt% towards zero. Because the overall composition of each sprayed layer related to the instantaneous com-position of suspension A, a CA-type graded electrode was realized. Then, suspensions A and B were switched in spray step 2 (seeTable 1) so that an AC-type graded electrode formed progressively on top of the CA type electrode, resulting infinal CAC-type electrode. As an example, energy-dispersive X-ray spectroscopy (EDX) element mapping of an as-sprayed AC-type electrode was shown inFig. S1, which confirmed the gradient materials distribution through the thickness of the electrode.
2.4. Microscopy characterization
The cross-section of electrodes was observed in a Carl Zeiss Merlin high resolutionfield emission scanning electron microscope (FE-SEM) combined with an Oxford Instruments Xmax 150 EDX detector. EDX line scan were performed across cross-sections in order to obtain an indication of key element distributions through the thickness. After cycling, cathodes were recovered by dissembling the half-cells in a glove box, washed in DMC (dimethyl carbonate) and then dried in glove box. Transmission electron microscopy (TEM) samples were prepared by re-dispersing the cycled cathode material in NMP by ultrasonication to dissolve the PVDF binder, and thefiltered solid was then dispersed in ethanol. A TEM grid covered with a holely carbonfilm was dipped into this suspension, dried in glove box, and then sealed in a glass tube. The coated TEM grid was transferred to a TEM sample holder in air within minutes and the cathode particulate examined in a JEOL JEM-2100 TEM. Similarly, X-ray Photoelectron Spectroscopy (XPS) was performed on the cycled cathode particulate in a K-Alpha XPS system (Thermo Scientific). XPS samples were prepared byfixing the recovered cathodes on a sample holder in a glove box, sealed into a vacuum lock, and then transferred to the XPS system without air contamination. Quantitative analysis of XPS data was performed by CasaXPS (Casa Software, Ltd).
2.5. Cell preparation and testing
CR2032 half-cells were assembled with the cathode working against Li foil with glassfibre as a separator, soaked in 1M LiPF6in ethylene carbonate and dimethyl carbonate (EC/DMC = 50/50 v/v, Sigma-Aldrich, UK) electrolyte. Before assembling, all cell components were stored in a vacuum oven at 60 °C in a Arfilled glove box for more than 5 h to reduce residual moisture and then assembled within the same
glove box. As-assembled battery cells were aged for 6–12 h before testing. Coin cells were investigated using an Arbin battery cycler (Arbin Instruments, USA, Models: BT-G-25 and IBT21084LC) in the potential range 2.5–4.2 V vs. Li/Li+
at room temperature at various C-rates from 0.1 to 7C. For long-term cycling, pristine cells werefirst cycled at 0.1C for 5 and 3 cycles before repeated cycling at 0.2 and 2C, respectively. Here, 0.1C corresponded to 17 mA g−1of active material. Within each cycle, charging and discharging were performed at the same C-rate. Electrochemical impedance spectroscopy (EIS) was per-formed at open circuit voltage after discharging to 2.5 V and aging of approximately 12 h, with a 10 mV sine wave perturbation in the fre-quency range 1 MHz down to 0.01 Hz. All measured EIS data werefitted with an equivalent circuit in order to estimate charge transfer resistance and other parameters [27–29].
3. Results and discussion
A MATLAB®code was developed to mimic the spraying process and to predict the weight ratio of active material:carbon:binder through the thickness of electrodes by using values in Table 1 as input (see Supplementary Data). The program is suitable for any composition ratio in the suspensions, pumping rates, volumes, and etc., and was used to ensure the overall ratio of constituents remained constant.
[image:3.595.40.429.57.224.2]Fig. 2a shows the ideal, calculated material distribution of four ty-pical gradient electrodes: uniform, CAC, AC, and CA, where C and A indicates carbon-rich and active materials-rich regions, and the se-quence of C and A indicates the“stacking”order towards the current collector. For instance, the CAC electrode means the active material-rich region was sandwiched by two carbon-material-rich regions, which gave a convex parabola distribution of active materials and a concave parabola distribution of carbon and binder across the thickness (Fig. 2a, red line).
[image:3.595.38.557.272.408.2]Fig. 1.Illustration of an experimental setup for the fabrication of graded composition electrodes. (a) Experimental arrangement based on a layer-by-layer spray printing approach, featuring the use of two suspensions simultaneously in series with in-dependently controlled pumps to pro-duce fine-scale control of the graded profile. (b–d) Schematic illustration of three types of sprayed electrodes with uniform, CAC gradation and AC gra-dation, respectively, through the thickness of the electrodes from bottom (next to the current collector) to top (next to the separator), where A de-notes the active material-rich region and C denotes carbon black-rich region.
Table 1
Experimental conditions for electrodes with different material distributions. Active material (AM) is LiFePO4, carbon refers to Super-P conductivity enhancer, binder is PVDF, NPM is 1-Methyl-2-pyrrolidinone, and IPA is 2-propanol.
Cathode type Spray step Suspension A (pumping into spray nozzle) Suspension B (pumping into suspension A)
AM (g) Carbon (g) Binder (g) NMP (mL) IPA (mL)
Pump rate (mL min−1)
AM (g) Carbon (g) Binder (g) NMP (mL)
IPA (mL)
Pump rate (mL min−1)
CAC 1 0 0.150 0.150 5 95 9.0 1.200 0 0 5 95 4.5
2 1.200 0 0 5 95 9.0 0 0.150 0.150 5 95 4.5
CAC@ 1 0.240 0.120 0.075 5 95 9.0 0.960 0.030 0.075 5 95 4.5
2 0.960 0.03 0.075 5 95 9.0 0.240 0.120 0.075 5 95 4.5
AC 1 0 0.300 0.300 10 190 9.0 2.400 0 0 10 190 4.5
AC@ 1 0.480 0.240 0.150 10 190 9.0 1.920 0.060 0.150 10 190 4.5
CA 1 1.920 0.060 0.150 10 190 9.0 0.480 0.240 0.150 10 190 4.5
Uniform 1 2.4 0.3 0.3 10 190 9.0
AC indicates that the weight ratio of active material decreases con-tinuously from 100% at the electrode/separator interface to 0% at the electrode/Al interface; while the carbon (the same as for the binder) increases from 0% to 50% (Fig. 2a, green line). The CA electrode had the inverse of the material distribution of the AC electrode.
Fig. 2b–e shows SEM cross-section views of the four spray printed electrodes corresponding to the ideal profiles inFig. 2a.Fig. 2f–i shows the corresponding carbon and active material (LiFePO4, indicated by the Fe EDX signal) distribution across the electrodes along the yellow lines. Here, the variation of binder fraction followed that of the carbon due to the identical weight loading in the suspensions (seeTable 1). By comparingFig. 2f–i withFig. 2a, the spray printed electrodes showed good qualitative agreement of actual with intended composition var-iation, noting that quantitative weight ratio measurement, especially for carbon, was judged insufficiently accurate by EDX. The cross-section and EDX line scans confirmed that the electrodes were∼100μm thick after calendaring and consistent with measurement by micrometer. The thickness of CA electrode was slightly lower because it partially spalled from the current collector during SEM sample preparation with a small
part of the electrode remaining attached to the current collector. A fuller view of the cracked CA electrode is given inFig. S2, and is dis-cussed later.
Using conventional electrode fabrication methods, such as widely used slurry casting, the continuous micro-scale variations in local composition, shown in Fig. 2, are impossible. So far, only two-layer (porosity graded) electrodes have been fabricated by multi-steps of slurry casting/drying/calendaring/2nd slurry casting/drying/ca-lendaring [22], with different porosities in each layer but the same composition ratio. The complexity of this type of iterative casting method increases with the number of discrete layers, as will the number of distinct interfaces between layers, which may lead to cracking during long term cycling; there is also a minimum thickness of each later that can be reproducibly slurry cast, typically > 10μm, whereas the layer thickness in spray printing is determined only by the active particle size, allowing relativelyfine-scale composition variations.
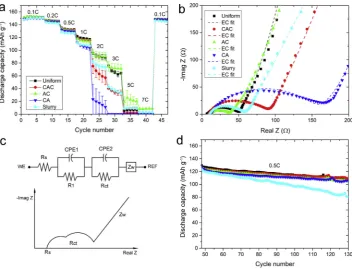
[image:4.595.37.386.51.530.2]The C-rate performance of five types of pristine LiFePO4-based cathode is shown inFig. 3. The cells werefirst subject to 7 charging/ discharging cycles at 0.1C and current 17 mA g−1, and then
experienced 5 cycles at each of the subsequent C-rates. All had similar discharge capacities of approximately 150 mAh g−1at a low C-rate of 0.1C, which was reasonable since they contained the same amount of active material and capacity should be controlled only by the intrinsic capacity of LiFePO4at low rate [30], and not by the electrode structure. However, as the C-rate increased, the electrode structure began to in-fluence the deliverable capacity [31], including a growing influence of charge transfer resistance for redox reactions and impedance to ion transport. For example, at 3C, the highest-to-lowest ranking of elec-trode capacity was: AC (72.4 mAh g−1) > uniform (67.1 mAh g−1) > slurry (40.5 mAh g−1) > CAC (35.5 mAh g−1) > CA (0 mAh
g−1), which was consistent with the lowest-to-highest charge transfer resistance (Rct) measured after C-rate testing: AC (25.5Ω) < uniform (41.5Ω) < slurry (45.4Ω) < CAC (77.3Ω) < CA (143.2Ω). Here, Rctwas obtained byfitting the equivalent circuit (EC) shown inFig. 3c to the impedance data, with the best-fit curves shown as dash lines in Fig. 3b andfitting parameters given inTable S1. Other equivalent cir-cuits were considered, such as assuming the Warburg impedance (Zw) was arranged in parallel with constant phase element (CPE2) and in series with charge transfer resistance Rct[32]; however, thefit was not improved, and the physical interpretation of more complex equivalent circuits more uncertain.
Fig. 3.Electrochemical characterization of graded electrodes. (a) C-rate performance of pristine LiFePO4-based half-cells with gradient and uniform material distribution corresponding toFig. 2. (b) Electrochemical impedance spec-troscopy (EIS) for one group of cells after the C-rate testing shown in (a). Solid symbols were experimental measurements and dash lines were
fitted with equivalent circuit (ECfit) in (c) with
[image:5.595.39.392.54.323.2]fitting parameters given in Table S1. (d) The other group of cells were continuously cycled at 0.5C after testing in (a).
[image:5.595.41.392.472.740.2]The two semi-circles illustrated in Fig. 3c correspond to the two time constants (τ= RC) that represent the time required to charge the capacitor having the effective capacity of the constant phase element CPE. Thefirst semi-circle is usually attributed to the impedance at the active particle surface and the second semi-circle usually attributed to the charge transfer of redox reactions [27–29,33]. Often in experiment, as here, the two semi-circles overlap to some extent and ECfitting is necessary in order to extract an estimate of Rct.
Compared with the slurry cast electrodes, the spray printed elec-trodes had a lower rate of capacity degradation during long term cy-cling. As shown inFig. 3d at 0.5C, the four sprayed electrodes had a relatively stable degradation of 0.25 mAh g−1 per cycle and similar discharging capacities (2–3% difference) while the slurry cast electrode had a capacity degradation of 0.56 mAh g−1per cycle i.e. approxi-mately twice that of spray printed electrodes. This increased stability was in part attributed to the improved mixing of the constituent ma-terials within each sprayed micro-layer, consistent with in our previous work on non-graded spray printed electrodes [7,24]. For example, the liquid fraction in a slurry cast suspension is normally less than 50 wt% in order to give the optimum viscosity for coating and to promote a high peeling strength [34]; in contrast, spray printing used more dilute formulations (see Table 1) that allow stable atomization but also fa-cilitate suspension homogenization by high-energy ultrasonication. In addition, the suspension atomization and droplet deposition steps also impart significant shear strain that may help to break up any agglom-erates.
Fig. 3provides proof-of-concept that grading may offer some ben-efits to electrode performance, and was used a starting point for a subsequent iteration of grading optimization based on the trend data. First,Fig. 3a and b suggested that a carbon-rich region at the current collector, rather than an active material-rich region, reduced the charge transfer resistance [24], with was also inversely proportional to capa-city retention at high C-rates (≥1C) e.g. Rctof electrode AC was∼20% that of electrode CA (Fig. 3b) and C-rate performance was dramatically better. Second, each of the gradient electrodes inFig. 3had a region of ultra-high fraction of active material, close to or equal to 100 wt%, which was unlikely to be optimum due to a lack of electrical con-ductivity. Therefore, accounting for these two effects, two other types of gradient electrodes with smooth variations of constituent materials were then designed, both with a carbon-rich region close to the current collector and maximum local fraction of active material of 90%, termed CAC@ and AC@ inTable 1. The target, nominal composition variations for these electrodes are shown inFig. 4a and b, with the previous CAC and AC electrodes also shown for comparison. Once again, the overall relative fraction of all materials was constant across all electrodes.
The C-rate performance of pristine CAC@ and AC@ half-cells is shown inFig. 4c. Compared with the previous graded electrodes (CAC and AC) there were significant capacity improvements at C-rates≥2C. For example, at 5C, the discharge capacity of CAC@ was 75 mAh g−1 while CAC had no discharge capacity; the discharge capacity of AC@ was 58 mAh g−1while AC had a discharge capacity of only 22 mAh g−1. Compared with AC@/AC, CAC@/CAC showed the stronger im-provement, which was mainly due to the initially sluggish performance of the CAC arrangement.
As previously mentioned, the CAC electrode easily split into two layers during SEM sample preparation because the middle region had no binder (∼100 wt% active material); in contrast, the middle region of CAC@ had 7 wt% binder (Fig. 4a) that was sufficient to maintain electrode integrity. As shown inFig. 4d, the trend of increasing C-rate performance was again consistent with a reduction in charge transfer resistance: Rctof CAC@ (19.7Ω) was smaller than CAC (72.8Ω); si-milarly, Rctof AC@ (16.2Ω) was smaller than AC (25.5Ω).
Fig. 5a summarizes the C-rate performance of the various elec-trodes. At high C-rates (≥2C), much higher capacity retention was realized in CAC@ and AC@ compared with uniform and slurry cast cathodes while at low C-rates (≤0.5C), graded electrode discharge
capacities were almost the same as uniform electrodes, i.e. the gradient material distribution did not sacrifice energy density to achieve higher power density. Specifically, the discharge capacities of the CAC@ cathode increased 15% and 31% at 2C, and 38% and 128% at 3C compared with spray printed uniform and slurry cast equivalent re-spectively. Similarly, the discharge capacity of the AC@ cathode in-creased 9% and 25% at 2C, and 27% and 110% compared with spray printed uniform and slurry cast uniform cathodes respectively. The discharge capacity at 3C was inversely proportional to the charge transfer resistance Rct (Fig. 5b, red curve). The time constant
τct= RctCeff(Fig. 5b blue) that expresses the time required for charge transfer during redox reactions, was also inversely proportional to the discharge capacity at 3C.
Overall, Fig. 5 demonstrates how charge transfer related C-rate performance can be tuned by arranging the materials distribution in different ways at the micro-scale across the thickness of electrode. Surprisingly, simply by arranging identical materials in gradient fashion, capacity can be increased by nearly 100% over a homo-geneous, random mixture. Note that in the manufacture of the slurry cast electrodes, the ball milling time and mixing sequence [9,35], were probably not fully optimised and more time spent in this respect may narrow the performance gap with the spray printed uniform electrodes. However, by the same token, the gradient electrodes provides many degrees of freedom for microstructural optimization not yet fully ex-plored, which may increase their performance even further.
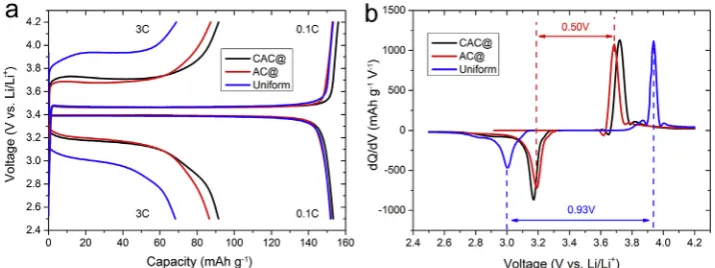
Fig. 6a shows that the charge-discharge curves for both graded and uniform cathodes were almost the same at 0.1C. When the C-rate in-creased to 3C, the mean charge voltage inin-creased and the mean dis-charge voltage decreased for all cathodes (polarization increased); however, while the polarization of the uniform cathode increased to 0.93 V the polarization of both the graded cathodes increased to only 0.50 V (Fig. 6b). Polarization here refers to the difference between charge and discharge voltages [36,37]. The larger polarization for uniform cathodes most likely indicated that a higher activation over-potential was required for Li+intercalation/deintercalation reactions, which in turn can increase the rate of side reactions, such as increasing the thickness of solid electrolyte interphase (SEI) [22]. This would be consistent with the measured increase in charge transfer resistance and capacity fading at high C-rates (Fig. 5b at 3C). Thus it is suggested that certain graded material distributions may contribute to a more uniform distribution of overpotential across the thickness of the electrode, and it is this overpotential homogenization that underpins the observed im-proved charge storage properties. This interpretation is consistent with recent simulation studies of the optimization of overpotential dis-tribution in multi-layered graded electrodes [19].
For 90 repeating cycles at 0.2C,Fig. 7a shows that the CAC@ graded cathode had the slowest average capacity degradation rate of 0.22 mAh g−1per cycle, while AC@, CAC, uniform spray printed, and slurry cast cathodes showed similar degradation rates of 0.26–0.29 mAh g−1per cycle. The degradation rate was increased slightly to 0.33 and 0.36 mAh g−1for CA and AC graded cathodes. When the charging/discharging rate increased ten times to 2C,Fig. 7b shows that both CAC@ and AC@ graded cathodes had the slowest capacity degradation rate of 0.24–0.25 mAh g−1
per cycle, compared with the uniform spray printed cathode of 0.41 mAh g−1per cycle, and slurry cast cathode of 0.48 mAh g−1per cycle. The AC, CAC, and CA graded cathodes had average de-gradation rates of 0.51, 0.58, and 1.0 mAh g−1per cycle at 2C, re-spectively. From slow to fast charging/discharging rates (0.2C–2C), CAC@ and AC@ cathodes maintained similar capacity degradation rates below 0.3 mAh g−1per cycle for 90 cycles, and were the best performing.
(< 0.5C) which was determined only by the theoretical capacity and fraction of the active material. However, considering practical appli-cations, such as electric vehicles that require frequent charging/dis-charging in short time (i.e. at high C-rates), the advantage of gradient electrodes became significant e.g. less than half the rate of capacity degradation (Figs. 7b) and 31% higher capacity (Fig. 5a) compared with slurry cast electrodes at 2C.
According toFigs. 5–7, the optimized graded electrodes (e.g. AC@) have a superior C-rate, polarization, and cycling performance to the uniform electrodes. According to simulation, porosity-graded electrodes may have a more homogeneous over-potential distribution across the electrode thickness [19], which can restrict or slow down side reactions at the electrolyte/active material interface, leading to a thinner solid electrolyte interphase (SEI) formation and supporting improved elec-trochemical performance [22]. Although these simulations focused on porosity-graded electrodes, which is different from the composition-graded electrodes presented here, the idea of a more homogeneous over-potential distribution supporting improved performance may be common for both graded cases.
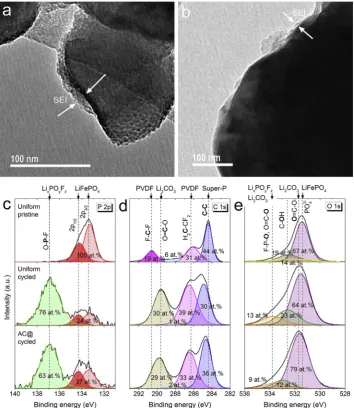
To explore this hypothesis, transmission electron microscopy (TEM) images of the cycled LiFePO4particles collected from uniform and AC@ graded cathodes after the cycling regime shown inFig. 7a are shown in Fig. 8a and b, respectively. The average SEI layer thickness on active particles from the uniform electrode was 11.5 ± 1.8 nm and 6.7 ± 2.8 nm for particles from the AC@ graded electrode.
Although the SEI thicknesses differences support the hypothesis, the differences were small and it was not possible to be sure from which part of the cathode the particulates came from, and the SEI layer thickness through the electrode thickness may be different [39]. Therefore, X-ray photoelectron spectra (XPS) were also obtained from the surface only (nearest the separator) of the same cycled uniform and AC@ graded cathodes, which are shown inFig. 8c and d. Because XPS has only a restricted depth penetration [41], the detection region was approximately the same for both electrodes. The P 2p XPS spectra in Fig. 8c shows that the pristine uniform cathode contained only 2p3/2
(133.4 eV) and 2p1/2 (134.3 eV) doublets that were attributed to phosphate (i.e. LiFePO4active material). After cycling, an additional strong peak appeared in both uniform and AC@ cathodes at a binding energy∼136.9 eV, which was assigned tofluorophosphates (LixPOyFz) resulting from the degradation of the LiPF6electrolyte and SEI forma-tion [40]. Using peak deconvolution, the ratio of LixPOyFz: LiFePO4 peak area was 3.2 for the cycled uniform cathode and 1.7 for the cycled AC@ cathode. This difference indicated a thicker SEI layer on LiFePO4 in the uniform cathode. Similarly inFig. 8d, the C 1s XPS spectra shows that both cycled uniform and AC@ graded cathodes produced Li2CO3 and semi-organic carbonates with a characteristic OeC]O bond at ∼289.6 eV i.e. typical components of a SEI layer [39]. Using peak de-convolution and integration and using the CeC chemical bond as a reference (∼284 eV), the O]CeO:CeC peak area ratios were 1.0 and 0.8 for cycled uniform and AC@ cathodes respectively. InFig. 8e, the O 1s XPS spectra confirmed that both uniform and graded cathodes pro-duced LixPOyFz and Li2CO3 after cycling (both the FePeO bond in LixPOyFzand the O]CeO bond in Li2CO3contributed to the peak at ∼533.8 eV, although organic carbonates may be also included [39]). FromFig. 8e, 13 at.% of all the O in the spectrum contributed to this peak in the uniform cathode, compared with 9 at.% for the AC@ graded cathode. In summary, P, C and O spectra all inferred SEI formation after cycling and all suggested a thicker SEI layer on the uniform cathode, consistent with the TEM observations shown inFig. 8a and b.
[image:7.595.37.409.57.185.2]While recognizing the TEM and XPS data provide support rather than conclusive evidence, when synthesised with the prior modelling and simulation work and the impedance data shown previously, the improved performance of the graded electrode can be understood as follows. The graded material distribution gives rise to a more homo-genized over-potential distribution through the electrode thickness, which leads to less pronounced side-reactions at the active material/ electrolyte interface and leads to thinner SEI layer formation. The re-latively thin SEI layer supports and sustains throughout cycling a comparatively high electrode electric and ionic conductivity that re-duces the electrode overall charge transfer resistance, particularly
Fig. 5.Comparison of various cathodes with the same average weight ratio (active material: carbon: binder = 80: 10: 10 wt%). (a) C-rate performance. (b) Discharge capacities at 3C (left), the charge transfer resistance Rctof the corresponding cells measured after C-rate testing (right, red), and time constant (τct= RctCeff) for charge transfer (right, blue), where Ceffis the effective capacity of the con-stant phase element, CPE2, in the equivalent circuit (Fig. 3c). (For interpretation of the re-ferences to colour in this figure legend, the reader is referred to the Web version of this ar-ticle.)
[image:7.595.119.477.583.717.2]improving the charge/discharge kinetics.
4. Conclusions
Graded composition cathodes based on LiFePO4 that had a
[image:8.595.119.476.57.193.2]continuous micro-scale variation in the weight ratios of active materi-al:carbon:binder across the electrode thickness were fabricated using a layer-by-layer spray printing technique. By arranging the materials distribution while keeping the average material loading the same as uniform cathodes, both C-rate performance and capacity degradation
Fig. 7.Cycling performance of various types of LiFePO4-based cathodes at (a) 0.2C and (b) 2C, respectively.
[image:8.595.121.476.290.699.2]during long term cycling were improved in this model LiFePO4-based cathode system. In terms of C-rate performance, the discharge capa-cities of CAC@ graded cathodes increased 15% and 38% at 2C and 3C compared with spray printed uniform cathodes. Similarly, the discharge capacities of AC@ gradient cathodes increased 9% and 27% at 2C and 3C compared with spray printed uniform cathodes. These differences were even larger when compared with conventional slurry cast cath-odes. The improvement in C-rate performance was due to much re-duced (∼50%) charge transfer resistance in graded electrodes. In terms of capacity degradation during cycling, CAC@ and AC@ graded cath-odes had similar low capacity degradation rates (0.22–0.28 mAh g−1 per cycle) at both 0.2C and 2C, which were slightly reduced compared with uniform cathodes at 0.2C, but significantly smaller (40–50%) than uniform cathodes at 2C (0.41–0.48 mAh g−1per cycle). Consistent with modelling studies in the literature and our TEM and XPS investigations, the performance improvements were suggested to derive from (i) re-duced interfacial resistance at the cathode/current collector interface due to a local carbon-rich region, and (ii) a reduction in polarization and an improved spatial homogenization of overpotential that leads to a thinner SEI layer formation during cycling and sustains improved C-rate and long-term cycling performance. Thesefindings should be ap-plicable to other types of cathode or anode active materials. To de-monstrate the feasibility for large area faster deposition more attuned to the needs of industry, we have established a capability for multi-spray deposition in controlled atmosphere (Fig. S3).
Acknowledgments
This work was supported by the UK Engineering and Physical Sciences Research Council (EPSRC) through grant EP/P005411/1 -“Structured electrodes for improved energy storage”. We would like to thank Philip Holdway for XPS characterization and helpful discussions.
Appendix A. Supplementary data
Supplementary data to this article can be found online athttps:// doi.org/10.1016/j.jpowsour.2018.12.021.
References
[1] J. Lu, Z.H. Chen, Z.F. Ma, F. Pan, L.A. Curtiss, K. Amine, The role of nanotechnology in the development of battery materials for electric vehicles, Nat. Nanotechnol. 11 (2016) 1031–1038.
[2] M.S. Whittingham, Ultimate limits to intercalation reactions for lithium batteries, Chem. Rev. 114 (2014) 11414–11443.
[3] S.T. Myung, F. Maglia, K.J. Park, C.S. Yoon, P. Lamp, S.J. Kim, Y.K. Sun, Nickel-rich layered cathode materials for automotive lithium-ion batteries: achievements and perspectives, ACS Energy Lett. 2 (2017) 196–223.
[4] J. Billaud, F. Bouville, T. Magrini, C. Villevieille, A.R. Studart, Magnetically aligned graphite electrodes for high-rate performance Li-ion batteries, Nat. Energy 1 (2016) 16097-1-6.
[5] J.L. Li, Z.J. Du, R.E. Ruther, S.J. An, L.A. David, K. Hays, M. Wood, N.D. Phillip, Y.P. Sheng, C.Y. Mao, S. Kalnaus, C. Daniel, D.L. Wood, Toward low-cost, high-energy density, and high-power density lithium-ion batteries, JOM (J. Occup. Med.) 69 (2017) 1484–1496.
[6] J.S. Sander, R.M. Erb, L. Li, A. Gurijala, Y.M. Chiang, High-performance battery electrodes via magnetic templating, Nat. Energy 1 (2016) 16099-1-6. [7] C. Huang, N.P. Young, J. Zhang, H.J. Snaith, P.S. Grant, A two layer electrode
structure for improved Li Ion diffusion and volumetric capacity in Li Ion batteries, Nanomater. Energy 31 (2017) 377–385.
[8] P.V. Braun, J. Cho, J.H. Pikul, W.P. King, H.G. Zhang, High power rechargeable batteries, Curr. Opin. Solid State Mater. Sci. 16 (2012) 186–198.
[9] H.H. Zheng, R.Z. Yang, G. Liu, X.Y. Song, V.S. Battaglia, Cooperation between ac-tive material, polymeric binder and conducac-tive carbon addiac-tive in lithium ion battery cathode, J. Phys. Chem. C 116 (2012) 4875–4882.
[10] L. Mahmoud, B.S. Lalia, R. Hashaikeh, Carbon nanostructures modified LiFePO4 cathodes for lithium ion battery applications: optimized porosity and composition, Mater. Res. Express 3 (2016) 124008-124001-124016.
[11] B. Suthar, P.W.C. Northrop, D. Rife, V.R. Subramanian, Effect of porosity, thickness and tortuosity on capacity fade of anode, J. Electrochem. Soc. 162 (2015) A1708–A1717.
[12] M. Singh, J. Kaiser, H. Hahn, Thick electrodes for high energy lithium ion batteries,
J. Electrochem. Soc. 162 (2015) A1196–A1201.
[13] H.H. Zheng, J. Li, X.Y. Song, G. Liu, V.S. Battaglia, A comprehensive understanding of electrode thickness effects on the electrochemical performances of Li-ion battery cathodes, Electrochim. Acta 71 (2012) 258–265.
[14] C.J. Bae, C.K. Erdonmez, J.W. Halloran, Y.M. Chiang, Design of battery electrodes with dual-scale porosity to minimize tortuosity and maximize performance, Adv. Mater. 25 (2013) 1254–1258.
[15] V.P. Nemani, S.J. Harris, K.C. Smith, Design of bi-tortuous, anisotropic graphite anodes for fast ion-transport in Li-ion batteries, J. Electrochem. Soc. 162 (2015) A1415–A1423.
[16] S. Zavareh, A. Hilger, K. Hirselandt, O. Goerke, I. Manke, J. Banhart, A. Gurlo, Fabrication of cellular and lamellar LiFePO4/C cathodes for Li-ion batteries by unidirectional freeze-casting method, J. Ceram. Soc. Jpn. 124 (2016) 1067–1071. [17] S. E39-Behr, R. Amin, Y.M. Chiang, A.P. Tomsia, Highly-structured, additive-free
lithium-ion cathodes by Freeze-Casting Technology, Process Eng. 92 (2015) E39–E43.
[18] C. Huang, P.S. Grant, Coral-like directional porosity lithium ion battery cathodes by ice templating, J. Mater. Chem. 6 (2018) 14689–14699.
[19] Y.B. Qi, T.J. Jang, V. Ramadesigan, D.T. Schwartz, V.R. Subramanian, Is there a benefit in employing graded electrodes for lithium-ion batteries? J. Electrochem. Soc. 164 (2017) A3196–A3207.
[20] Y.L. Dai, V. Srinivasan, On graded electrode porosity as a design tool for improving the energy density of batteries, J. Electrochem. Soc. 163 (2016) A406–A416. [21] E. Hosseinzadeh, J. Marco, P. Jennings, The impact of multi-layered porosity
dis-tribution on the performance of a lithium ion battery, Appl. Math. Model. 61 (2018) 107–123.
[22] L. Liu, P.J. Guan, C.H. Liu, Experimental and simulation investigations of porosity graded cathodes in mitigating battery degradation of high voltage lithium-ion batteries, J. Electrochem. Soc. 164 (2017) A3163–A3173.
[23] C. Huang, N.P. Young, P.S. Grant, Spray processing of TiO2 nanoparticle/ionomer coatings on carbon nanotube scaffolds for solid-state supercapacitors, J. Mater. Chem. 2 (2014) 11022–11028.
[24] C. Huang, A. Kim, D.J. Chung, E. Park, N.P. Young, K. Jurkschat, H. Kim, P.S. Grant, Multi-scale engineered Si-SiO2 nanocomposite electrodes for lithium ion batteries using layer-by-layer spray deposition, ACS Appl. Mater. Interfaces 10 (2018) 15624–15633.
[25] S.H. Lee, A. Mahadevegowda, C. Huang, J.D. Evans, P.S. Grant, Spray printing of self-assembled porous structures for high power battery electrodes, J. Mater. Chem. 6 (2018) 13133–13141.
[26] C. Huang, P.S. Grant, One-step spray processing of high power all-solid-state su-percapacitors, Sci. Rep. 3 (2013) 2393-1-9.
[27] D. Andre, M. Meiler, K. Steiner, C. Wimmer, T. Soczka-Guth, D.U. Sauer, Characterization of high-power lithium-ion batteries by electrochemical impedance spectroscopy. I. Experimental investigation, J. Power Sources 196 (2011) 5334–5341.
[28] D. Andre, M. Meiler, K. Steiner, H. Walz, T. Soczka-Guth, D.U. Sauer,
Characterization of high-power lithium-ion batteries by electrochemical impedance spectroscopy. II: Modelling, J. Power Sources 196 (2011) 5349–5356.
[29] M.E. Orazem, B. Tribollet, Electrochemical Impedance Spectroscopy, Wiley, New Jersey, 2008.
[30] G.K. Singh, G. Ceder, M.Z. Bazant, Intercalation dynamics in rechargeable battery materials: general theory and phase-transformation waves in LiFePO4, Electrochim. Acta 53 (2008) 7599–7613.
[31] P.A. Johns, M.R. Roberts, Y. Wakizaka, J.H. Sanders, J.R. Owen, How the electro-lyte limits fast discharge in nanostructured batteries and supercapacitors, Electrochem. Commun. 11 (2009) 2089–2092.
[32] H.R. Kim, W.M. Choi, Graphene modified copper current collector for enhanced electrochemical performance of Li-ion battery, Scripta Mater. 146 (2018) 100–104. [33] I.D. Raistrick, D.R. Franceschetti, J.R. Macdonald, Theory, in: E. Barsoukov,
J.R. Macdonald (Eds.), Impedance Spectroscopy Theory, Experiment, and Applications, John Wiley & Sons, Inc., New Jersey, 2005.
[34] G.W. Lee, J.H. Ryu, W. Han, K.H. Ahn, S.M. Oh, Effect of slurry preparation process on electrochemical performances of LiCoO2 composite electrode, J. Power Sources 195 (2010) 6049–6054.
[35] K.M. Kim, W.S. Jeon, I.J. Chung, S.H. Chang, Effect of mixing sequences on the electrode characteristics of lithium-ion rechargeable batteries, J. Power Sources 83 (1999) 108–113.
[36] J. Wang, X. He, E. Paillard, N. Laszczynski, J. Li, S. Passerini, Lithium- and man-ganese-rich oxide cathode materials for high-energy lithium ion batteries, Adv. Energy Mater. 6 (2016) 1600906-1-17.
[37] D.C. Li, H. Noguchi, M. Yoshio, Electrochemical characteristics of LiNi0.5-xMn0.5-xCo2xO2 (0 < x < = 0.1) prepared by spray dry method, Electrochim. Acta 50 (2004) 427–430.
[38] N. Schulz, R. Hausbrand, L. Dimesso, W. Jaegermann, XPS-surface analysis of SEI layers on Li-Ion cathodes: part I. investigation of initial surface chemistry, J. Electrochem. Soc. 165 (2018) A819–A832.
[39] N. Schulz, R. Hausbrand, L. Dimesso, W. Jaegermann, XPS-surface analysis of SEI layers on Li-Ion cathodes: part II. SEI-composition and formation inside composite electrodes, J. Electrochem. Soc. 165 (2018) A833–A846.
[40] L. Castro, R. Dedryvere, J.B. Ledeuil, J. Breger, C. Tessier, D. Gonbeaua, Aging mechanisms of LiFePO4//graphite cells studied by XPS: redox reaction and elec-trode/electrolyte interfaces, J. Electrochem. Soc. 159 (2012) A357–A363. [41] M.P. Seah, The quantitative analysis of surface by XPS: a review, Surf. Interface