warwick.ac.uk/lib-publications
Original citation:
Abdulla, Kurdo F., Cunningham, Lee S. and Gillie, Martin. (2017) Simulating masonry wall
behaviour using a simplified micro-model approach. Engineering Structures, 151. pp.
349-365.
Permanent WRAP URL:
http://wrap.warwick.ac.uk/92260
Copyright and reuse:
The Warwick Research Archive Portal (WRAP) makes this work of researchers of the
University of Warwick available open access under the following conditions.
This article is made available under the Creative Commons Attribution 4.0 International
license (CC BY 4.0) and may be reused according to the conditions of the license. For more
details see:
http://creativecommons.org/licenses/by/4.0/
A note on versions:
The version presented in WRAP is the published version, or, version of record, and may be
cited as it appears here.
Simulating masonry wall behaviour using a simplified micro-model
approach
Kurdo F. Abdulla
a,⇑, Lee S. Cunningham
a, Martin Gillie
ba
Mechanical, Aerospace and Civil Engineering School, The University of Manchester, Oxford Road, Manchester M13 9PL, United Kingdom
b
School of Engineering, University of Warwick, Coventry CV4 7AL, United Kingdom
a r t i c l e i n f o
Article history:
Received 6 December 2016 Revised 10 August 2017 Accepted 12 August 2017
Keywords:
Modelling masonry
Surface-based cohesive behaviour XFEM
Crack propagation In-plane load Out of plane load Cyclic in-plane load
a b s t r a c t
In this paper, a simplified micro-model approach utilising a combination of plasticity-based constitutive models and the extended finite element method (XFEM) is proposed. The approach is shown to be an efficient means of simulating the three-dimensional non-linear behaviour of masonry under monotonic in-plane, out of plane and cyclic loads. The constitutive models include surface-based cohesive behaviour to capture the elastic and plastic behaviour of masonry joints and a Drucker Prager (DP) plasticity model to simulate crushing of masonry under compression. The novel use of XFEM in simulating crack propa-gation within masonry units without initial definition of crack location is detailed. Analysis is conducted using standard finite element software (Abaqus 6.13) following a Newton Raphson algorithm solution without employing user-defined subroutines. The capability of the model in terms of capturing non-linear behaviour and failure modes of masonry under vertical and horizontal loads is demonstrated via comparison with a number of published experimental studies.
Ó2017 Elsevier Ltd. All rights reserved.
1. Introduction
Masonry is one of the oldest and most widespread structural materials; it has been and is still used for various construction pur-poses. Masonry consists of units and mortar, these constituents have their own mechanical properties and their geometry and arrangement can vary forming different masonry assemblages. Thus masonry is classified as a heterogeneous anisotropic material, and analysis, understanding and capture of the structural beha-viour of masonry is therefore complex. For design of non-standard masonry structures or assessment of existing structures, recourse to numerical modelling is often required to understand the structural behaviour under various loading conditions.
Nowadays, numerical models offer a viable alternative to phys-ical experiments. Different numerphys-ical methods such as the finite element method (FEM), discrete element method (DEM), limit analysis[1,2]and the applied element method (AEM)[3]have been employed to conduct numerical analysis and simulate linear and non-linear behaviour of masonry. The finite element method (FEM) is the focus of this paper. FEM for masonry is based on two main modelling approaches, namely, Micro-modelling and
Macro-modelling, the choice depending on the level of accuracy and detail required.
In the Micro-model approach, the simulation can be detailed; the units and mortar are modelled as continuum elements and unit-mortar interfaces are modelled as discontinuum elements. The detailed Micro-modelFig. 1(a) can provide accurate results, but it is computationally intensive and thus limited to simulating relatively small masonry elements. Alternatively, a simplified Micro-modelling approach Fig. 1(b) can be adopted to address the disadvantages of the detailed micro approach. In the simplified approach, the units are expanded by adding the mortar thickness, the expanded units are modelled as a series of continuum elements and the interaction between the expanded units is modelled as series of discontinuum elements.
In the Macro-model approach,Fig. 1(c), the masonry is consid-ered as a homogenous material with no distinction between units and mortar, the material properties are obtained from average properties of masonry constituents and the masonry is modelled as a series of continuum elements[4]. This approach is adopted where relatively larger and more complex masonry structures are modelled and the global behaviour is of interest, but it cannot capture detailed failure modes.
Over the past four decades, finite element techniques have continuously evolved to capture the complex structural behaviour of masonry walls and associated structures. Arya and Hegemier[5]
http://dx.doi.org/10.1016/j.engstruct.2017.08.021
0141-0296/Ó2017 Elsevier Ltd. All rights reserved.
⇑ Corresponding author.
E-mail address:[email protected](K.F. Abdulla).
Contents lists available atScienceDirect
Engineering Structures
Nomenclature
c cohesion between the masonry joints interfaces (MPa) D damage evolution variable
d material cohesion (MPa) Eadj adjusted elastic modulus (MPa) Em elastic modulus of mortar (MPa) Eu elastic modulus of units (MPa)
fmt flexural tensile strength of masonry (MPa) Gm shear modulus of mortar (MPa)
Gu shear modulus of units (MPa)
GI work done by the traction-separation in the normal direction (N/mm)
GII work done by the traction-separation in the first shear direction (N/mm)
GIII work done by the traction-separation in the second shear direction (N/mm)
GTC critical mixed-mode energy dissipation at failure (N/ mm)
GIC critical fracture energy in the normal direction, refers to as mode I fracture energy (N/mm)
GIIC critical fracture energy in the first and second shear directions, refers to as mode II and mode III fracture en-ergies (N/mm)
H height of masonry assemblage (mm) hm thickness of mortar (mm)
hu height of masonry unit (mm) I identity matrix
K elastic stiffness matrix
Knn stiffness of masonry joints in the normal direction (N/ mm3)
Kss stiffness of masonry joints in the first shear direction (N/ mm3)
Ktt stiffness of masonry joints in the second shear direction (N/mm3)
kb numerical factor
lu length of masonry units (mm)
Md diagonal bending moment capacity of masonry (N mm/ mm)
Mh horizontal bending moment capacity of masonry (N mm/mm)
n number of courses in a masonry assemblage
R ratio of the yield stress in triaxial tension to the yield stress in triaxial compression (flow stress ratio) r third invariant of deviatoric stress (MPa) S stress deviator (MPa)
t nominal traction stress vector tu thickness of masonry units (mm)
to
eff effective traction stress at damage initiation under com-binations of normal and shear tractions in the joints (MPa)
tn normal traction stress in masonry joints in the normal direction (MPa)
ts shear traction stress in masonry joints along the first shear direction (MPa)
tt shear traction stress in masonry joints along the second shear direction (MPa)
tmax
n maximum allowable traction stress in masonry joints in the normal direction (Tensile strength of masonry joints) (MPa)
tmax
s maximum allowable traction stress in masonry joints in the first shear direction (Shear strength of masonry joints) (MPa)
tmax
t maximum allowable traction stress in masonry joints in the second shear direction (Shear strength of masonry joints) (MPa)
b material friction angle (Degree)
d separation vector
deff effective separation (mm)
don separation of masonry joints at the initiation of damage in the normal direction (mm)
dos separation of masonry joints at the initiation of damage in the first shear direction (mm)
dot separation of masonry joints at the initiation of damage in the second shear direction (mm)
dnf separation of masonry joints at the complete failure in the normal direction (mm)
dsf separation of masonry joints at the complete failure in the first shear direction (mm)
dtf separation of masonry joints at complete failure in the second shear direction (mm)
g
exponent in the BK law associated with cohesive prop-erty i.e. brittle, ductile, etc.m coefficient of friction between the masonry joints inter-faces
m
Poisson’s ratior
stress tensorr
c compressive yield stress of masonry assemblage (MPa)r
n normal contact pressure stress in masonry jointinter-faces (MPa)
s
crit critical shear stress in masonry joint interfaces at whichinterfaces fail (MPa)
s
sliding post-failure shear stress in masonry joint interfaces atwhich interfaces slide (MPa)
£ gle of diagonal crack line in masonry under out of plane loading (Degree)
w
dilation angle (Degree)and Page [6] attempted to model masonry using a simplified Micro-modelling approach by taking masonry units as continuum elements and mortar joints as interface elements. This approach was then adopted by Lotfi and Shing[7]to study the behaviour of masonry assemblages by including the fracture of the mortar joints into the model via interface elements. The crack initiation and evolution of masonry mortar joints were successfully simu-lated under combined normal and shear stresses in both tension-shear and compression-tension-shear regions, but the simulation of masonry was not successful under high compression stress. Lour-enço and Rots[8]developed a multi-surface interface model which is defined based on three yield functions, namely, a tension cut-off for tensile failure, a Mohr-Coulomb failure envelop for shear failure and a cap model for compressive failure. In addition, potential ver-tical cracks were placed in the middle of the masonry units which allowed the simulation of vertical cracks under pure tension.
Shing and Cao[9]conducted finite element analysis for partially grouted masonry shear walls, a smeared crack model was adopted to simulate the fracture behaviour of the masonry units and plasticity-based interface elements were used to simulate the mor-tar joint responses under tensile and shear stress. Although, the model successfully simulated the failure modes of the masonry walls, the lateral resistance of the walls was higher than the resis-tance obtained from experiments. For example in one of the mod-els reported, the lateral resistance from the numerical analysis was 60% higher than the experimental results. Sutcliffe et al.[10] con-ducted a lower bound limit analysis for masonry shear walls where both tensile and shear failure in the brick units and a compression cap for the interface elements were included, but material soften-ing behaviour was ignored. Citto[11]and Kumar et al.[12] devel-oped an interface model to simulate initiation and propagation of cracks in masonry joints and potential vertical cracks in the middle of masonry units under normal and shear stresses, a compression cap was also included in the model to simulate the plastic response under compression. The proposed model in[11,12]was analysed via Abaqus by making use of a user defined subroutine, which defined the constitutive behaviour. In all the aforementioned stud-ies, simplified 2D Micro-models were used to simulate only in-plane behaviour of masonry under normal and shear stresses.
The aforementioned studies have dealt with monotonic in-plane load regimes. With regards to modelling cyclic in-in-plane load-ing of masonry, a study conducted by Oliveira and Lourenço[13], proposed a 2D model to simulate the behaviour of masonry under cyclic loadings using interface elements between masonry units. In a more recent study conducted by Miglietta et al.[14], finite/dis-crete element modelling (DEM) is implemented to simulate the behaviour of masonry under reversed cyclic in-plane loadings. The implemented 2D model depended on stress-displacement relationships between the adjacent masonry elements to simulate the opening and sliding behaviour of masonry joint elements. The model was shown to be capable of capturing the response and fail-ure modes of masonry under reversed cyclic in-plane loadings. However, the crushing of masonry under compression, which is a possible failure mode of masonry under cyclic loads, was not considered.
Several studies have also been undertaken to simulate the beha-viour of masonry under monotonic out of plane loads. Kuang and Yuen [15] conducted a 3D explicit-dynamic numerical analysis through a damage based cohesive crack model. The model was implemented in Abaqus via a user defined subroutine, which defined the interaction between the masonry units’ surfaces. The model was capable of capturing non-linear response and failure modes of masonry infilled reinforced concrete frames under com-bined in-plane, out of plane and dynamic loads. However, the crushing of masonry in compression and cracking of masonry units was not considered in the model.
La Mendola et al.[16]undertook a finite element analysis to simulate non-linear out of plane behaviour of masonry. The analy-sis was conducted by employing interface elements with a bilinear law to simulate crack initiation and propagation in the masonry joints. The crack formations in the joints were in good agreement with experimental results; however masonry components were modelled using an isotropic linear elastic law where a possible compressive failure mechanism was not taken into consideration. Aref and Dolatshahi [17] developed a 3D constitutive material model with an explicit-dynamic analysis procedure in Abaqus. The model was defined through a user-defined subroutine to cap-ture the linear and non-linear behaviour of masonry under in-plane, out-of-plane and cyclic loadings.
In summary, most of the existing masonry numerical analysis studies have focused on 2D analysis which is limited to simulating unreinforced masonry under normal and shear stresses, and possi-bly through-thickness out of plane behaviour. Realistic, 3D models are required to conduct masonry FE analysis under more compli-cated loading conditions such as the combined in-plane and out of plane loads associated with in service conditions. Furthermore, 3D models are necessary to simulate reinforced masonry walls because simulation is either not possible or limited in 2D FE anal-ysis. A few of the proposed 3D models available in the literature such as in [15,17] have relied on employing a user subroutine and an explicit dynamic analysis procedure. In addition, it can be noted that the crack propagation in the brick units, which plays an important role in non-linear degradation of masonry assem-blages, is either ignored or defined via interface elements. In the latter case, the formation of potential cracks has always been assumed to be vertical in the middle of units.
This paper presents a simplified 3D Micro-modelling approach to simulating the 3D behaviour of masonry. The modelling approach is implemented using the commercially available FE package, Abaqus. A combined 3D finite element model is proposed to simulate masonry walls under monotonic in-plane, out of plane and cyclic in-plane loads using a quasi-static solution procedure. The model relies on: surface based cohesion with two yield criteria (tensile and shear) to simulate crack initiation and propagation of masonry joints, and a Drucker Prager plasticity model to capture crushing of masonry under compression. The implemented model is novel in that:
dIt simulates the detailed behaviour of masonry walls under in-plane and out of in-plane loads using quasi-static analyses. dIn contrast to the all previous approaches, it captures crack
propagation within masonry units without requiring initial def-inition of crack location by using the extended Finite Element Method (XFEM).
dThe proposed model is simplified and user friendly since it is developed by making use of methods available in the Abaqus Library without employing any user defined subroutines.
2. Modelling approach
Herein the constitutive models used to simulate 3D masonry under the simplified modelling approach are described in detail. In addition, the failure modes associated with the models are also presented.
2.1. Surface-based cohesive behaviour model
the jointsFig. 2(a) and shear sliding of the jointsFig. 2(b) and (c) are simulated.
2.1.1. Elastic response of the joint interfaces
The initial response of the joint interfaces is based on a linear traction separation relationship prior to damage. The general linear behaviour is written in the form of an elastic stiffness matrix. The relation between the elastic stiffness matrixK, nominal traction vectort, and corresponding separation vectord, of the joint inter-facesFig. 3is expressed as in Eq.(1)
t¼ tn ts tt 8 > < > : 9 > = > ;¼
Knn 0 0 0 Kss 0 0 0 Ktt 2
64
3 75 ddns
dt 8 > < > : 9 > = >
;¼Kd ð1Þ
The components of stiffness matrixK, for joint interfaces in a simplified masonry Micro-model (interfaces between expanded masonry units) should be equivalent to the stiffness of the original masonry joint interfaces (brick and mortar) under the same bound-ary conditions. So, the equivalent stiffness for joint interfaces is expressed as a function of the mortar’s and unit’s moduli of elastic-ity, and the thickness of the mortar Eqs.(2) and (3) [4].
Knn¼ EuEm
hmðEuEmÞ ð
2Þ
Kssand Ktt¼
GuGm
hmðGuGmÞ ð
3Þ
2.1.2. Plastic response of the joint interfaces
The initial linear response of the joints is followed by crack propagation. When the damage initiation criterion is achieved based on the user defined tractions between the masonry inter-faces i.e. shear and tensile strength of the joints, cracking propa-gates in the masonry joints. The quadratic stress criterion is used
to define damage initiation; this criterion is met when the quadra-tic stress ratios of masonry interfaces are equal to one. This crite-rion is adopted as it effectively predicts the damage initiation of joints subjected to mixed-mode loadings[18], which is the case in masonry joint interfaces (the masonry joint interfaces are sub-jected to tensile stress in the normal direction and shear stress in the two shear directions). The criterion is expressed as in Eq.(4).
htni tmax n 2
þ ts tmax
s 2
þ tt tmax
t 2
¼1 ð4Þ
The Macaulay bracket in Eq.(4)indicates the exclusion of the compressive stresses on the fracture behaviour of the joints in the normal direction. Tensile cracking of masonry joints is gov-erned by the defined tensile strength of masonry joints. Critical shear stress of joints prior to failure is described by Mohr-Coulomb failure Eq.(5).
s
crit¼cþlr
n ð5ÞThe shear strength of masonry joints is calculated based on Eq. (5), in which the cohesion, coefficient of friction and normal com-pressive stress are taken into consideration, thus
s
crit is used todefine the shear strength of masonry joints (tmax
s andtmaxt ).
Corre-spondingly, the possible pre-failure enhancement in shear beha-viour due to frictional resistance is considered in the crack initiation criterion of masonry joints in the surface-based cohesive model.
In addition, the coefficient of friction of the masonry joints is defined to simulate the post-failure shear sliding behaviour (Tan-gential behaviour). The critical sliding shear stress (
s
sliding) isobtained based on the friction law Eq.(6), which is governed by a linear relationship between the coefficient of friction and normal compressive stress.
s
sliding¼lr
n ð6ÞThe above friction formulation indicates the sliding of masonry units when the shear stress in the failed masonry joints is more than the critical sliding shear stress (
s
sliding).Once the damage initiation criterion is reached, the propagation of cracks in the masonry joints causes stiffness degradation at a defined rate which leads to total strength loss and failure of joints. Thus, Eq.(1)is rewritten as Eq.(7):
t¼ ð1DÞKd ð7Þ
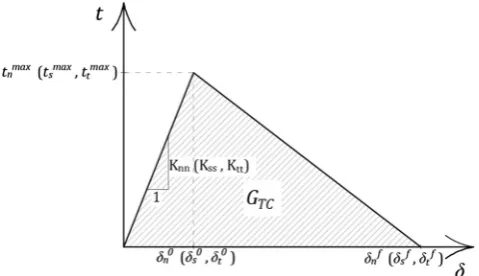
Dis the damage evolution variable, the value increases from 0 to 1 as per continuity of traction stresses after the damage initia-tion criterion met. In this study, a linear damage evoluinitia-tion variable is assumed by specifying the energy dissipated as a result of the damage processFig. 3. The damage variable is expressed as:
D¼d f effðd
max eff d
o effÞ dmaxeff ðd
f effd
o effÞ
[image:5.595.39.279.591.729.2]ð8Þ Fig. 2.Failure modes of the joints: (a) tensile cracking; (b) and (c) shear sliding.
The effective separationdeff, is given by[19]:
deff¼
ffiffiffiffiffiffiffiffiffiffiffiffiffiffiffiffiffiffiffiffiffiffiffiffiffiffiffiffiffiffiffi hdni2
þd2sþd 2 t q
ð9Þ
The effective separation at complete failure defff , is also expressed as:
defff ¼2GTC to
eff
ð10Þ
defff is the effective separation at the complete failure of the joint,d0effis the relative effective separation when damage initiates in the joints,dmaxeff is the maximum effective separation reached
during the loading history. The critical mixed mode fracture energy, GTC, is obtained from the Benzeggagh-Kenane (BK) law
[20]since it is the most suitable when the critical fracture energies of both shear directions (mode II and mode III) are the same, which is the case in masonry joints. The exponent,
g
, in the BK law is set as 2 assuming brittle behaviour[20]in masonry joints. The critical fracture energy GC, under the mixed-mode in the BK law isexpressed as:
GTC¼GICþ ðGIICGICÞ
GIIþGIII GIþGIIþGIII
g
ð11Þ
2.2. Extended finite element method (XFEM)
The extended FEM approach (XFEM) was originally developed by Belytschko and Black[21]to simulate crack propagation in an element based on the nodal displacements of the element around the crack tip and without the requirement for re-meshing. In the XFEM, discontinuous enrichment functions are added to the classi-cal FEM based on the partition of unity concept proposed by Melenk and Babuska[22]. The enrichment functions, which make the crack independent of the mesh, are expressed as the approxi-mation for a displacement vector function,u, and is written as below[23]:
u¼X
I2N
NIðxÞ uIþHðxÞaIþ X4
/¼1 F/ðxÞb/I
" #
ð12Þ
In the above enrichment functions, NIðxÞ is associated with nodal shape functions, uI is nodal displacement vector, HðxÞ is associated with discontinuous jump functions to form the crack path, aI is vector of the nodal enriched degree of freedom, F/ðxÞ is associated with the crack-tip functions to develop cracks at the tip and b/I is the vector of the nodal enriched degree of freedom.
In this paper XFEM is used to simulate crack initiation and prop-agation in masonry units under tension and shearFig. 4withouta priori-specification of a crack path and crack location. XFEM cracks are simulated based on the cohesive segment method[24]. The method can follow the traction separation law described above
for the surface based cohesive behaviour to initiate and propagate cracks in the elements of masonry units.
2.3. Drucker-Prager plasticity model
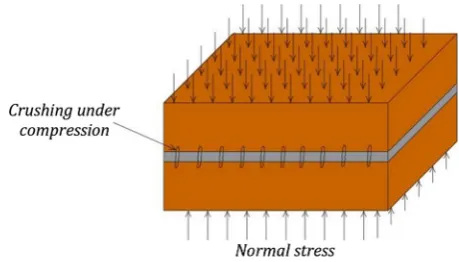
The Drucker-Prager plasticity model is used to simulate the compressive non-linear behaviour of masonry. The model allows the isotropic hardening and softening of materials under compres-sion. Thus, the possible compressive failure of masonry can be cap-turedFig. 5.
The DP model was originally developed by Drucker and Prager [25]as a generalisation of the Mohr-Coulomb criterion to estimate failure stress of frictional materials such as soils and rocks. The model was then modified by Lubarda et al.[26]to include the com-pressive yield criterion under hydrostatic compaction pressure. In this paper, a linear yield criterion is adopted, which is a linear yield surface in the meridional (p–t) planeFig. 6. The evolution of the yield surface with non-linear deformation was defined based on the uniaxial compression yield stress,
r
c, of the masonryassem-blage. In this criterion, flow stress ratio R, dilation angle
w
, and fric-tion angleb, are to be defined. The linear yield surface in the DP plasticity model is expressed as[27]:F¼tptanbd¼0 ð13Þ
where
t¼1 2q 1þ
1
R 1
1
R
r q
3
" #
ð14Þ
The hydrostatic pressure stress,p, is given by:
p¼ 13traceð
r
Þ ð15ÞAnd the von Mises equivalent stress,q, is given by:
¼
ffiffiffiffiffiffiffiffiffiffiffiffiffiffiffiffiffi 3 2ðS:SÞ r
[image:6.595.130.475.68.177.2]ð16Þ Fig. 4.Failure modes of the units: (a) direct tensile crack, (b) diagonal crack.
[image:6.595.320.550.214.345.2]S¼
r
þpI ð17Þr¼ 9 2SS:S
1
3
ð18Þ
d¼ 11 3tanb
r
c ð19ÞThe compressive plastic properties of a masonry system i.e. the values of compressive yield stresses versus absolute plastic strains are defined as the hardening and softening behaviour of the DP plasticity model via the expanded masonry units, thus the com-pressive yield surface of masonry was included in the FE models.
2.4. Elastic behaviour of expanded units
The elastic modulus of the expanded masonry units must be adjusted and made to have an equivalent elastic response to the original masonry assemblage (unit and mortar). It is to be deter-mined by taking the original masonry unit and mortar moduli of elasticity and geometry of the masonry assemblage into account. For this purpose, Eq.(20)is proposed based on the assumption of a stack bond between masonry units and uniform stress distribu-tion in masonry constituents. It is presented as:
Eadj¼
HEuEm
nhuEmþ ðn1ÞhmEu ð 20Þ
3. Finite element modelling and analysis
In the proposed 3D finite element simplified Micro-model, the linear and non-linear behaviour of expanded units and interfaces are defined. The expanded units are modelled using 3D hexahedral shaped eight node linear brick elements with reduced integration and hour glass control (type C3D8R)[27]. The joint interfaces are modelled based on a surface based cohesive approach. The contacts between adjacent masonry units are defined through a node to sur-face discretisation method with finite sliding formulation. Hard con-tact behaviour was defined between the adjacent surfaces of
masonry units by the contact pressure-overclosure relationship. The adopted hard contact behaviour assumes that the surfaces transmit pressure when they are in contact. In addition, the penetra-tion and the transfer of tensile stress between the contacting sur-faces are prevented in the hard contact model. This model corresponds with the behaviour of the contacting surfaces of masonry units.
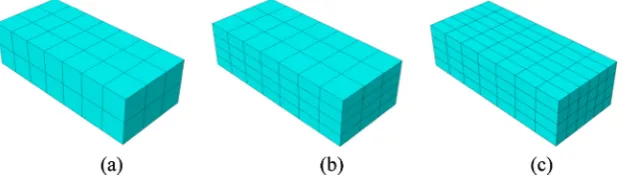
[image:7.595.307.548.71.212.2]The simplified Micro-models presented in this study are gener-ated in Abaqus/Standard. The mesh generation of the models is conducted via a simple piece of code, in this case Python script; this code significantly reduces the time and effort required for gen-erating simplified Micro-models. The mesh size was chosen based on a mesh sensitivity study. For this purpose, three numerical anal-yses were conducted for the masonry wall which is represented later for the validation study under in-plane loads. In the first anal-ysis, each masonry unit (210 mm long52 mm high100 mm thick) was modelled with 723 elementsFig. 7(a). In the sec-ond, each unit was modelled with 743 elements Fig. 7(b), double the number of elements compared to the first case. In third analysis, each unit was modelled with 746 elementsFig. 7(c), i.e. 4 times the number of elements used in the first case. In all cases, the results in terms of failure patterns, and elastic and plastic response were satisfactorily similar as shown inFig. 8. This com-parison indicates the relative insensitivity of the proposed model to the given mesh sizes. In turn, relatively course meshes can be used which significantly reduces the required computational time. The steps adopted to conduct the numerical analysis impose the actions (load or displacement) to the model either based on load control or displacement control. In both cases, the actions are incre-mentally imposed. Large displacement non-linear geometry effects were considered in all models. A general non-linear static procedure was adopted to follow a Newton-Raphson algorithm solution which iteratively solves for equilibrium in each increment. In addition, stiffness degradation and softening behaviour of masonry joints induce numerical instability; therefore viscous regularisation is required as a damage stabiliser in the surface-based cohesive Fig. 6.Linear yield surface of the DP model (based on[27]).
Fig. 7.Masonry units with different mesh sizes.
0 10 20 30 40 50 60 70 80 90 100
0.0 0.5 1.0 1.5 2.0 2.5 3.0 3.5 4.0
Horizontal load (kN)
Horizontal displacement (mm) 7 x 2 x 3 elements - Computational time: 58 minutes 7 x 4 x 3 elements - Computational time: 100 minutes 7 x 4 x 6 elements - Computational time: 148 minutes
[image:7.595.137.449.651.739.2]behaviour model to simulate the full failure of masonry joints with-out numerical convergence difficulties. To obtain an appropriate vis-cosity parameter for specifying the stabilisation in masonry joints, parametric studies were conducted. In this parametric study, the viscosity parameter was adopted by considering the computational time, the effect of the parameter on the overall response of the model and the convergence of numerical analysis. For this purpose, three different viscosity parameters were tested by simulating the wall used as the validation example under in-plane load; while mesh size was kept constant (each masonry unit was modelled with 723 elementsFig. 7(a)). The detailed comparison between numerical results using different viscosity parameters are shown inFig. 9. Based on this study and by considering a balance between the accu-racy of results and computational time, the viscosity parameter was adopted as 0.002 for the rest of the numerical analyses.
4. Validation examples
The capability of the proposed 3D combined simplified Micro-model to simulate the structural behaviour and various failure
mechanisms of masonry is presented. For this purpose, simulations of a number of masonry panels from three different experiments are conducted under different loading conditions, namely, mono-tonic in-plane, out of plane and in-plane cyclic loads. The numeri-cal results are then compared to those obtained from the corresponding experiments.
4.1. Response of masonry under in-plane loading
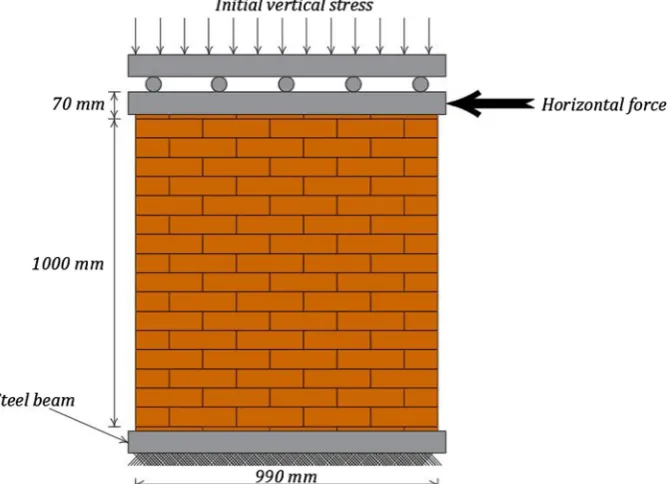
The data and results of experimentally tested masonry shear walls undertaken and reported in [28] are adopted to validate the numerical model under in-plane loading. The dimensions of the tested shear walls were 900 mm long1000 mm high100 mm thick. Each wall was built with 18 courses of wire cut solid clay bricks, the brick dimensions were 210 mm long52 mm high100 mm thick. The thickness of the mortar joint was 10 mm and was made of cement, lime and sand with a volumetric ratio of 1:2:9 respectively. Both the top and bottom courses of the walls were clamped via steel beams, the bottom beam being fixed to the lab floor. The walls were subjected to an imposed vertical compressive stress via the top beam. After apply-ing the compressive load, the vertical movement of the top beam was restrained, and then a monotonic load was horizontally applied to the walls via the top beamFig. 10.
In the experiment, masonry shear walls under different imposed vertical compressive stresses were tested. The failure modes of the walls were due to a combination of diagonal cracks and cracking of units themselves, followed by crushing under com-pression. In the present study three walls with two different initial compressive stresses were considered, namely, wall J4D and J5D under 0.3 MPa and wall J6D under 1.21 MPa. These values were chosen based on the values of the imposed compressive stresses reported in the corresponding experiments[28]. The mechanical properties and data used for defining the numerical models were obtained from the experimental results reported in[28], the data used in[4]and using Eqs.(2) and (20). The mortar elastic modulus (Em) was calculated by considering the given values ofKnnandEu
and using Eq.(2). Then, the adjusted elastic modulus (Eadj) of the
0 20 40 60 80 100 120 140
0.0 0.5 1.0 1.5 2.0 2.5 3.0 3.5 4.0
Horizontal load (kN)
Horizontal displacement (mm)
Experimental: J4D
Experimental: J5D
Numerical: Viscosity Parameter = 0.0002 & Computational Time = 386 minutes
Numerical: Viscosity Parameter = 0.0020 & Computational Time = 58 minutes
[image:8.595.138.474.494.736.2]Numerical: Viscosity Parameter = 0.0200 & Computational Time = 10 minutes
Fig. 9.Comparison between horizontal load-displacement responses and compu-tational times using different viscosity parameters.
masonry wall was calculated using Eq.(20). All parameters used in this validation study are summarised inTables 1–3.
As discussed earlier, crushing of the masonry under compres-sion is simulated in the expanded masonry units by using the Drucker Prager model. To do so, the hardening and softening parts of axial compressive stresses versus plastic strain of the masonry assemblages are required. In addition, other required parameters such as dilation angle (
w
), friction angles (b) and flow stress ratio (R) are defined as follows;w
was selected as a lower bound as 11.3 degrees based on[29],bis set at 36 degrees based on the coef-ficient of friction for masonry units andKwas set as the default value equal to 1 [27]. The compressive stress-strain curves required to define the compressive behaviour of the numerical models were obtained by considering the study conducted by Kaushik et al. [30], making use of the ultimate compressive strength values (r
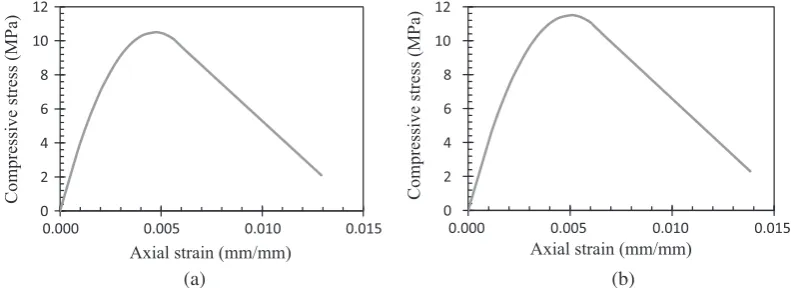
c) given in the experiments and the adjusted elastic modulus value (Eadj) calculated from Eq.(20). For detailedinformation, the reader is referred to[30]. The compressive stress strain curves are shown inFig. 11(a) and (b).
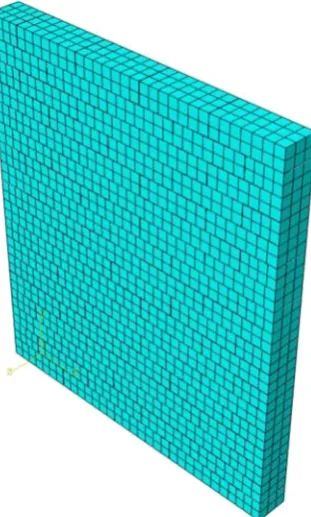
For the simulation, 3D eight node linear brick elements were used, the longest side of the elements was 303 mm which resulted in a mesh comprising 3456 elements as shown in Fig. 12. The numerical analysis was computed in two steps. In
the first step, the initial vertical compression stress was imposed. To keep the same boundary conditions as in the experiment, in the second step, the vertical and out of plane horizontal displace-ments and rotations about all axes were restrained at the top of the wall, and the horizontal in-plane monotonic load was incre-mentally applied under displacement control, with the imposed vertical compression stress held constant.
The numerical results show a good agreement with experimen-tal results in terms of load displacement relationshipsFig. 13. Fur-thermore, the failure modes of the numerical models were consistent with the experiments. For example in the J4D and J5D walls, the mode of failure in both experiments Fig. 14(a) and numerical models Fig. 14(b) were characterised by initiation of tensile cracks at the top and bottom of the wall at an early loading stageFig. 15(a). These cracks were then followed by formation of diagonal stepped cracks between masonry units, cracking of the masonry units themselves and eventually crushing of the top and bottom toes under compression which ultimately led to failure of the wallsFig. 15(b).
The term STATUSXFEM inFig. 14(b) indicates the cracking sta-tus of the elements; the value of 1 signifies complete cracking of the element, 0 indicates no cracking, and values between 0 and 1 indicate partial cracking of the elements. A good agreement between the distributions of cracked units can also be observed in the experimental and numerical walls.
Fig. 15(a) shows cracks at the top and bottom of the wall and the compressive stresses are distributed over the undamaged regions of the wall. InFig. 15(b), the cracks propagated along the head and bed joints, and in the masonry units themselves. These cracks resulted in the redistribution of compressive stresses over Table 1
Elastic properties of constitutive materials and joint interfaces for the wall tested under in-plane load.
Wall Brick units Mortar Expanded units Joint interface
Eu(MPa) m Em(MPa) (from Eq.(2)) Eadj(MPa) (from Eq.(20)) Knn(N/mm3) Kss(N/mm3) Ktt(N/mm3)
J4D and J5D 16,700 0.15 780 4050 82 36 36
J6D 16,700 0.15 1030 4655 110 50 50
Table 2
Non-linear material properties for the joint interfaces.
Wall Tension Shear Compression
tmax
n (MPa) GIC(N/mm) c(MPa) m GIIC(N/mm) rc(MPa)
J4D and J5D 0.25 0.018 0.350 0.75 0.125 10.5
J6D 0.16 0.012 0.224 0.75 0.050 11.5
Table 3
Properties for the masonry units for the wall tested under in-plane load.
Tension Shear
Tensile strength (MPa) GIC(N/mm) Shear strength (MPa) GIIC(N/mm)
2.0 0.08 2.8 0.50
0 2 4 6 8 10 12
0.000 0.005 0.010 0.015
Compressive stress (MPa)
Axial strain (mm/mm)
0 2 4 6 8 10 12
0.000 0.005 0.010 0.015
Compressive stress (MPa)
Axial strain (mm/mm)
[image:9.595.94.490.594.738.2](a)
(b)
the un-cracked regions and occurrence of high compressive stres-ses and crushing of the wall at its toe.
4.2. Response of masonry under out-of-plane loading
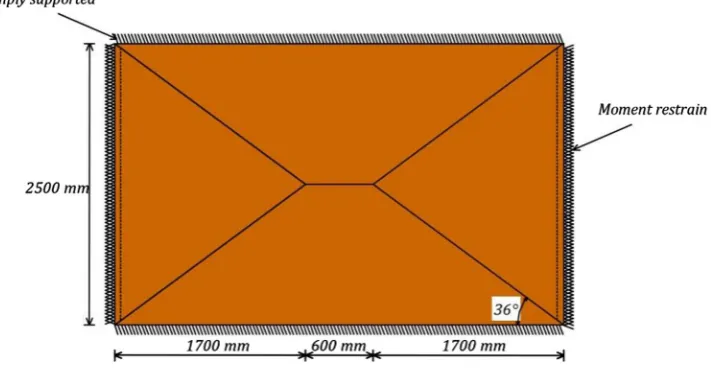
The focus of this validation study is the on-plan C-shaped masonry wall tested by Griffith and Vaculik[31]under out of plane loading, seeFig. 16. The main portion of the wall forming the web was 4 m long and 2.5 m high, the return walls which formed the flanges were 0.45 m long and 2.5 m high, in all cases the wall was 110 mm thick. The wall was built with 10-hole cored
230 mm long76 mm high110 mm thick brick units with a mortar joint thickness of 10 mm (1:2:9 cement:lime:sand), the bond pattern was half overlap stretcher bond. The wall was simply supported along its entire length at the top and bottom. The return walls were built along the vertical edges of the main wall (web) to provide a realistic moment restraint and the free ends of the return walls were clamped by a steel channel section which restrained the lateral movementsFig. 16. The wall was loaded by applying pres-sure to the outer face of the web wall via an airbag placed between the web and a reaction frame. The recorded forces in the reaction frame were then divided by the surface area of the web to deter-mine the applied pressure. The response of the wall was presented as a relationship between the applied pressure and out of plane displacement at the centre of the inner surface of the main web.
The material properties required for defining the numerical model were obtained from the original experimental data. Where properties were not reported in the experiments, these were obtained either by calculation or assumptions based on relevant data available in the literature detailed as follows. Poisson’s ratio was set as 0.15, similar to the previous validation study as reported in[28]. The mortar elastic modulus (Em) was calculated based on
[image:10.595.92.248.68.327.2]the given values of brick units (Eu) and masonry (Eadj) elastic
Fig. 12.Generated mesh of numerical models.
0 20 40 60 80 100 120 140
0 1 2 3 4
Horizontal load (kN)
Horizontal displacement (mm)
Experimental: J4DExperimental: J5D Experimental: J6D
[image:10.595.319.556.70.225.2]Numerical: 0.30 MPa initial vertical stress Numerical: 1.21 MPa initial vertical stress
Fig. 13.Comparison between experimental and numerical results.
[image:10.595.76.522.509.739.2]moduli reported in[31]and using Eq.(20). The elastic stiffness of joint interfaces in the normal and shear directions (Knn, Kss and
Ktt) were calculated by using Eqs. (2) and (3). The values of Gu
andGmin Eqs.(2) and (3)are considered as 0.4 ofEuandEm
respec-tively, as recommended in Eurocode 6 [32]. The tensile bond strength of joints (tmax
n ) was considered as one third of the flexural
strength (fmt) of the masonry system as recommended in[33]. The
[image:11.595.85.496.72.301.2]flexural strength of the masonry system was calculated based on the virtual work method by considering the experimental results reported in[31]i.e. the ultimate horizontal load carrying capacity (3.04 kPa), the collapse mechanism (yield line) was idealised from the experimental result as shown in Fig. 17. In addition, the Fig. 15.Crack pattern and minimum principal stress distribution (N/mm2
) in the wall with the initial vertical compression stress of 0.3 N/mm2
: (a) at 1 mm horizontal displacement at top; (b) at 4 mm horizontal displacement at top (scale factor = 20).
[image:11.595.50.540.360.652.2]horizontal (Mh) and diagonal (Md) bending moment capacities for
the case shown inFig. 17 were determined by using Eqs. (21) and (22)reported in[34,35], respectively.
Mh¼ 1 ðhuþhmÞ
s
critkb0:5ðluþhmÞt2u
ð21Þ
Md¼
sin£
ðhuþhmÞ ðsin£Þ
3
s
critkb0:5ðluþhmÞt2uþ ðcos£Þ
3f
mt
0:5ðluþhmÞt2u
6
ð22Þ
In the above equations, kbis a numerical factor and taken as 0.214 for stretcher bond masonry walls, and£ the angle of the diagonal crack line.
The value of tensile fracture energy is not dependant on the ten-sile bond strength of joints, the average value of 0.012 N/mm is recommended in the absence of detailed information by Angelillo et al.[36]. The cohesion value of the joint interfaces was consid-ered as 1.4 of the tensile bond strength as implemented in[4]. The shear fracture energy of masonry joints was set at 0.04 N/ mm. According to[4], the shear fracture energy of masonry joints with a cohesion strength (c) ranging from 0.1 to 1.8 MPa ranges from 0.01 to 0.25 N/mm. In this study, 0.04 N/mm was adopted with a view of giving best agreement between experimental and numerical results. In Table 6, the tensile strength of the units was considered as one third of the flexural strength of the units reported in the experiments. The shear strength of the units was set as 1.4 of their tensile strength. The tensile and shear fracture energies were considered to be the same as the fracture energies
used inTable 3, assuming similar fracture behaviour of masonry units. The material parameters used for the numerical model under out-of-plane loading are summarised inTables 4–6.
Similarly above, the dilation angle (
w
), friction angles (b) and flow stress ratio (R) are defined as 11.3 degrees, 36 degrees and 1, respectively, for the Drucker Prager model. The compressive stress strain curve was obtained Fig. 18 based on [30], making use of the ultimate compressive strength value (r
c) and masonryelastic modulus (Eadj) given in the experiment[31].
The wall model consisted of 11252 3D eight node linear brick elements; the side length of each element was 5010 mm. The analysis was conducted in one step, with the out of plane pressure imposed to the outer surface of the main wall under load control. The computational time required to conduct the analysis was 238 min (PC specification: 16 GB RAM, Intel i7 Core Processor with 3.4 GHz clock rate).
[image:12.595.128.484.72.257.2] [image:12.595.46.557.310.350.2]The numerical surface pressure versus displacement response of the wall showed a good agreement with the experimental Fig. 17.The idealised failure mechanism considered in the virtual work method.
Table 4
Elastic properties of constitutive materials and joint interfaces for the wall tested under out of plane load.
Brick units Mortar Expanded units Joint interface
Eu(MPa)[31] m[28] Em(MPa) (from Eq.(20)) Eadj(MPa)[31] Knn(N/mm3) (From Eq.(2)) Kss(N/mm3) (From Eq.(3)) Ktt(N/mm3) (From Eq.(3))
52,700 0.15 420 3540 42 17 17
Table 5
Non-linear material properties for the joint interface for the wall tested under out of plane load.
Tension Shear Compression
tmax
n (MPa) (Calculated) GIC(N/mm)[36] c(MPa) (Calculated) m,[28] GIIC(N/mm) (assumed based on[4]) rc(MPa)[31]
0.12 0.012 0.17 0.75 0.040 16
Table 6
Properties for the masonry units for the walls tested under out of plane and cyclic loads.
Tension Shear
Tensile strength (MPa) (from flexural strength
[31])
GIC(N/
mm)
[28]
Shear strength (MPa) (1.4 of tensile strength)
GIIC(N/
mm)
[28]
[image:12.595.41.569.390.431.2] [image:12.595.311.562.486.544.2]response. It was reported in the experiment that, the post peak strength response of the wall was relatively constant from the beginning of non-linear behaviour until reaching excessive dis-placement. This response was reported as being due to redistribu-tion; initially mobilising the diagonal bending moment resistance via stepped diagonal cracks, then the horizontal bending moment resistance provided by the vertical edges of the return walls. The same response was captured in the numerical modelFig. 19.
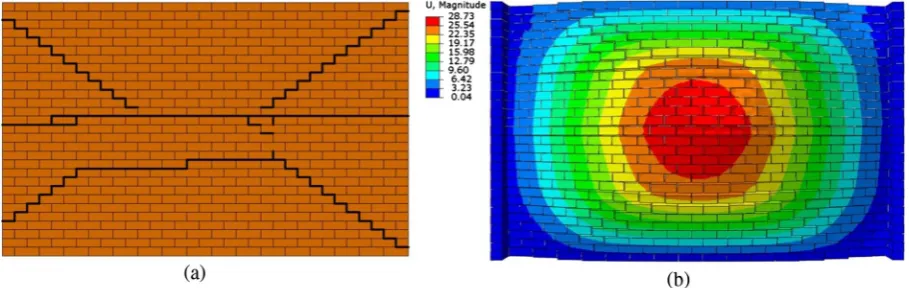
The experimental mode of failure in[31]is reported as the for-mation of horizontal cracks at mid height of the inner wall and stepped diagonal cracks extending from the middle to the corners
[image:13.595.46.270.69.219.2]at the inner surface of the main wallFig. 20(a). This scenario was also well captured in the numerical modelFig. 20(b). At this stage in the experiment, the wall was unloaded and no further damage in the wall was reported in[31], similarly at the same loading stage the numerical model showed no complete cracks in the actual masonry units themselves, or crushing of masonry of under com-pressionFig. 21, and the numerical model continued to sustain fur-ther pressure. However, the numerical model shows multiple distributed diagonal cracks rather than individual diagonal cracks as occurred in the experiment. This difference may be due to the inaccuracies in the adopted material properties. As previously dis-cussed, some of the material parameters used in the numerical model have been estimated based on relevant parameters available in the literature, this situation is due to the absence of all required parameters in the experiment. Another potential source of differ-ence is the fact that the properties of the unit-mortar interfaces were defined to be the same in the entire wall, this assumption results in the equal contribution of the unit-mortar joints to dis-tribute the flexural stresses in the regions of the concentrated stresses. Realistically, the strength of the unit-mortar joints is unli-kely to be entirely uniform within a masonry assemblage due to various effects such as workmanship, quality of mortar, etc. Corre-spondingly, the cracks usually form individually along the rela-tively weaker joints.
Fig. 22shows the cracking status in masonry units at the final loading stage. Similar to the experimental results, no complete cracking of masonry units was observed in the numerical results. The STATUSXFEM shows the masonry units with partial cracks, which indicates the potential cracks in vulnerable masonry units at the corners of the main wall outer face due to high tensile stresses.
4.3. Response of masonry under in-plane cyclic loading
The experimental results reported in[37]are used to validate the proposed model against the masonry behaviour under static in-plane cyclic loads. The nominal dimensions of the tested walls reported in[37]were 1200 mm long1200 mm high110 mm thick. The walls were built using 10-hole clay bricks with dimen-sions of 230 mm long76 mm high110 mm thick with a mor-tar joint thickness of 10 mm (1:1:6 cement:lime:sand). Each wall had 5 bricks in a row and 14 courses of brick, which were put in a running bond. A series of walls were tested to investigate the behaviour of masonry when a damp-proof course (DPC) is placed either in the first bed joint or between the bottom of the wall and its supporting base. The walls were placed on a concrete beam which was attached to a steel spreader beam which was in turn fixed to the floor; the vertical and horizontal loads were imposed 0
2 4 6 8 10 12 14 16 18
0.000 0.005 0.010 0.015 0.020 0.025
Compressive stress (MPa)
Axial strain (mm/mm)
Fig. 18.Compressive stress-strain curve of the masonry system.
0.0 0.5 1.0 1.5 2.0 2.5 3.0 3.5 4.0 4.5
0 5 10 15 20 25 30
Pressure (kPa)
Horizontal displacement (mm)
ExperimentalNumerical
[image:13.595.40.279.258.416.2]Fig. 19.Relationship between applied pressure and deflection at the centre of the main wall inner face: experimental and numerical.
[image:13.595.64.519.594.738.2]to the top of the walls via a spreader beamFig. 23. The loads were applied in two steps, initially a pre-compression vertical stress was applied which was kept constant during the tests, and then the walls were subjected to horizontal in-plane cyclic loads under dis-placement control. The wall considered for this study was sub-jected to 19 number of cycles,Fig. 24shows the load protocols applied to the top of the wall. For this study, a wall, which has been subjected to an initial vertical stress of 0.7 MPa, is considered. The wall is labelled as A3-1 in the experiments, in which a DPC layer has been placed in the bed joint between first and second course. The mechanical properties used in the numerical models were obtained either from the experimental results reported in[37]or calculated or assumed based on the relevant data available in the literature. The brick (Eu) and mortar (Em) elastic moduli were
calcu-lated based on their compressive strength values reported in the experiments, Eu was set as 300 times the brick compressive
strength and Em was set as 100 times the mortar compressive
strength based on the relations provided in[30]. The Poisson’s ratio
was assumed as 0.15 similar to the previous validation studies. Masonry elastic modulus (Eadj) was calculated by using Eq.(20).
The elastic stiffness of joint interfaces in the normal and shear directions (Knn,Kss andKtt) were calculated by using Eqs.(2) and
(3). The tensile bond strength of joints (tmax
n ) was calculated based
on the flexural bond strength (fmt) value reported in the
experi-ments, tmax
n was considered as one third of fmt as recommended
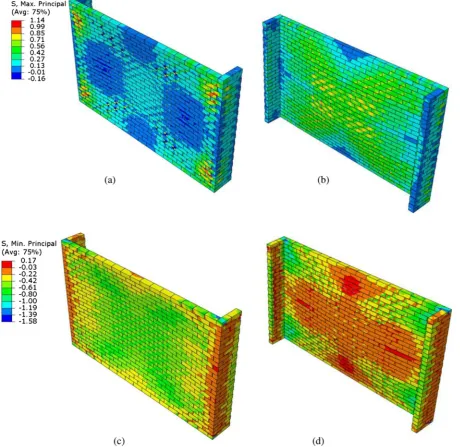
[image:14.595.74.535.75.522.2]in[33]. Similar toTable 5, the tensile fracture energy of the joint interfaces was set as 0.012 N/mm as recommended in [36]. The cohesion value of the joint interface was set as 0.64 MPa as reported in the experiment [37]. The shear fracture energy was considered as 0.04 N/mm, which was within the range of values recommended in [4]. The coefficient of friction was assumed as 0.75 similar to the previous validation studies. The mechanical properties of the units were assigned to be the same as the proper-ties presented in Table 6, assuming the same behaviour, as the units in both cases were Australian 10-hole clay bricks with the same dimensions. In the bed joint, where the DPC layer was laid, Fig. 21.Stress distributions in the walls at 28.73 mm deflection at the centre of the web (N/mm2
the mechanical properties were defined as follows; the coefficient of friction and the cohesion were set as 0.425 and 0.038 MPa, respectively, as reported in the experiments [37]. The ratio of 1.4 as the cohesion value to the tensile bond strength value was considered to define the tensile bond strength as implemented in [4]. The tensile and shear fracture energies were calibrated as 0.001 N/mm and 0.0038 N/mm, respectively. All mechanical prop-erties are summarised inTables 7–9.
The dilation angle (
w
), friction angles (b) and flow stress ratio (R) are defined as 11.3 degrees, 36 degrees and 1, respectively, for the Drucker Prager model. The compressive stress-strain curve Fig. 25was obtained based on[30] using the given value of thecompressive strength in the experiments and calculated masonry elastic modulus (Eadj).
3D eight node linear hexahedral brick elements were used to model the masonry wall, the side of each element was 303 mm, and the total number of elements in the mesh was 6720. The analysis was conducted in two steps. The initial vertical stress was applied to the top of the walls via a rigid body in the first step under load control. The rigid body was defined to simulate the top steel beam used in the experiments to distribute the stresses. In the second step, the cyclic in-plane load was subjected to the wall under displacement control via the rigid body, while the out of plane displacement and rotation were restrained. In addition, the initial vertical stress applied in the first step was kept constant. The computational time required was 552 min.
[image:15.595.39.276.65.287.2]The numerical results show a good agreement with the experi-mental results for both horizontal force-displacement relationship and failure modes. The experimental and numerical force-displacement patterns sufficiently match in terms of initial stiff-ness and non-linear behaviour. The non-linear behaviour of the wall was quasi ductile due the energy dissipated by the bed joint Fig. 22.Cracking status of masonry units (Partial cracking) at final loading stage,
[image:15.595.308.549.69.212.2]28.73 mm deflection at the centre of the main wall.
Fig. 23.Test setup of the walls (based on[37]).
-20 -15 -10 -5 0 5 10 15 20
0 2000 4000 6000 8000 10000
Horizontal displacement (mm)
Time (Sec)
[image:15.595.99.487.483.740.2]containing the DPC layer. However, it can be noted that the maxi-mum horizontal load attained in the experiment (45.53 kN) is rel-atively higher than the maximum load in the numerical model (38.94 kN), which indicates that the horizontal crack which propa-gated in the first bed joint occurred earlier in the numerical model than the experiment. After the propagation of the horizontal crack, the response of the model was governed by the proportional rela-tionship of the coefficient of friction to the normal compressive stresses in the first bed joint. Fig. 26 shows the comparison between the experimental and numerical responses.
In addition, the experimental results showed that the failure mode was due to formation of horizontal cracking along the first bed joint containing the DPC layer and subsequent sliding of the upper part of the wall over the first bed joint. Furthermore, vertical cracks occurred in the first course of the wall as a result of the cyc-lic sliding movements of the upper part of the wall over the first bed jointFig. 27(a). Similar failure modes were observed in the numerical resultsFig. 27(b) and (c). It is also worth mentioning that the numerical compressive stresses attained were below the compressive strength of the wall during all the cyclesFig. 28, sim-ilarly in the experiment no crushing under compression was observed.
5. Conclusions
[image:16.595.42.558.86.136.2]In this paper a combination of constitutive models has been employed together with the extended finite element method Table 8
Non-linear material properties for the joint interface for the wall tested under cyclic load.
Tension Shear Compression
tmax
n (MPa) (Calculated) GIC(N/mm)[36] c(MPa)[37] m,[28] GIIC(N/mm) (assumed based on[4]) rc(MPa)[37]
[image:16.595.42.559.179.219.2]0.20 0.012 0.64 0.75 0.040 14.18
Table 9
Non-linear material properties for the joint interface where the DPC layer presents i.e. in the bed joint between the first and second courses.
Tension Shear
tmax
n (MPa) (Calculated) GIC(N/mm) (Calibrated) c(MPa)[37] m,[37] GIIC(N/mm) (Calibrated)
[image:16.595.38.566.258.300.2]0.028 0.0010 0.038 0.425 0.0038
Table 7
Elastic properties of constitutive materials and joint interfaces for the wall tested under cyclic load.
Brick units Mortar Expanded units Joint interface
Eu(MPa)
(Calculated)
m
[28]
Em(MPa)
(Calculated)
Eadj(MPa) (from Eq.
(20))
Knn(N/mm3) (From Eq.
(2))
Kss(N/mm3) (From Eq.
(3))
Ktt(N/mm3) (From Eq.
(3))
5730 0.15 565 2888 63 25 25
0 2 4 6 8 10 12 14 16
0.000 0.010 0.020 0.030
Compressive strength (MPa)
Axial strain (mm/mm)
Fig. 25.Compressive stress-strain curve of the masonry walls.
-50 -40 -30 -20 -10 0 10 20 30 40 50
-20 -15 -10 -5 0 5 10 15 20
Horizontal load (kN)
Horizontal displacement (mm)
Experimental-50 -40 -30 -20 -10 0 10 20 30 40 50
-20 -15 -10 -5 0 5 10 15 20
Horizontal load (kN)
Horizontal displacement (mm)
Numerical
(a)
(b)
[image:16.595.52.287.301.487.2] [image:16.595.319.556.318.665.2](XFEM) to simulate 3D masonry structures using a simplified Micro-modelling approach. In the new approach progressive crack-ing and non-linear post-failure behaviour between the masonry joint interfaces were well-captured by using a cohesive, surface-based approach with a traction separation law. In addition, crack propagation within masonry units was identified by the novel use of XFEM without the pre-definition of crack location. The com-pressive failure of masonry was also included via a Drucker-Prager material constitutive model. Thus, all key local and global beha-viour and failure modes of masonry were captured. The capability of the proposed model was demonstrated by validation studies of
the response of masonry structures under monotonic in-plane, out-of-plane and in-plane cyclic loads, which were able to repro-duce experimentally observed behaviour with accuracy and with-out numerical convergence difficulties.
[image:17.595.74.509.67.591.2]procedure rather than relying on dynamic-explicit procedures that are onerous to use and interpret. The approach is also the first to cap-ture the cracking of masonry units without the need to specify crack locations in advance, thus removing the need to make significant assumptions, different for each possible load, that are inherent in the approaches available previously. However, the limitation of the proposed model in capturing the failure mode under out-of-plane loads is demonstrated by the fact that multiple distributed cracks rather than single cracks were predicted. This outcome may be due in part to the assumption of uniform properties for unit-mortar interfaces. Further study on the effect of the interface param-eters is required. Such further study could include random assign-ment of varying interface properties across the wall to simulate the variability that occurs in practice.
The approach opens the possibility of analysing complete masonry structures under complex load combinations. It also offers the possibility of examining the efficacy of strengthening systems when applied to masonry structures. Such systems typi-cally require consideration of 3D and out-of-plane behaviour for their effects to be fully captured, something that was previously not so readily possible to obtain numerically. This ability will allow the development and optimisation of strengthening systems with-out the need for extensive and expensive experimental pro-grammes. This line of research is being pursued by the authors.
Acknowledgements
The authors gratefully acknowledge the Research Impact Schol-arship (RIS) at the University of Manchester and the contribution of the University’s School of Mechanical, Aerospace and Civil Engi-neering (MACE) in funding this research.
References
[1]Roca P, Cervera M, Gariup G. Structural analysis of masonry historical constructions. Classical and advanced approaches. Arch Comput Methods Eng 2010;17(3):299–325.
[2]Lourenço PB. Experimental and numerical issues in the modelling of the mechanical behaviour of masonry. Struct Anal Hist Constructions Ii 1998:57–91.
[3] Pandey BH, Meguro K. Simulation of Brick masonry wall behavior under in plane lateral loading using applied element method. In: 13th World conference on earthquake engineering, Vancouver, BC, Canada; August. 2004.
[4]Lourenço PB. Computational strategies for masonry structures. TU Delft: Delft University of Technology; 1996.
[5] Arya S, Hegemier G. On non-linear response prediction of concrete masonry assemblies. In: North masonry conference Boulder. Colorado: Masonry Society; 1978.
[6]Page AW. Finite element model for masonry. J Struct Div 1978;104 (8):1267–85.
[7]Lotfi HR, Shing PB. Interface model applied to fracture of masonry structures. J Struct Eng 1994;120(1):63–80.
[8]Lourenço PB, Rots JG. Multisurface interface model for analysis of masonry structures. J Eng Mech 1997;123(7):660–8.
[9] Shing P, Cao L. Analysis of partially grouted masonry shear walls. US Department of Commerce, Gaithenburg, MD20899. NIST GCR; 1997. p. 97–710. [10] Sutcliffe D, Yu H, Page A. Lower bound limit analysis of unreinforced masonry
shear walls. Comput Struct 2001;79(14):1295–312.
[11] Citto C. Two-dimensional interface model applied to masonry structures. ProQuest; 2008.
[12]Kumar N, Amirtham R, Pandey M. Plasticity based approach for failure modelling of unreinforced masonry. Eng Struct 2014;80:40–52.
[13]Oliveira DV, Lourenço PB. Implementation and validation of a constitutive model for the cyclic behaviour of interface elements. Comput Struct 2004;82 (17):1451–61.
[14]Miglietta PC, Bentz EC, Grasselli G. Finite/discrete element modelling of reversed cyclic tests on unreinforced masonry structures. Eng Struct 2017;138:159–69.
[15]Kuang JS, Yuen Y. Simulations of masonry-infilled reinforced concrete frame failure. Proc Inst Civ Eng – Eng Comput Mech 2013;166(4):179.
[16]La Mendola L et al. Nonlinear FE analysis of out-of-plane behaviour of masonry walls with and without CFRP reinforcement. Constr Build Mater 2014;54:190–6.
[17]Aref AJ, Dolatshahi KM. A three-dimensional cyclic meso-scale numerical procedure for simulation of unreinforced masonry structures. Comput Struct 2013;120:9–23.
[18]Campilho RD, De Moura M, Domingues J. Using a cohesive damage model to predict the tensile behaviour of CFRP single-strap repairs. Int J Solids Struct 2008;45(5):1497–512.
[19] Camanho PP, Dávila CG. Mixed-mode decohesion finite elements for the simulation of delamination in composite materials; 2002.
[20] Benzeggagh M, Kenane M. Measurement of mixed-mode delamination fracture toughness of unidirectional glass/epoxy composites with mixed-mode bending apparatus. Compos Sci Technol 1996;56(4):439–49. [21]Belytschko T, Black T. Elastic crack growth in finite elements with minimal
remeshing. Int J Numer Meth Eng 1999;45(5):601–20.
[22]Melenk JM, Babuška I. The partition of unity finite element method: basic theory and applications. Comput Methods Appl Mech Eng 1996;139(1– 4):289–314.
[23]Moes N, Dolbow J, Belytschko T. A finite element method for crack growth without remeshing. Int J Numer Meth Eng 1999;46(1):131–50.
[24]Remmers J, de Borst R, Needleman A. A cohesive segments method for the simulation of crack growth. Comput Mech 2003;31(1–2):69–77.
[25]Drucker DC, Prager W. Soil mechanics and plastic analysis or limit design. Q Appl Math 1952;10(2):157–65.
[26]Lubarda VA, Mastilovic S, Knap J. Brittle-ductile transition in porous rocks by cap model. J Eng Mech 1996;122(7):633–42.
[27] ABAQUS, online documentation. SIMULIA Inc.; 2013.
[28] Raijmakers T, Vermeltfoort AT. Deformation controlled tests in masonry shear walls; 1992.
[29] Mosalam K, Glascoe L, Bernier J. Mechanical properties of unreinforced brick masonry section-1. Documented to US Department of Energy by Lawrence Livermore National Laboratory; 2009.
[30] Kaushik HB, Rai DC, Jain SK. Stress-strain characteristics of clay brick masonry under uniaxial compression. J Mater Civ Eng 2007;19(9):728–39.
[31]Griffith M, Vaculik J. Out-of-plane flexural strength of unreinforced clay brick masonry walls. TMS J 2007;25(1):53–68.
[32]Standard B. Eurocode 6—design of masonry structures—. London: British Standard Institution; 2005.
[33]Milani G, Lourenço P, Tralli A. Homogenization approach for the limit analysis of out-of-plane loaded masonry walls. J Struct Eng 2006;132(10):1650–63. [34] Willis C, Griffith M, Lawrence S. Horizontal bending of unreinforced clay brick
masonry. British Masonry Society; 2004.
[35] Willis C, Griffith M, Lawrence S. Implications of recent experimental and analytical studies for the design of face-loaded URM walls. In: Proceedings of the 7th Australasian masonry conference. University of Newcastle; 2004. [36] Angelillo M, Lourenço PB, Milani G. Masonry behaviour and modelling. In:
Mechanics of masonry structures. Springer; 2014. p. 1–26.
[image:18.595.49.284.67.335.2][37] Mojsilovic´ N, Simundic G, Page A. Static-cyclic shear tests on masonry wallettes with a damp-proof course membrane, vol. 319. ETH Zurich; 2009.
![Fig. 16. Wall configuration (based on [31]).](https://thumb-us.123doks.com/thumbv2/123dok_us/9434131.450055/11.595.85.496.72.301/fig-wall-conguration-based-on.webp)