warwick.ac.uk/lib-publications
Manuscript version: Author’s Accepted Manuscript
The version presented in WRAP is the author’s accepted manuscript and may differ from the
published version or Version of Record.
Persistent WRAP URL:
http://wrap.warwick.ac.uk/123281
How to cite:
Please refer to published version for the most recent bibliographic citation information.
If a published version is known of, the repository item page linked to above, will contain
details on accessing it.
Copyright and reuse:
The Warwick Research Archive Portal (WRAP) makes this work by researchers of the
University of Warwick available open access under the following conditions.
Copyright © and all moral rights to the version of the paper presented here belong to the
individual author(s) and/or other copyright owners. To the extent reasonable and
practicable the material made available in WRAP has been checked for eligibility before
being made available.
Copies of full items can be used for personal research or study, educational, or not-for-profit
purposes without prior permission or charge. Provided that the authors, title and full
bibliographic details are credited, a hyperlink and/or URL is given for the original metadata
page and the content is not changed in any way.
Publisher’s statement:
Please refer to the repository item page, publisher’s statement section, for further
information.
A statistically significant lack of debris discs in medium
separation binary systems
Ben Yelverton
1
?
, Grant M. Kennedy
2
,
3
, Kate Y. L. Su
4
and Mark C. Wyatt
1
1Institute of Astronomy, University of Cambridge, Madingley Road, Cambridge CB3 0HA, UK 2Department of Physics, University of Warwick, Gibbet Hill Road, Coventry CV4 7AL, UK
3Centre for Exoplanets and Habitability, University of Warwick, Gibbet Hill Road, Coventry CV4 7AL, UK 4Steward Observatory, University of Arizona, 933 N Cherry Avenue, Tucson, AZ 85721, USA
Accepted XXX. Received YYY; in original form ZZZ
ABSTRACT
We compile a sample of 341 binary and multiple star systems with the aim of searching for and characterising Kuiper belt-like debris discs. The sample is as-sembled by combining several smaller samples studied in previously published work with targets from two unpublishedHerschel surveys. We find that 38 sys-tems show excess emission at 70 or 100 µm suggestive of a debris disc. While nine of the discs appear to be unstable to perturbations from their host binary based on a simple analysis of their inferred radii, we argue that the evidence for genuine instability is not strong, primarily because of uncertainty in the true disc radii, uncertainty in the boundaries of the unstable regions, and orbital projec-tion effects. The binary separaprojec-tion distribuprojec-tions of the disc-bearing and disc-free systems are different at a confidence level of99.4%, indicating that binary sep-aration strongly influences the presence of detectable levels of debris. No discs are detected for separations between ∼25 and 135 au; this is likely a result of binaries whose separations are comparable with typical disc radii clearing out their primordial circumstellar or circumbinary material via dynamical perturba-tions. The disc detection rate is19+5−3%for binaries wider than 135 au, similar to published results for single stars. Only8+2−1% of systems with separations below 25 au host a detectable disc, which may suggest that planetesimal formation is inhibited in binaries closer than a few tens of au, similar to the conclusions of studies of known planet-hosting binaries.
Key words: circumstellar matter – binaries: general
1 INTRODUCTION
The planet formation process, characterised by the ac-cumulation of micron-sized dust particles in the proto-planetary disc into increasingly large bodies, produces a population of planetesimals with sizes of order 1–1000 km (Johansen et al. 2014). The primordial dust is expected to be removed from the disc by Poynting-Robertson (PR) drag within a few Myr (Wyatt et al. 2015), leaving behind these larger bodies. Yet, a significant proportion of stars older than ∼10 Myr show excess flux at infrared wave-lengths, which is generally interpreted as thermal emis-sion from circumstellar dust which has been heated by the stellar radiation (e.g. Aumann et al. 1984; Oudmai-jer et al. 1992; Mannings & Barlow 1998). Rather than being primordial, the dust responsible for this emission is
? E-mail: [email protected]
understood to be continuously replenished by destructive collisions between the planetesimals (Backman & Paresce 1993;Dominik & Decin 2003).
These discs of planetesimals and the products of their collisions are known asdebris discs, and can be dis-tinguished observationally from primordial dust discs by their relatively low fractional luminosities (e.g. Hughes et al. 2018). Importantly, an infrared excess correspond-ing to a debris disc in a given system acts as a signpost that the process of planet formation was able to proceed to a significant degree in that system. The proportion of stars with detected debris discs has been estimated at around 25% for A and F type stars, and close to 15% for G and K types (Su et al. 2006;Hillenbrand et al. 2008;
Trilling et al. 2008;Eiroa et al. 2013;Sierchio et al. 2014;
Thureau et al. 2014;Sibthorpe et al. 2018).
Binary and higher-order multiple stars make up a large fraction of all known star systems; for example,
Raghavan et al.(2010) estimate that 44% of FGK stars have at least one stellar companion (see alsoDuquennoy & Mayor 1991;Eggleton & Tokovinin 2008;Duchˆene & Kraus 2013). Planets do not appear to be uncommon in such systems, with Horch et al.(2014) concluding that
∼40–50% ofKeplerplanet hosts are binaries, comparable with the binary fraction of field stars. Similarly, Arm-strong et al. (2014) used Kepler data to infer that the occurrence rate of circumbinary planets with radii above 6R⊕ and periods less than 300 d is consistent with
sin-gle star rates. However, the planet occurrence rate is strongly dependent on stellar separation. For example,
Kraus et al. (2016) estimated that binaries closer than
∼50 au are around a third as likely as wider systems to host a planet. Thus, it is important to consider the prob-lem of how planetary systems form and evolve around bi-nary systems. Knowledge of the properties of debris discs in binary systems, and how they depend on the stellar orbits, can contribute to our understanding of how often, and where, we expect planetesimals to be able to form therein, with implications for planets.
Several previous works have addressed this issue.
Trilling et al.(2007) observed 69 AFGK binary and mul-tiple systems with the Multiband Imaging Photometer
for Spitzer (MIPS; Rieke et al. 2004), to search for
ex-cess emission at 24 and 70 µm. Considering as ‘excesses’ measurements at least 2σabove the expected stellar flux, they found a rather high overall disc detection fraction of around 40%. Their results also suggested that binaries with orbital separations of 3–50 au were less likely to host a disc than those with closer or wider separations, with the explanation that such binaries have separations com-parable to typical debris disc radii, such that planetesi-mals in those systems would tend to be in an unstable location. Nonetheless, three of their excesses implied the presence of dust in dynamically unstable regions (Holman & Wiegert 1999), and they proposed that these could be explained as dust migrating inwards from a stable region due to PR drag. However, this mechanism likely cannot provide a general explanation for detectable levels of ap-parently unstable dust, as dust grains in detectable debris discs are expected to be removed via collisional evolution and radiation pressure on time-scales faster than PR drag can act (Wyatt 2005).
Rodriguez & Zuckerman (2012) approached the problem differently, starting by gathering a sample of 112 (largely AFGK) stars thought to host discs based on pre-vious work, and found that 28 of them belonged to a bi-nary or multiple system. The distribution of separations of the binaries in their sample showed fewer systems in the 1–100 au range than would be expected for a ran-domly selected sample, again suggesting that ‘medium’ separation binaries are less likely to host discs.
The most extensive study of debris discs in binary and multiple systems performed to date has been that of
Rodriguez et al.(2015). They started with a volume lim-ited sample of 449 AFGKM stars observed byHerschelas part of the DEBRIS programme (Matthews et al. 2010), of which they identified 188 as belonging to a binary or multiple system. Combining 100 and 160 µm photom-etry from Herschel’s Photodetector Array Camera and Spectrometer (PACS;Poglitsch et al. 2010) with archival
photometry at other mid to far infrared wavelengths, and using a 3σexcess criterion, they found a low overall disc detection rate of around 11% for the binaries and mul-tiples versus 21% for the single stars in their sample, in contrast to the results of Trilling et al. (2007). Superfi-cially, their results suggested that binaries with periods of around103–105 d (corresponding to semimajor axes of around 1–50 au for Sun-like stars, which make up the ma-jority of their sample) are less likely to host debris discs, similar to the conclusions of previous work. However, us-ing a Kolmogorov-Smirnov (KS) test, they demonstrated that the period distributions of their disc-bearing and disc-free binaries and multiples were not, in fact, differ-ent in a statistically significant way (with a p-value of 0.09).
In this paper, we compile a large sample of binary and multiple systems which have photometric measure-ments in the far infrared, comprising systems drawn from several sources. Our sample consists of most of the sys-tems analysed by Trilling et al. (2007), Rodriguez & Zuckerman (2012) and Rodriguez et al. (2015), with the addition of systems from two unpublishedHerschel
surveys:OT2_gkennedy_2, which targeted visual binaries with well known orbits, andOT1_jdrake01_1, which tar-geted close binaries. Considering overlap between the var-ious sources, there are 341 unique systems in the full sam-ple. We aim to use this sample to quantify the incidence and properties of debris discs in binary and multiple sys-tems with higher statistical significance than has been possible in previous work.
We expect such a result to be possible firstly because we simply have a larger sample, and secondly because of the inclusion of theOT2_gkennedy_2systems in particu-lar. As they have well known orbits, their semimajor axes are in the 1–50 au range (for wider binaries, observations spanning a very long time period would be required to deduce their orbits precisely). Thus, these systems lie in the separation range of greatest interest, where previous work suggests that the separation distributions of disc-bearing and disc-free systems may differ. The inclusion of the OT2_gkennedy_2 data also allows us to examine separately those systems whose orbits are well known.
For our analysis, we gather archival photometry for each system to create spectral energy distributions (SEDs), then model these in search of 3σ excesses in
Spitzer 70 µm and Herschel 70 and 100 µm
photome-try characteristic of cool debris. Although broadly simi-lar SED modelling of many of our systems has been per-formed in previous studies, analysing our sample as a whole rather than relying on the results of previous work removes any issues of inconsistency – for example,Trilling et al.(2007) used 2σas their excess threshold while Ro-driguez et al.(2015) used 3σ.
about close binaries from the OT1_jdrake01_1data. We present our overall conclusions in section6.
2 THE SAMPLE
This section explains how our sample of binary and mul-tiple star systems was compiled, before briefly presenting the orbital and stellar properties of the sample as a whole. As the aim of this paper is to search for and characterise excesses in the far infrared, where debris disc emission typically peaks, we compile systems that have been ob-served at 70 µm by MIPS or at 70 and/or 100 µm by PACS.
First, we include all 34 systems targeted by the
Her-schel survey OT2_gkennedy_2. All were observed at 70
and 160 µm by PACS. The bulk of these systems were drawn from the Sixth Catalog of Orbits of Visual Bi-nary Stars (VB6;Hartkopf et al. 2001). This survey aimed to obtain observations of binaries whose orbits are well known, and so systems with highly graded orbital solu-tions in VB6 (grade 1, ‘definitive’, or grade 2, ‘good’) were chosen. The list of targets was narrowed by retain-ing only those stars with spectral types AFG and lumi-nosity classes V or IV-V, and within a distance of 40 pc. Further exclusions were made of stars with non-main se-quence positions on a Hertzsprung-Russell diagram, and one system lying in the galactic plane. In addition, we excluded systems with existing far infrared observations: several with PACS observations from other programmes, one (HD 26690) with a MIPS 70µm observation from
Trilling et al. (2007) suggesting a lack of dust, and two (HD 40183 and HD 155125) with constraints from the
Infrared Astronomical Satellite (IRAS).
The resulting sample contains 27 systems. Of the remaining seven targets in the programme, three (HD 46273, HD 80671 and HD 127726) are those sys-tems suggested by Trilling et al.(2007) to harbour un-stable dust, and were included with the aim of resolving the proposed discs. The final four (HD 31925, HD 95698, HD 173608 and HD 217792) are systems with dust tem-peratures which were poorly constrained based on the data ofTrilling et al.(2007), and were included to allow us to better characterise their possible excesses with the addition of 160 µm photometry.
To these we add the 51 systems observed at 70 and 160 µm by PACS as part of the Herschel survey
OT1_jdrake01_1. This survey was motivated by the work ofMatranga et al.(2010), which suggested that∼20–30% of close binaries host large amounts of very warm dust (with temperatures above∼1000 K), and interpreted this dust as a possible product of collisions between planetary bodies that have been destabilised by long-term changes in the binaries’ orbits. The OT1_jdrake01_1survey was designed to be complementary to that work: it aimed to search for cooler dust components around close bina-ries in order to build a more complete picture of their typical planetary systems (Drake 2010). As this cooler dust is indicative of a more typical debris disc scenario in which ongoing collisions between planetesimals replenish the dust – and to our knowledge there exists no published
analysis of these data – we include these systems in our sample.
We also include almost all of the binary and multi-ple systems studied by Trilling et al. (2007),Rodriguez & Zuckerman (2012) and Rodriguez et al. (2015). The total numbers of binaries and multiples considered in each of those works are 69, 28 and 188 respectively. There is some overlap between the various samples: 15 systems appear in two of the previously mentioned studies, and two systems appear in all three. Addition-ally, nine systems from OT2_gkennedy_2 and one from
OT1_jdrake01_1 (HD 118216) are in the Trilling et al.
(2007) sample. There is also the special case of HD 131976 (inOT1_jdrake01_1) and HD 131977 (inRodriguez et al. 2015): the latter is the primary star of the system GJ 570, while the former is the secondary component, itself a spectroscopic binary (see e.g. VB6). Since for most bi-nary and multiple systems we do not have separate far in-frared observations of each component, for consistency we discard the secondary, HD 131976, from our sample; for completeness, we note that its SED does not show an in-frared excess. We exclude also six systems fromRodriguez & Zuckerman (2012) – HD 1051, HD 8538, HD 125473, HD 138749, HD 150378 and HD 169022 – as these only appear to have been observed in the far infrared byIRAS. Owing to the low spatial resolution ofIRAS, its photom-etry is prone to contamination from background sources, so that any apparentIRAS excess without confirmation by MIPS or PACS would be somewhat less believable. A further two systems are excluded from Trilling et al.
(2007) – HD 61497 and HD 111066 – since they were observed only at 24 µm during the survey presented in that paper and have not since been followed up at longer wavelengths by either MIPS or PACS.
Finally, we add the following nine systems with highly graded VB6 orbits to the sample. HD 128620 was observed as part of the DEBRIS survey, and HD 48915 as part ofHerschel calibration; both would have been tar-geted byOT2_gkennedy_2if not for these existing obser-vations1. The systems HD 15285, HD 79969, HD 115953, HD 148653, HD 165341, HD 184467 and HD 196795 were observed by PACS as part of the DUNES survey (Eiroa et al. 2010). All are of spectral type K or M, and therefore, despite their well known orbits, would not have been in-cluded inOT2_gkennedy_2even if they had not been tar-geted by DUNES. Nonetheless, as we are not requiring that our whole sample be composed only of AFG stars, we include them in our analysis.
The resulting full sample contains 341 unique sys-tems. The stars in the sample are largely primaries, but two of them are secondaries. The first is HD 137392, which was targeted byOT2_gkennedy_2instead of its pri-mary HD 137391 because the BaBb orbit of that system, butnot the AB orbit, is highly graded in VB6. The sec-ond is HD 14082B, which was included in the sample of
Rodriguez & Zuckerman (2012) since it is known that
1 Since we ultimately chose to focus on MIPS and PACS data,
the secondary hosts a detectable disc while the primary HD 14082A does not. We note that an alternative ap-proach to constructing a sample of binaries would be to useGaiaData Release 2 (Gaia Collaboration et al. 2018) astrometry to make a list of pairs of stars with common proper motion. However, for this study we require stars which have been observed in the far infrared, which would not generally be the case for the proposedGaia sample. Conversely, for those systems which do not have well-characterised orbits – which constitute the majority of the sample, as discussed below – one might hope to use the Gaia proper motions to confirm or refute their bi-nary nature. We do not, however, attempt to do so, since the stars we will study are generally bright, with over half of the sample having a V-band magnitude below 6, where Gaia astrometry can be unreliable (Lindegren et al. 2018).
As we are interested in how the presence of debris de-pends on the stellar orbits, for each system in our sample we record the stellar separationsaand, where available, orbital eccentricities e; this information is presented in Table1. Systems containing three or more stars have two or more separations. For the systems fromTrilling et al.
(2007), Rodriguez & Zuckerman (2012) and Rodriguez et al.(2015), we mostly use the values given in those pa-pers; their separations are not necessarily true semimajor axes, but in many cases projected separations. Of these systems, for those which appear in the VB6 catalogue with grade 1 or 2 we preferentially use the VB6 values – the separations of these systems are true semimajor axes and can be considered well known. In some cases, the orbits given in the paper from which we took a system are incomplete; where possible, we supplement these with VB6 elements, even if they are poorly graded. For exam-ple, the triple system HD 196885 is listed inTrilling et al.
(2007) as having a separation of19000. This is for the or-bit of the AB pair, and VB6 gives an additional grade 5 orbit for the AaAb pair with a separation of0.6400, which we record for completeness. In addition, HD 181296 is listed with only one separation (199 au) inRodriguez & Zuckerman (2012). This is in fact a triple system, with the more distant companion being HD 181327, and as the system does not appear in VB6 we take the wider separation (∼2×10⁴au) fromTokovinin(2018).
To convert the VB6 angular separations into phys-ical separations, we mainly use parallaxes from Hippar-cos (van Leeuwen 2007)2. For the OT2_gkennedy_2 sys-tems – other than those which were re-observations of theTrilling et al.(2007) survey – we use VB6 orbital ele-ments, since by construction they are highly graded. For theOT1_jdrake01_1systems, we first find orbital periods, mostly from the Ninth Catalogue of Spectroscopic Binary Orbits (SB9;Pourbaix et al. 2004)3. We estimate their lu-minosities L from SED fitting (see section3for details),
2 For systems not in theHipparcoscatalogue, we mostly use
parallaxes fromGaiaData Release 2 (Gaia Collaboration et al. 2018). For the few systems which appear in neither catalogue, we source parallaxes fromHarrington & Dahn(1980), Geyer et al. (1988), van Altena et al.(1995), Costa et al. (2005),
Henry et al.(2006) andTorres et al.(2010).
3 For the seven systems not listed in SB9, we source
peri-10-3 10-2 10-1 100 101 102 103 104 105 106 a/au
0 5 10 15 20 25 30 35 40
C
ou
nt
[image:5.612.327.551.65.216.2]A F G K M
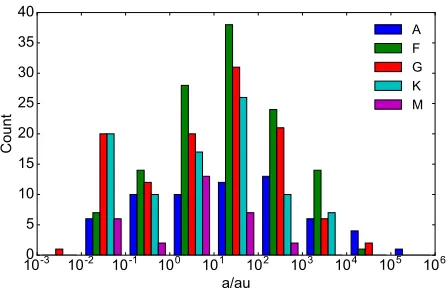
Figure 1.Distribution of stellar separations in our sample, binned by order of magnitude in separation and split by spec-tral type. Though there is some variation in the proportions of each spectral type between bins, the sample is largely Sun-like across the full range of separations.
calculate approximate massesMassumingL∝M3.5, then use these to estimate stellar separations from the periods. The make-up of our sample is outlined in Fig. 1, which shows the distribution of stellar separations for each spectral type. The spectral types are derived by binning the stars by their effective temperatureT from SED fitting (again, see section 3 for details), withT >
7500 Kclassified as type A, 6000 K<T <7500 Kas F,
5200 K<T <6000 Kas G, 3700 K<T <5200 Kas K, andT <3700 Kas M. Systems of three or more stars, and thus two or more separations, are counted multiple times. Note that the bimodality of the distribution is not repre-sentative of binary and multiple systems generally, but is largely the result of having included a significant number of binaries (from OT1_jdrake01_1) targeted specifically because they are close.
Given that stellar ages are typically highly uncertain, in this paper we do not attempt to study disc properties as a function of age. As none of the samples from which we assembled our overall sample were selected based on age, in what follows we assume that stars of each spectral type have ages uniformly distributed up to the typical main-sequence lifetime of that type. Fig. 1 shows that the sample is dominated by FGK stars, so we expect the average age of the systems we are studying to be a few Gyr.
To summarise, we have assembled a sample of 341 binary and higher order star systems and compiled infor-mation on their stellar separations; in most cases these are projected separations taken from the literature. We define a ‘known orbit’ subsample consisting of all systems with at least one highly graded VB6 orbit and whose separations are therefore true semimajor axes; there are 89 such systems. For statistical analysis, care must be taken to avoid bias with respect to disc detection. Since
Rodriguez & Zuckerman(2012) studied only systems
al-ods from the Multiple Star Catalog (Tokovinin 2018),Balona
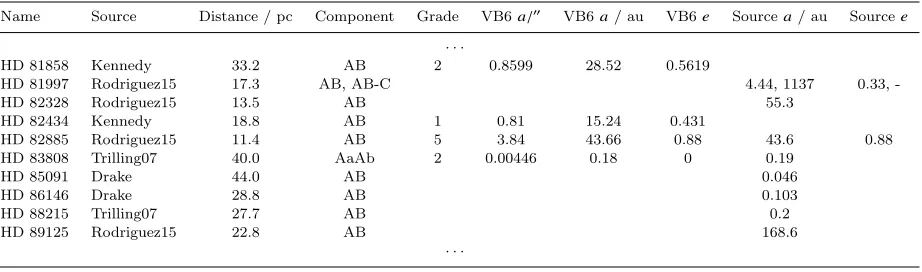
Name Source Distance / pc Component Grade VB6a/00 VB6a/ au VB6e Sourcea/ au Sourcee
· · ·
HD 81858 Kennedy 33.2 AB 2 0.8599 28.52 0.5619
HD 81997 Rodriguez15 17.3 AB, AB-C 4.44, 1137 0.33,
-HD 82328 Rodriguez15 13.5 AB 55.3
HD 82434 Kennedy 18.8 AB 1 0.81 15.24 0.431
HD 82885 Rodriguez15 11.4 AB 5 3.84 43.66 0.88 43.6 0.88
HD 83808 Trilling07 40.0 AaAb 2 0.00446 0.18 0 0.19
HD 85091 Drake 44.0 AB 0.046
HD 86146 Drake 28.8 AB 0.103
HD 88215 Trilling07 27.7 AB 0.2
HD 89125 Rodriguez15 22.8 AB 168.6
[image:6.612.72.533.62.198.2]· · ·
Table 1.Information on the orbits of the binaries and multiple systems in our sample. The columns from left to right show the name of each system; its ‘source’, i.e. the paper or programme from which we took the system (see text of section2for details); its distance, calculated as the reciprocal of the parallax; the names of the components that the given orbits refer to; the VB6 orbit grades, semimajor axes and eccentricities where available; and the separations and eccentricities given in the source where available. For systems from theOT1_jdrake01_1programme, the ‘source’ separations are the values that we estimated from their periods, as detailed in section2. Here we display a ten-line excerpt chosen to show systems from a variety of sources; the full 341-line table is available online in machine-readable form.
ready thought to host discs, we will also define a ‘sta-tistical’ subsample consisting of all systemsexcept those taken from that paper. This subsample contains 328 sys-tems (see section4.4).
Having established the systems to be studied in this paper, in the following section we outline our analysis of their SEDs and how we use these to determine whether a debris disc is present.
3 SED MODELLING
Our initial aim is to establish whether or not each sys-tem in our sample hosts a detectable debris disc. This is equivalent to asking whether its SED indicates an ex-cess of flux at infrared wavelengths, beyond what would be expected for a purely stellar source. To answer this, we first gather archival photometry for each system to create SEDs. The photometry available varies between systems, but all SEDs have a range of points spanning visible to far infrared wavelengths. By construction of the sample, all have a MIPS 70 µm, PACS 70µm and/or PACS 100µm observation; Table2shows the photometry we use in these bands. For PACS photometry, we use our own flux measurements mostly from point spread func-tion (PSF) fitting, and from aperture photometry for sys-tems with resolved discs (such as HD 95698, as discussed in appendixA), as outlined in e.g.Sibthorpe et al.(2018). For MIPS, we use photometry from the literature in some cases, but for most systems we make our own up-dated flux measurements. The general procedure is out-lined in Sierchio et al. (2014), where PSF photometry is used for unresolved sources. Since most of the MIPS observations were taken at both 24 and 70 µm, we gen-erally use the MIPS 24 µm data to guide the position of the 70µm detection. For sources not detected at 70 µm, we place an aperture at the 24 µm position to estimate the flux. As a result, such sources can have negative flux due to complex background structure and instrumental artefacts. Due to the large beam size of the MIPS 70µm
channel, in some cases only one MIPS 70 µm flux is ex-tracted even if there are two MIPS 24 µm sources near the same position.
To each SED, we then fit a model with both a stellar and a dust component, using theMultiNestalgorithm (Feroz et al. 2009)4. For the stellar component, we use
PHOENIX BT-Settl models (Allard et al. 2012) with stellar abundances fromAsplund et al. (2009), as these are available over a wide range of parameters. Although some binaries will be sufficiently close that both stars contribute to the total measured flux, in all cases we fit only a single stellar component. We do not expect this simplification to affect our results significantly, because if the stars have different spectral types then the primary star will dominate the emission so that the secondary can be ignored. If both stars are of the same spectral type and thus both contribute significantly to the total flux, then the overall spectrum will be well approximated by a single star of the same spectral type. In addition, most systems have multiple mid infrared flux measure-ments, meaning that the Rayleigh-Jeans tail – the part of the stellar spectrum that will be compared with the measured far infrared flux to search for an excess – will be well constrained regardless of the details of the stellar model. We model the dust as a modified black body – i.e. its emission is given by a black body function multiplied by a factor(λ0/λ)β for wavelengthλ > λ0, withλ0 andβ
(as well as the dust temperature and luminosity) as free parameters. Physically, this extra factor accounts for the fact that the disc emission originates from a distribution of dust grain sizes, with grains emitting less efficiently at wavelengths larger than their own size. We model a single system, HD 95698, with two separate dust com-ponents (see e.g.Kennedy & Wyatt 2014), as this gives a significantly better fit to itsSpitzer Infrared Spectro-graph (IRS;Houck et al. 2004) spectrum.
4 Our SED fitting software,
MIPS 70µm PACS 70µm PACS 100µm
Name Fν,obs σobs Fν,pred χ Fν,obs σobs Fν,pred χ Fν,obs σobs Fν,pred χ
/ mJy / mJy / mJy / mJy / mJy / mJy / mJy / mJy / mJy
· · ·
HD 81858 20.5 21.59 1.71 21.64 -0.03 10.67
HD 81997 33.84 3.58 31.79 0.57 33.56 16.16 2.65 16.46 -0.11
HD 82328 143.6 10.21 132.05 1.12 139.39 69.55 4.09 68.37 0.29
HD 82434 78.06 5.32 70.14 1.43 79.07 2.75 74.06 1.55 36.72
HD 82885 -87.13 51.73 28.39 -2.23 29.97 12.53 1.79 14.79 -1.26
HD 83808 90.24 5.41 90.2 0.01 95.22 46.99
HD 85091 3.55 3.82 2.17 3.75 0.03 1.85
HD 86146 21.4 4.68 19.89 0.32 20.65 1.97 21 -0.18 10.34
HD 88215 22.25 3.63 13.13 2.5 13.86 6.81
HD 89125 22.76 12.71 12.5 0.81 13.19 5.64 2.13 6.46 -0.38
[image:7.612.82.558.64.237.2]· · ·
Table 2.Photometry in the MIPS 70µm, PACS 70µm and PACS 100µm bands for all systems in our sample. For each band, the columns show the observed flux density, its associated uncertainty, the predicted photospheric flux density, and the significance as defined in equation (1). For consistency, here we display the data for the same ten systems as in Table1; the full 341-line table is available online in machine-readable form.
Our approach differs slightly from the most common method of SED fitting, which is to choose some cut-off wavelength (∼10 µm), first using all photometry at shorter wavelengths to fit the stellar component, then ex-trapolate the resulting stellar model to far infrared wave-lengths. The choice of cut-off wavelength could, however, affect the stellar model, for example if warm dust were present in a system, resulting in excess mid infrared flux. Fitting the stellar and dust components simultaneously allows us to obtain a far infrared photospheric flux pre-diction without the need to choose a cut-off wavelength. Most of the ‘dust’ components will in fact be insignificant – that is, consistent with zero emission, and barely con-tributing to the total flux. However, for systems whose excesses we concludearesignificant, the dust model can then be used to characterise the inferred debris disc.
Thus, it must next be decided whether each SED should be considered to show a significant excess of in-frared emission. We choose to focus only on excesses at 70 and 100 µm, corresponding to typical dust tempera-tures of order 30–200 K. It is possible for systems to host warmer dust, which would be better searched for at mid infrared wavelengths. However, such warm dust cannot generally be a direct tracer of planetesimal belts in the same way as the cooler dust that we are searching for. This is because a belt of planetesimals at the inferred distance of the warm dust should generally have colli-sionally depleted to below observable levels on a short time-scale (e.g.Wyatt 2008). It has been suggested that warm dust could either have originated from planetesi-mals scattered inwards from a more distant belt (Wyatt et al. 2007) or in situ from collisions between planetary embryos (Rhee et al. 2008). Systems with excesses in the mid infrared only are rare (e.g. HD 69830: Lisse et al. 2007;Marshall et al. 2014). Note that BD+20 307, which is well known to host warm dust (Song et al. 2005), is in our sample, though this system also has an excess of far infrared emission. The key point is that warm dust and cool dust can be regarded as distinct phenomena,
0 5 10
15 MIPS 70
σχ= 1. 58
χ0= 0. 26
Excluding OT1_jdrake01_1
0 2 4 6 8 10
PACS 70
σχ= 0. 94
χ0= - 0. 11
−4 −2 0 2 4 6 8 10
χ 0
5 10 15 20
C
ou
nt
PACS 100
σχ= 1. 22
χ0= - 0. 01
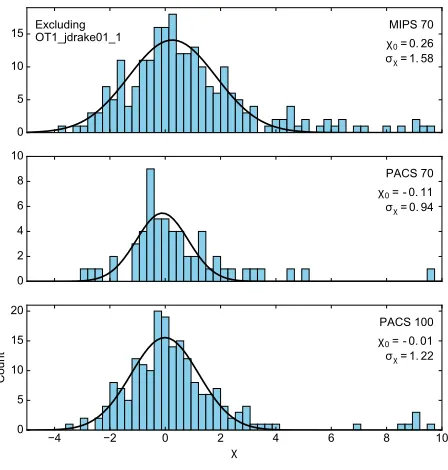
Figure 2.Distributions of photometric significanceχ(bars) for all systems in our sample other than those from the OT1_jdrake01_1survey, with best fitting Gaussians (curves) overplotted. Values ofχ greater than 10 are not shown. The upper, middle and lower panels show photometry from the MIPS 70µm, PACS 70µm and PACS 100µm bands respec-tively. The annotations display the means χ0 and standard
deviationsσχ of the Gaussian fits.
[image:7.612.328.552.309.544.2]−4 −2 0 2 4 6 8 10 χ
0 1 2 3 4 5 6
C
ou
nt
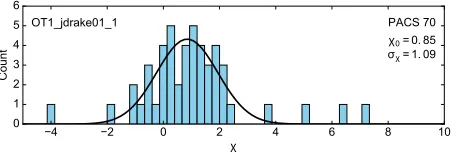
PACS 70
σχ= 1. 09
χ0= 0. 85
[image:8.612.49.276.66.146.2]OT1_jdrake01_1
Figure 3. Same as Fig. 2, but only for systems from the
OT1_jdrake01_1 survey. Only PACS 70 µm photometry is
shown, as only two of these systems have MIPS 70 µm ob-servations and none have PACS 100µm observations.
A useful measure of the significance of an excess at a given wavelengthλis the quantity χ, defined as:
χ= Fqν,obs−Fν,pred
σ2 obs+σ
2 pred
, (1)
where Fν,obs is the observed flux density at
wave-lengthλ,Fν,predis the flux density expected based on the best fitting stellar model alone, and σobs and σpred are
the associated uncertainties. The values ofFν,pred and χ in the three far infrared bands we are focusing on are shown in Table2, along with the measured photometry. For almost all systems, the σpred values (which are not shown) are around 1% ofFν,pred. For a given band,
assum-ing no systematic offsets and accurately estimated uncer-tainties, the χ values for an unbiased set of observations would be expected to follow a near Gaussian distribution with mean χ0 = 0 and standard deviationσχ = 1, with
any observations with χ >3considered to represent sig-nificant excesses. A relatively small proportion of stars host detectable levels of debris – around 20% for single stars, as discussed in section1– hence the approximately Gaussian shape. In practice, we will use the observed χ distributions to define our excess criterion, as doing so automatically accounts for underestimated or overesti-mated uncertainties and systematic effects – issues which may not be apparent when fitting individual SEDs.
In Fig. 2, we show χ distributions for the three bands in which we will search for excesses, along with the best fitting Gaussians calculated using the least squares method. Note that this Figure excludes systems from the
OT1_jdrake01_1survey; we find that the significances for those systems are distributed quite differently to the rest of the sample, and will therefore treat them separately (see below). Fig. 2shows that for MIPS 70 µm, and to a lesser extent PACS 100µm, theχ distributions for the bulk of the sample are somewhat broader than expected, withσχ >1. This suggests that the uncertainties on ei-ther the predicted or observed fluxes in those bands have been underestimated. It could be the case that our es-timates of the repeatability of the observations, particu-larly for MIPS 70 µm, are simply too optimistic. Some other possible explanations for the broadness of the dis-tributions lie in the fact that our sample is comprised of binaries: firstly, the fact that we model each system with only a single stellar component could introduce extra
un-certainty on the model fluxes. Secondly, some systems will have angular separations such that they are resolved into individual components at optical wavelengths, but not in the far infrared by MIPS and PACS due to the relatively large beam sizes of these instruments. Thus, some subset of systems will appear to have higher far infrared signif-icances than they really do – an effect which will tend to both broaden and positively offset the χdistributions. At 1800, the MIPS 70 µm beam size is the largest of the three far infrared bands, so this resolution effect should have the greatest impact on the MIPS 70µm significance distribution, consistent with Fig.2.
In Fig.3, we plot the PACS 70µmχdistribution for theOT1_jdrake01_1systems alone; there are insufficient data in the other two bands to make useful histograms for these systems. This distribution has a large positive offset
χ0 = 0.85, which is not present in the rest of the sample
(cf. Fig. 2). Matranga et al. (2010) observed that close binaries often have warm infrared excesses, which are not due to debris discs in the typical sense, and the offset we observe in theOT1_jdrake01_1PACS data could be related to that phenomenon (see section5.3).
To account for the different spreads and offsets of the distributions, for the bulk of the sample, we require a sys-tem to have χ > χ0+ 3σχin at least one of MIPS 70µm, PACS 70µm and PACS 100µm for its excess to be con-sidered significant. We additionally require that χ >3, since if this is not satisfied then the dust temperature of the model will be poorly constrained by the SED fitting. This second criterion is only relevant to PACS 70µm, as the other two bands have χ0+ 3σχ >3. In practice,
re-quiringχ >3only eliminates a single system which would otherwise be considered to host a disc: HD 81809, which has χ = 2.90 in PACS 70 µm. For the OT1_jdrake01_1
systems, we search only for PACS 70µm excesses, using the same criteria but different distribution parameters as shown in Fig.3. Note that we treat the bands indepen-dently, without giving special treatment to systems with excesses in multiple bands. For example, while it could be argued that a system with significances below but close to the threshold in two different bands shows sufficient evidence for a disc, we would not classify such a system as disc-bearing using our criteria. As different systems in our sample have observations in different bands, taking such cases into account consistently would require defin-ing different excess criteria for each possible combination of observations in the three far infrared bands.
There is one system in the sample to which we give special consideration in deciding whether a disc is present. HD 19356 (Algol) has a significant MIPS 70µm excess with χ = 5.12, which could be linked to the sys-tem’s variable millimetre emission rather than originating from a circumstellar disc (Holland et al. 2017). Though there is no direct evidence against the presence of dust in the system, we take a conservative approach and, for the purpose of this paper, do not consider this system to host a debris disc.
101 102 103
Tdisc/K
10-6
10-5
10-4
10-3
10-2
f
10-1
100
101
102
103
104
a/
[image:9.612.87.307.64.206.2]au
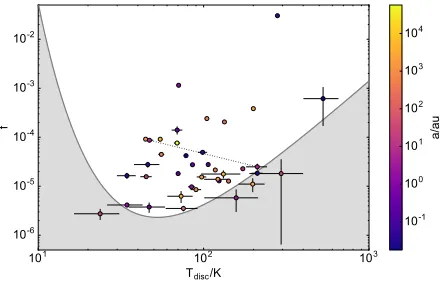
Figure 4.Fractional luminosity versus disc temperature for our full sample. The points are coloured by stellar separa-tion; we use the smallest separation in the system for triple and higher order systems. We model HD 95698 as a two-temperature disc, and the two components are joined with a dotted line. The grey region shows the part of parameter space in which a disc around a typical star in our sample would be undetectable (see section4.1for details); systems lying close to the boundary of this region have comparatively large un-certainties.
4 RESULTS
Using the methods outlined in the previous section, we are able to come to a conclusion about which systems in our sample are seen to host Kuiper belt-like debris discs, and to quantify the temperatures and luminosities of those discs. In this section, we first present these in-ferred disc properties and consider their implications for dynamical stability, then perform a statistical analysis to investigate whether the stellar orbits affect the detectabil-ity of debris in a significant way.
4.1 Disc properties
We find that 38 systems in our sample host debris discs, which are characterised by their fractional luminosity f
(i.e. the ratio of their luminosity to the stellar luminos-ity) and their temperature Tdisc. These parameters are
listed in Table3and plotted in Fig.4. The uncertainties shown in this Figure are calculated as half the difference between the 84th and 16th percentiles of the posterior distributions. The grey shading shows the region of pa-rameter space in which we would not expect a disc around a typical star in our sample to be detectable by PACS at 70 µm. To estimate the detection threshold, we used equation (8) of Wyatt (2008), taking the sensitivity to be 5 mJy5, and the stellar distance and luminosity to be the median values in our sample: 23 pc and 2.1 L
respectively. Thus, it is not surprising that several sys-tems lie slightly below this threshold, since the detection threshold for some stars will be lower than that of a me-dian star. It is nonetheless a useful guideline, explaining
5 See Table 3.2 of the PACS Observer’s Manual, http://
herschel.esac.esa.int/Docs/PACS/html/pacs_om.html
the general form of the region where our discs lie, and why discs in certain parts of parameter space (i.e. near the threshold, where the detections have a lower signal to noise ratio) have comparatively large uncertainties. The points in Fig.4are coloured by stellar separationa, and from this it does not appear that f orTdiscare strongly
influenced byain the region where discs are detected.
4.2 Dynamical stability
Next, we wish to assess the dynamical stability of the discs. To do so, we need to establish where in the system they lie, i.e. their radii. We first convert the temperatures obtained from SED modelling into black body disc radii
rbbby assuming that the dust acts as a perfect absorber
and emitter in thermal equilibrium with the stellar ra-diation (e.g.Wyatt 2008). Radii calculated in this way, however, will underestimate the true radii of the discs by an amount that depends on the stellar luminosityL. The smallest grains in a disc are inefficient emitters, and so the more small grains that are present, the greater the de-parture from black body behaviour. The factor by which the black body radius underestimates the true radius is thus greater for lower luminosity stars, because brighter stars can remove larger grains via their radiation pressure (e.g.Burns et al. 1979). For Sun-like stars, this correction factor can be as large as∼5 (Pawellek & Krivov 2015), which could make the difference between dust appearing to lie in a stable and an unstable region, and is thus im-portant to account for. To estimate the true disc radii
rdisc, we use the prescription ofPawellek & Krivov(2015)
– specifically, we multiply our black body radiirbbby the factorΓdefined in their equation (8), assuming that the dust is composed of a mixture of astrosilicate and ice. Note that in addition to the uncertainty arising from the need to assume a particular dust composition, there is some inherent scatter in the relation between Γ and L, and so while we do on average expect the correction to improve our estimates of the disc radii there may be indi-vidual systems for which the black body radius is closer to the true value.
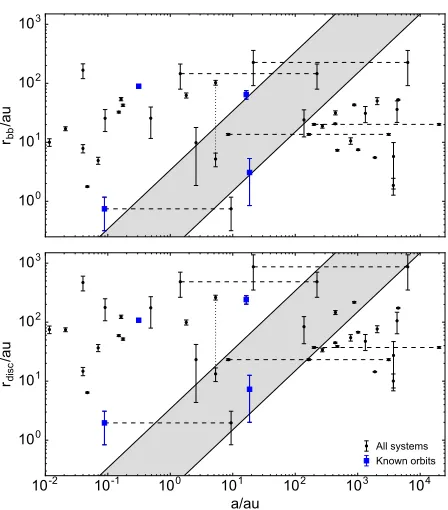
Bothrbb andrdiscare listed in Table 3and plotted
as functions of stellar separation in Fig. 5. Also shown in this Figure, with grey shading, is the approximate dy-namically unstable region of parameter space as calcu-lated by Rodriguez et al. (2015), who used the results of Holman & Wiegert(1999) and assumed equal stellar masses and an orbital eccentricity of 0.4. The boundaries of this region are at 0.15 and 3.4 times the stellar separa-tion. Note that a system lying in this region can only be considered definitively unstable if the value of aused is the true semimajor axis of the stellar orbit. As discussed in section2, this is not in fact the case for most systems in our sample. For visual binaries – i.e. those towards the right hand side of Fig. 5 – generally only theprojected
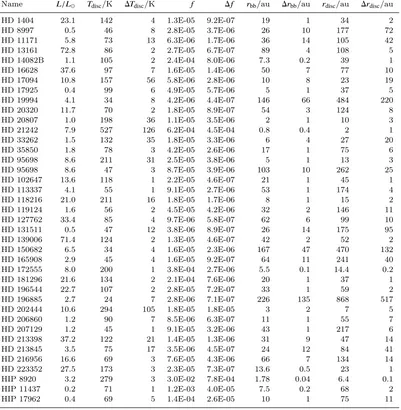
Name L/L Tdisc/K ∆Tdisc/K f ∆f rbb/au ∆rbb/au rdisc/au ∆rdisc/au
HD 1404 23.1 142 4 1.3E-05 9.2E-07 19 1 34 2
HD 8997 0.5 46 8 2.8E-05 3.7E-06 26 10 177 72
HD 11171 5.8 73 13 6.3E-06 1.7E-06 36 14 105 42
HD 13161 72.8 86 2 2.7E-05 6.7E-07 89 4 108 5
HD 14082B 1.1 105 2 2.4E-04 8.0E-06 7.3 0.2 39 1
HD 16628 37.6 97 7 1.6E-05 1.4E-06 50 7 77 10
HD 17094 10.8 157 56 5.8E-06 2.8E-06 10 8 23 19
HD 17925 0.4 99 6 4.9E-05 5.7E-06 5 1 37 5
HD 19994 4.1 34 8 4.2E-06 4.4E-07 146 66 484 220
HD 20320 11.7 70 2 1.8E-05 8.9E-07 54 3 124 8
HD 20807 1.0 198 36 1.1E-05 3.5E-06 2 1 10 3
HD 21242 7.9 527 126 6.2E-04 4.5E-04 0.8 0.4 2 1
HD 33262 1.5 132 35 1.8E-05 3.3E-06 6 4 27 20
HD 35850 1.8 78 3 4.2E-05 2.6E-06 17 1 75 6
HD 95698 8.6 211 31 2.5E-05 3.8E-06 5 1 13 3
HD 95698 8.6 47 3 8.7E-05 3.9E-06 103 10 262 25
HD 102647 13.6 118 1 2.2E-05 4.6E-07 21 1 45 1
HD 113337 4.1 55 1 9.1E-05 2.7E-06 53 1 174 4
HD 118216 21.0 211 16 1.8E-05 1.7E-06 8 1 15 2
HD 119124 1.6 56 2 4.5E-05 4.2E-06 32 2 146 11
HD 127762 33.4 85 4 9.7E-06 5.8E-07 62 6 99 10
HD 131511 0.5 47 12 3.8E-06 8.9E-07 26 14 175 95
HD 139006 71.4 124 2 1.3E-05 4.6E-07 42 2 52 2
HD 150682 6.5 34 4 1.6E-05 2.3E-06 167 47 470 132
HD 165908 2.9 45 4 1.6E-05 9.2E-07 64 11 241 40
HD 172555 8.0 200 1 3.8E-04 2.7E-06 5.5 0.1 14.4 0.2
HD 181296 21.6 134 2 2.1E-04 7.6E-06 20 1 37 1
HD 196544 22.7 107 2 2.8E-05 7.2E-07 33 1 59 2
HD 196885 2.7 24 7 2.8E-06 7.1E-07 226 135 868 517
HD 202444 10.6 294 105 1.8E-05 1.8E-05 3 2 7 5
HD 206860 1.2 90 7 8.5E-06 6.3E-07 11 1 55 7
HD 207129 1.2 45 1 9.1E-05 3.2E-06 43 1 217 6
HD 213398 37.2 122 21 1.4E-05 1.3E-06 31 9 47 14
HD 213845 3.5 75 17 3.5E-06 4.5E-07 24 12 84 41
HD 216956 16.6 69 3 7.6E-05 4.3E-06 66 7 134 14
HD 223352 27.5 173 3 2.3E-05 7.3E-07 13.6 0.5 23 1
HIP 8920 3.2 279 3 3.0E-02 7.8E-04 1.78 0.04 6.4 0.1
HIP 11437 0.2 71 1 1.2E-03 4.0E-05 7.5 0.2 68 2
[image:10.612.94.495.67.477.2]HIP 17962 0.4 69 5 1.4E-04 2.6E-05 10 1 75 11
Table 3. Results of SED fitting for the 38 systems we find to have a significant infrared excess. The table shows the name of each system, its stellar luminosity, and the disc parametersTdisc, f,rbb and rdisc as defined in the text of section 4with their
associated uncertainties. HD 95698 is listed twice because we model it with two dust components of different temperatures. A machine-readable version of this table is available online.
accurately for our purposes (up to a factor∼2 for equal mass binaries), and the dependence on M is not strong (a∝M1/3), which means that semimajor axis estimates for spectroscopic binaries will generally be reliable. Thus, while in all but a few casesais not a direct measurement of the semimajor axis, systems lying further towards the left hand side of the plot will generally have an avalue closer to their true semimajor axis.
Of the 38 discs we find, 9 have anrdiscplacing them
in the nominally unstable region: HD 19994, HD 21242, HD 95698, HD 119124, HD 181296, HD 202444, HD 207129, HD 213845 and HD 223352. We generally expect rdisc to give a better estimate of the disc radii,
and thus a better indication of stability, than rbb. How-ever, to allow a direct comparison with previous work we note that if the black body radii were to be interpreted as true disc radii, then we would conclude that the only unstable systems were HD 19994, HD 95698, HD 202444,
HD 213845 and HD 223352. That is, correcting for inef-ficient grain emission moves four systems up into the un-stable region, without moving the other five far enough out to be considered stable.
Assuming binomial uncertainties (e.g. Burgasser et al. 2003), the nine potentially unstable systems con-stitute24+8−
6%of the discs. For comparison, of the 71
χ
Name MIPS 70µm PACS 70µm PACS 100µm
HD 46273 2.52 -0.35
HD 56986 -0.62 1.06
HD 73752 0.15 -0.06
HD 80671 1.91 1.08
HD 127726 -0.52
HD 133640 3.74 2.03
[image:11.612.328.552.61.316.2]HD 174429 0.62 1.78 1.02
Table 4.Far infrared significances of the seven systems pre-viously considered to host unstable dust and for which we do not detect an excess. Recall that the excess thresholds are set by Figs2and3, and can thus exceedχ= 3. In particular, the MIPS 70µm threshold isχ= 5.00.
– HD 46273, HD 80671 and HD 127726 – in fact satisfy our excess criterion. Note that while a MIPS 70 µm ob-servation of HD 127726 exists fromTrilling et al.(2007), we do not include the corresponding flux in our SED fitting because it is 4.4σ (or a factor of ∼3) above the
OT2_gkennedy_2PACS 70µm flux, probably due to con-tamination from a background source which is clearly visible in the PACS image ∼2000away; this is likely the reason for our different conclusions for this particular sys-tem. Similarly, none of the three ‘unstable’ systems from
Rodriguez & Zuckerman (2012) that are in our sample (HD 56986, HD 73752 and HD 174429) appear to have a significant excess. Of the four ‘unstable’Rodriguez et al.
(2015) systems, our results agree that HD 223352 and HD 19994 do seem to host unstable dust, but we con-clude that the disc of HD 165908 (99 Her) is in a stable location based on either rdisc or rbb (see also Kennedy et al. 2012a) and that HD 133640 does not have a signif-icant infrared excess. For reference, the far infrared sig-nificances of the systems previously thought to host an unstable disc which we do not consider to have an excess are displayed in Table4.
Fig.5also highlights (as larger, square points) those systems for which the stellar orbits can be considered well known, i.e. those listed in VB6 with grade 1 or 2, as discussed in section 2. These are the systems for which the plotted stellar separations are true semimajor axes, which allows a stronger conclusion to be drawn about their discs’ stability than if only the projected separation were known. Recall also that spectroscopic binaries are not subject to projection effects, which in practice means that although they do not have directly measured semi-major axes like the highly graded VB6 systems, the hori-zontal positions of most binaries withaless than around 1 au in Fig.5are well constrained, allowing us to conclude that such systems are very likely stable.
The disc-bearing known VB6 orbit systems are HD 13161 (beta Tri), HD 165908 (99 Her), HD 202444 (tau Cygni), and HD 21242 (UX Ari). The first two of these systems are well known from previous work to host discs (Kennedy et al. 2012a,2012b), and lie well outside the unstable zone. The third, HD 202444, is a new de-tection from theOT2_gkennedy_2survey, and lies in the unstable zone in Fig. 5. Finally, HD 21242, one of the
10
010
110
210
3r
bb/au
10
-210
-110
010
110
210
310
4a/au
10
010
110
210
3r
disc/au
[image:11.612.79.317.63.178.2]All systems Known orbits
Figure 5.Disc radius versus stellar separation for our full sample. The upper panel shows black body disc radii, while the radii in the lower panel have been corrected for ineffi-cient grain emission according toPawellek & Krivov(2015). Systems with more than two components, and hence more than one separation, are connected by dashed lines. We model HD 95698 as a two-temperature disc, and the two components are joined with a dotted line. HD 216956 (Fomalhaut) is the most widely separated system in our sample, and lies beyond the range of separations shown. Systems with highly graded VB6 orbits are plotted as large square points. The grey shad-ing marks the approximate region of dynamical instability for planetesimals, assuming an equal-mass binary with an eccen-tricity of 0.4, as inRodriguez et al.(2015). Around 24% of the discs we find appear to be unstable based on the lower panel.
OT1_jdrake01_1targets, is a triple system, and it is only the AaAb component which has a known orbit. Fig. 5
shows that the dust is sufficiently far out to be stable to perturbations from the AaAb pair, though it does lie just inside the nominally unstable region of the less well constrained AB pair.
Rodriguez et al.(2015) noted that two possible ef-fects which could cause stable discs to appear unstable in a plot of rdisc againsta are inefficient grain emission
[image:11.612.81.316.71.175.2]4.3 Assessment of potentially unstable systems
In the previous subsection, we identified nine systems which, based on their values ofrdisc, appear to host un-stable dust. As these systems are of particular interest, here we discuss each of them individually and assess the evidence that their discs truly are unstable.
HD 19994 – this is a triple star system; the B and
C components are on a close orbit (a ∼ 1.5 au, from VB6), while the BC pair is at a projected separation of
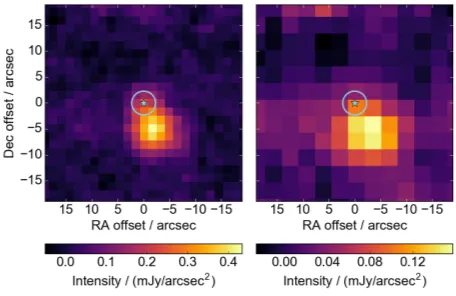
a∼220 aufrom the A component (Rodriguez et al. 2015). We derive a disc radius of480±220 au. The simplified pic-ture presented by Fig.5suggests that the disc is stable to perturbations from the BC pair but formally lies just inside the unstable region of the A-BC system.Wiegert et al. (2016) studied HD 19994 in detail, and using ra-diative transfer modelling andN-body simulations of dif-ferent possible disc geometries, they concluded that the disc, if real, is likely circumsecondary, i.e. orbiting the BC pair, and in a stable location. They also noted that there is a 2.3% probability that the 100 µm excess is due to contamination from a background galaxy. This contami-nation probability depends on wavelength and PSF size, and so its exact value will vary within our sample depend-ing on the data that exist for each star. However, given our sample size of several hundred systems, assuming a value on the order of 1% it is expected that several stars in our sample will be affected by background galaxies. For this system in particular, the PACS images, shown in Fig.6, do hint at background contamination: at 100µm there appears to be one source very close to the expected stellar position at the time of observation, with another, brighter source around 500away. At 160µm, only the lat-ter of these appears to be detected. Note that in Fig.6, the stellar position shown is calculated using Hipparcos
proper motions; the error circle around the star has ra-dius 2.300, reflecting the Herschel pointing uncertainty6. PSF fitting favours subtracting the brighter source, but it is possible that this is in fact a galaxy while the less bright source is the star. In summary, we do not consider the evidence that this system genuinely contains unstable dust, or perhaps a disc at all, to be compelling.
HD 21242 (UX Ari) – another triple system, with
AaAb on a close orbit and a more distant B component. Estimating the AaAb and AB semimajor axes from SB9 periods as outlined in section 2gives 0.08 and 9 au re-spectively. The periods we used are those calculated by
Duemmler & Aarum (2001) using radial velocity obser-vations; the AB period is based on a fit to the velocity of the centre of mass of the AaAb pair, which they found to be changing systematically with time. The AaAb orbit is listed with grade 2 in VB6, giving a semimajor axis of 0.09 au, very close to the value we inferred from the period. AB also appears in VB6 with a semimajor axis of 33 au; as this is graded 5, we take the AB semimajor axis to be 9 au. Note that the AB component lies very close to the edge of the nominally unstable region in Fig.5, and using the VB6 value would move the system well into the
6 See Table 2.1 of the Herschel Observer’s Manual,
[image:12.612.298.526.70.218.2]http://herschel.esac.esa.int/Docs/Herschel/html/ Observatory.html
Figure 6. Cutouts of the PACS images of HD 19994, at 100 µm (left) and 160µm (right). The expected stellar po-sition at the time of observation is marked, along with an er-ror circle reflecting theHerschelpointing uncertainty of 2.300.
The 100µm image appears to show two sources: one at the expected stellar position, and another, brighter source around 500 away. In the 160µm image, only the brighter of the two
sources is visible. This may suggest that the image is contam-inated by a background galaxy.
stable region. We find a disc at2±1 au. It is the hottest disc in our sample by some margin (Tdisc∼500 K), and the third brightest (f ∼6×10⁻⁴), making it somewhat exceptional. Matranga et al. (2010) similarly identified this system as hosting large amounts of very warm dust, and suggested planetary collisions as a potential origin of this dust. We discuss this idea further in section5.3. If this system hosts dust which is truly residing in the unstable zone, then binary perturbations from the AB pair could provide an explanation for the destabilisation of the planets proposed to be responsible. Alternatively, note that the dust is consistent with lying at the bound-ary of instability (which is formally at 1.4 au); this could imply that the disc is being truncated at its outer edge by perturbations from the B component.
HD 95698 – a binary with projected separation 5 au
(Trilling et al. 2007). As noted in section 3, inspection of its IRS spectrum motivated us to model this system with two temperature components. This suggests that the disc likely has significant radial extension and/or multiple belts, though two-temperature discs can also arise from a single narrow belt, in which different grain sizes have different temperatures (Kennedy & Wyatt 2014). While the cooler component lies well into the stable zone (at
262±25 au), the warmer component is formally unstable withrdisc= 13±3 au. Given that the boundary of the grey
broad disc extending from101+72−
38auto318 +43
−54au,
corre-sponding to the cooler component of our SED model. We also allow for a component of unresolved flux, and find that the best-fitting model favours such a component be-ing present at 3 mJy (in addition to the ∼5 mJy from the star), around 2.6% as bright as the resolved compo-nent; the warmer component of our SED model is likely responsible for this emission. In our SED fit the warmer component similarly has 2.7% of the flux of the cooler component at 70 µm. As the warmer component is not resolved, the image cannot give a better constraint on its radius than SED modelling, and our conclusion about its stability is not affected.
HD 119124 – another binary, with projected
sepa-ration a ∼440 au (Rodriguez & Zuckerman 2012). The excess is unambiguous, with a 14σ detection in MIPS 70 µm. It has not been previously identified as unsta-ble, and if we had taken the disc radius to be equal to the black body radius of 32±2 authen we would also have concluded that it is stable. As a late F-type star, its stellar luminosity correction factor is large (Pawellek & Krivov 2015), placing its estimated ‘true’ disc radius firmly in the unstable region, withrdisc= 145±11 au.
How-ever, note that the quoted uncertainty of 11 au does not acknowledge the uncertainty inherent in the correction factor, so the disc could be stable if the dust composition is different to that assumed.
HD 181296 (eta Tel) – a triple system, with the
secondary companion 200 au away (Rodriguez & Zuck-erman 2012) in projected separation, and a much more distant tertiary companion at ∼ 2×10⁴ au (Tokovinin 2018), sufficiently distant that it will not affect the sta-bility of the circumprimary disc. The tertiary companion is HD 181327, which hosts its own debris disc (Lebreton et al. 2012), but as we are focusing on observations of pri-mary stars, we plot both components at our calculated circumprimary disc radius in Fig.5. We findrbb= 20±1 au
and rdisc= 37±1 au. Mid infrared images of HD 181296
have revealed a solar system-like architecture, with a re-solved disc at24±8 auand an unresolved component at
∼4 au (Smith et al. 2009); thus, in this case, the black body radius actually provides a slightly better estimate of the true radius. Based on the resolved radius, the disc is not unstable. Note also that the primary is an early A type star, while the secondary companion is in fact a brown dwarf (Neuh¨auser et al. 2011), meaning that the mass ratio here is particularly extreme. The grey region in Fig.5assumes equal masses for both stars, so the un-stable region for this particular system will be narrower than the Figure suggests.
HD 202444 – this binary system has a semimajor
axis of a = 18.6 au, from VB6. This is the only poten-tially unstable system whose orbit is well known. The PACS 70 µm data fromOT2_gkennedy_2show an excess with significance χ= 4.54. As this is a single-band excess whose signal to noise ratio is not particularly high, the disc radius is not well constrained, with rdisc= 7±5 au.
Given that the excess is detected by PACS at 70µm but not 160µm, by considering the detection limits as a func-tion of disc radius in these two bands we can deduce an upper limit onrbbof∼100 au, corresponding to anrdiscof
∼240 au. Note that this upper limit appears
incompati-ble with the above quoted disc radius and its uncertainty. This is likely a result of the fact that when a model with only a stellar component is fitted to the system’s SED,
theAKARI (Ishihara et al. 2010) 9 µm flux is∼4σ
be-low the photosphere, while the MIPS 24µm flux is∼2σ above it. Adding a dust component to the model allows the residuals in both of these bands to be made less sig-nificant: the stellar component preferentially has a lower flux than in the star-only model, set by theAKARI 9µm photometry, while the MIPS 24 µm flux – which is now even further above the photosphere, at∼7σ – forces the dust to a relatively high temperature of∼300 K. It could be the case that the AKARI photometry is subject to underestimated uncertainties and/or a systematic effect, either of which could make the low flux measured for this system unreliable. If so, the MIPS 24 µm excess would not be so significant and the dust could be much cooler, as indicated by the upper limit derived only from con-sideration of the PACS sensitivities. Despite the poorly constrained radius, as orbital projection is not an issue for this system it may be an interesting target for future observations.
HD 207129– a binary system with projected
separa-tiona∼880 au(Rodriguez et al. 2015). Its ring-like disc has been resolved both in scattered light, with a mea-sured radius of around 160 au (Krist et al. 2010), and by
Herschel, with a measured radius of140±30 au(Marshall et al. 2011). Our SED modelling gives a black body radius of43±1 au; as a G-type star, its luminosity-corrected ra-dius is considerably larger, atrdisc= 217±6 au. Thus, in
this case the corrected radius does indeed allow a better assessment of stability, since it overestimates the
Her-schel-resolved radius by a factor of only 1.6, while the
black body radius is around 3.3 times too small. The lower boundary of the formally unstable region at a semi-major axis of 880 au is at ∼130 au, and so based solely onrdiscthe dust would be considered unstable. However,
theHerschel-resolved radius, which directly measures the
true disc size, while still formally unstable, is extremely close to – and in fact consistent with – the boundary. It may thus be the case that the disc is not truly unstable, and either the binary semimajor axis is greater than the projected separation or the disc is being truncated at its outer edge by the binary companion.
HD 213845 – a binary with projected separationa∼
140 au(Rodriguez et al. 2015) andrdisc= 80±40 au. It has
a marginal excess in PACS 100µm, with χ= 3.88, hence the relatively poorly constrained radius. Its MIPS 70µm flux is notably high too, but still below our threshold, with χ= 3.20. As with HD 119124, the system lies well into the apparently unstable region in Fig. 5, and there is no obvious reason to disbelieve the excess. The PACS 100µm image is not resolved; while the image has a low signal to noise ratio, this may suggest that the true disc radius is smaller than 80 au. A disc of this size would have an angular diameter of 7.000at this system’s distance of 22.7 pc, somewhat larger than the PACS beam size of
6.6500×6.8700(Poglitsch et al. 2010).
HD 223352– this is a hierarchical quadruple system.
from the AB system (Rodriguez et al. 2015). As noted in that paper, the system is unusual in thattwo of its con-stituent stars – A and C – are known to host their own debris discs (Phillips 2011). Fig. 5is made without any knowledge of which star the detected dust orbits, and so we plot all three separations listed above at the same dust radius:rbb= 13.6±0.5 au or rdisc= 23±1 au. In fact,
in-spection of Fig.5shows that in our study this system only appears unstable if one plots the close BaBb separation – however, given the knowledge that the dust is not orbit-ing the B pair, it becomes clear that this separation is not relevant. The dustisstable to perturbations from the C component, and is formally stable – but at the boundary (∼24 au) – with respect to the B component. The black body radius for the circumprimary disc derived by Ro-driguez et al. (2015) is somewhat larger than our value, at 27 au, which led them to the similar conclusion that the dust is at the boundary of stability (though formally unstable). This could be another case in which either the circumprimary disc is being truncated at its outer edge by perturbations from the B component or the true bi-nary semimajor axis is greater than the projected stellar separation.
We now summarise our findings from the above con-sideration of individual systems. The main conclusion here is that while some systems do appear based on Fig.5
to host unstable discs, a more detailed consideration of these systems highlights the fact that this result should not be taken at face value. For one system (HD 19994) we are doubtful about the existence of a disc, due to possible background contamination. For another system (HD 223352), the disc only appears unstable if we con-sider the BaBb separation, but from previous work it is in fact known to be circumprimary. There is also a sys-tem (HD 181296) whose disc radius from resolved image modelling differs from our radius from SED fitting and indicates that the disc is actually stable.
For two systems (HD 21242 and HD 95698) our cal-culated radii place them very close to the boundary of sta-bility, as does the resolved radius of another (HD 207129). In such cases, we are particularly hesitant to conclude that the discs are genuinely unstable. This is because the boundary of instability is not as well defined as it appears in Fig. 5, since the mass ratio and eccentricity vary be-tween systems and are not generally well known. Given the proximity of these systems to the nominal boundary, it could be the case that these discs are stable and being truncated by binary perturbations; however, uncertainty on the true positions of systems in Fig. 5(as discussed in detail below) means that the evidence for the trunca-tion hypothesis is not strong. We note, though, that it is known that discs undergoing truncation could appear unstable:Th´ebault et al.(2010) found usingN-body sim-ulations that a circumprimary disc being truncated at its outer edge by a binary companion will extend into the dynamically unstable region to some degree, as a result of collisionally-produced small grains which are placed on eccentric orbits by radiation pressure. This can alter the SED of a system with such a disc sufficiently to push its inferred radius into the unstable region, even though the parent planetesimals are stable.
The three remaining systems, which lie well into the
0 1 2 3 4 5
a/aproj 0.0
0.2 0.4 0.6 0.8 1.0 1.2 1.4 1.6
PD
[image:14.612.298.525.68.215.2]F
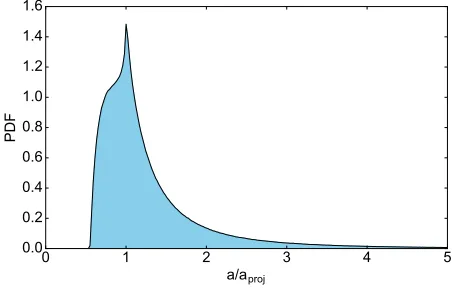
Figure 7.Probability density function (PDF) of the ratio of true semimajor axis to projected separation for a population of binaries with uniformly distributed orbital elements. Eccen-trities were taken to be distributed between 0 and 0.8.
unstable region in Fig.5, are HD 119124, HD 213845 and HD 202444. These may be interesting targets for future observations, however there are still effects which make their true positions in that Figure uncertain. We found by considering the resolved radius of HD 181296 that the ‘corrected’ disc radiusrdiscis not always a better
indica-tor of true disc size than the black body radius; this is not surprising given that the correction requires an assump-tion of dust composiassump-tion and that the correcassump-tion factor is known to show some inherent scatter (Pawellek & Krivov 2015). Thus, the vertical positions of the systems in Fig.5
are actually less well known than the error bars suggest. We note that the black body radiirbbof HD 213845 and
HD 202444 lie at the boundary of instability, and that of HD 119124 lies in the stable region.
There is also the possibility of orbital projection for visual binaries introducing uncertainty on the horizontal positions. To quantify the importance of this effect, we generated 107 sets of random uniformly distributed or-bital elements, with inclinationI ranging from 0 to π/2, eccentricityefrom 0 to 0.8, argument of pericentreωfrom 0 to2π, and mean anomalyMfrom 0 to2π. The eccentric-ity distribution we used is an approximation to what has been observed in a real population of binaries (see Fig. 14 ofRaghavan et al. 2010). We used uniformly distributed mean anomalies rather than true anomalies so that the fact that the stars spend more time near apocentre than near pericentre is accounted for. For each set of elements, we calculated the ratio of the true semimajor axis ato the projected separation aproj, using equation (2.122) of
Murray & Dermott(1998). The resulting distribution of
a/aprojis shown in Fig.7. It is clear that the distribution
is highly skewed, and while the most probable result is
that the semimajor axis is equal to the observed projected separation, there is a non-negligible probability that the true value is several times larger. The median value of
a/aproj is 1.06+0−0..6929, where the quoted uncertainties are