Normalized Entity Graph for Computing Local Coherence
Mohsen Mesgar and Michael Strube
Heidelberg Institute for Theoretical Studies gGmbH Schloss-Wolfsbrunnenweg 35
69118 Heidelberg, Germany
(mohsen.mesgar|michael.strube)@h-its.org
Abstract
Guinaudeau and Strube (2013) introduce a graph based model to compute local en-tity coherence. We propose a computa-tionally efficient normalization method for these graphs and then evaluate it on three tasks: sentence ordering, summary coher-ence rating and readability assessment. In all tasks normalization improves the re-sults.
1 Introduction
Guinaudeau and Strube (2013) introduce a graph based model (henceforth called entity graph) to compute local entity coherence. Despite being un-supervised, the entity graph performs on par with Barzilay and Lapata’s (2005; 2008) supervised en-tity grid on the tasks of sentence ordering, sum-mary coherence rating and readability assessment. The entity graph also overcomes shortcomings of the entity grid with regard to computational com-plexity, data sparsity and domain dependence.
The entity graph is a bipartite graph where one set of nodes represents entities and the other set of nodes represents the sentences of a document. Guinaudeau and Strube (2013) apply a one mode projection on sentence nodes (Newman, 2010) and then compute the average out-degree of sentence nodes to determine how coherent a document is. They describe variants of their entity graph which take the number of shared entities between sen-tences and their grammatical functions into ac-count thus resulting in weighted bipartite graphs and weighted one mode projections. Here, we propose to normalize weights for the entity graph. Normalization allows to include distance between mentions of the same entity, which improves the performance on all three tasks thus confirming re-search in related areas which states that normaliz-ing weights leads to better performance (Zhou et al., 2008; Zweig and Kaufmann, 2011).
2 The Entity Graph
The entity graph (Guinaudeau and Strube, 2013),
G= (V, E), represents the relations between sen-tences and entities in a text, where node setV con-tains all sentences and entities in a text andE is the set of all edges between sentences and enti-ties. Let functionw(si, ej)indicate the weight of an edge which connects sentencesiand entityej. Ifw(si, ej) = 1, then this edge indicates that there is a mention ofej in sentencesi. In order to real-ize the insight from Grosz et al. (1995) that certain syntactic roles are more important than others, the syntactic role ofej insican be mapped to an inte-ger value (Guinaudeau and Strube, 2013):
w(si, ej) =
(3 ife
jis subject insi
2 ifejis object insi
1 otherwise
Figure 1 illustrates a weighted entity graph for three sentences.
1 3 2 3
2 1 1 3
1 1 1 1
S1 S2 S3
e1 e2 e3 e4 e5 e6 e7 e8 e9 e10 1
Figure 1: Weighted entity graph
Three types of one-mode projections capture relations between sentences, PU, PW and PAcc.
PU creates an edge between two sentences if they share at least one entity. PW captures the intu-ition that the connection between two sentences is stronger the more entities they share by means of weighted edges, where the weights equal the number of entities shared by sentences (Newman, 2004). The third type of projection, PAcc, inte-grates syntactic information in the edge weights calculated by the following formula:
Wik=
X
e∈Eik
w(e, si)·w(e, sk).
Figure 2 shows the three kinds of one-mode pro-jections used in the entity graph.
S1 S2
S3
S1 S2
S3 S1 S2
S3 1
1
1
2
9
4
PU PW PAcc
Figure 2: One-mode projections
While the entity grid (Barzilay and Lapata, 2008) uses information about sentences which do not share entities by means of the “- -” transition, the entity graph cannot employ this negative in-formation. Here, we propose a normalization for the entity graph and its corresponding one-mode projections which is based on the relative impor-tance of entities and, in turn, the relative impor-tance of sentences. Including negative informa-tion allows to normalize the importance of entities according to sentence length (measured in terms of entity mentions), and hence to capture distance information between mentions of the same entity. This brings the entity graph closer to Stoddard’s (1991, p.30) notion of cohesion: “The relative hesiveness of a text depends on the number of co-hesive ties [...] and on the distance between the nodes and their associated cohesive elements.” By using this information, edge weights are set less arbitrary which leads to the more sound method and higher performance in all tasks.
3 Normalized Entity Graph
The entity graph weighs edges by the number of entities sentences share (PW) and which syntactic functions the entities occupy (PAcc). Here we nor-malize the weights by the number of entities in a sentence. This takes negative information into ac-count as entities which do not occur in other sen-tences also count. Hence normalization captures the relative importance of entities as well as the relative importance of sentences.
We follow Newman (2004) by applying node degree normalization. For PW, we divide the weight of each edge by the degree of the corre-sponding sentence node. If a sentence contains many entities, then the amount of information each entity contributes is reduced. Assumeksik as the number of entities in sentencesi. The im-portance of entityej forsiis
Imp(si, ej) = ks1 ik.
1 3
2 3
2 1 1
3
1 2
1 1
S1 S2 S3
e1 e2 e3 e4 e5 e6 e7 e8 e9 e10
1
6 6
6 8
8 8 8
8 7
7 7
7
7
Figure 3: Normalized entity graph
ForPAccwe divide the weight of each edge by the sum of all edges’ weights of a sentence. This gives the importance of each entity in a sentence relative to the sentence’s other entities (see Figure 3).
Imp(si, ej) = P w(si, ej) ee∈Entitiesw(si, ee)
.
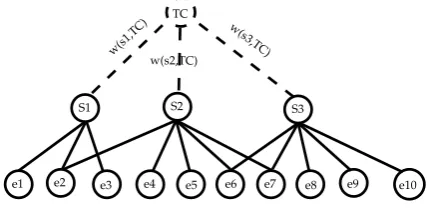
For also normalizing the one-mode projection we introduce a virtual node T C capturing the textual content of all sentences (inspired by the graph based information retrieval model of Rode (2008)). The virtual nodeT C is connected to all sentences (see Figure 4).
S1 S2 S3
e1 e2 e3 e4 e5 e6 e7 e8 e9 e10 TC
w(s1 ,TC)
w(s2,TC)
[image:2.595.310.524.368.472.2]w(s 3,TC)
Figure 4: Entity graph with virtual node
Rode (2008) uses the following formula to com-pute weights on the edges between the sentence nodes andT C:
w(si, T C) = PScore(si|T C) stScore(st|T C)
,
where the function Score(si|T C) is the number of entities insiwhich have overlap withT C. This value is equal to the degree of each sentence.
Since we are interested in local coherence, we restrict T C to pairs of sentences (See Figure 5). Subsequently, instead of w(si, T C), we use the notationlwsj
si (local weight of sentencesi
accord-ing to sentencesj).
We define the normalized one-mode projection as follows:
Wsij=P
e∈Esij
(lwsjsi·Imp(si,e))+(lwsjsi·Imp(sj,e))
Si Sj
e1 e2 e3 e4 e5 e6 e7
RTC
=w(si,
RTC) =w (sj,R
TC)
b b b
lwsisj
[image:3.595.339.491.62.184.2]lw sisj
Figure 5: Restricted TC for a pair of sentences
Similar to Rode (2008), we use the product of
lwsj
si andImp(si, e) to approximate the salience
of entityein sentencesi. This prevents the model to get biased by the length of sentences.
This method can be applied to graphs with edges weighted according to syntactic role (PAcc). To compute the connection’s strength of a pair of sentences we follow Yang and Knoke’s (2001) ap-proach: The path length in a weighted graph is the sum of the edge weights in the path. In our case, each path is defined between a pair of sentences of the entity graph, so the number of edges of all paths are equal to two. Figure 6 shows the nor-malized projections where the weights have been computed by the above formula.
S1 S2
S3
S1 S2
S3 S1 S2
S3 1
1
2
P P P
8
4 8
27 64
23 56
U W Acc
Figure 6: Normalized projections
4 Experiments
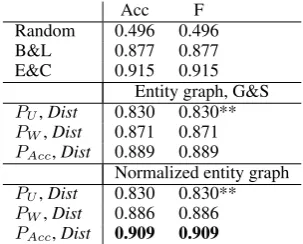
We compare the normalized entity graph with the entity graph on all tasks, Guinaudeau and Strube (2013) compared their work with the entity grid (Barzilay and Lapata, 2008; Elsner and Charniak, 2011): sentence ordering, summary coherence rat-ing and readability assessment. Followrat-ing Guin-audeau and Strube (2013) we test statistical sig-nificance with the Student’s t-test and Bonferroni correction, to check whether the best result (bold value in the tables) is significantly different from the results of the entity graph and the normalized entity graph. Diacritics ** indicate significance level 0.01, * indicates significance level 0.05.
Acc F
Random 0.496 0.496 B&L 0.877 0.877 E&C 0.915 0.915
Entity graph, G&S
PU,Dist 0.830 0.830**
PW,Dist 0.871 0.871
PAcc,Dist 0.889 0.889
Normalized entity graph
PU,Dist 0.830 0.830**
PW,Dist 0.886 0.886
PAcc,Dist 0.909 0.909
Table 1: Discrimination, baselines and entity graph vs. normalized entity graph
4.1 Sentence Ordering
This task consists of two subtasks: discrimina-tion and inserdiscrimina-tion. In both subtasks we evaluate whether our model can distinguish between the correct order of sentences in a document and an incorrect one. Experimental setup and data fol-low Guinaudeau and Strube (2013) (61 documents from the English test part of the CoNLL 2012 shared task (Pradhan et al., 2012)).
For discrimination we use 20 permutations of each text. Table 1 shows the results. Results for Guinaudeau and Strube (2013), G&S, are re-produced, results for Barzilay and Lapata (2008), B&L, and Elsner and Charniak (2011), E&C, were reproduced by Guinaudeau and Strube (2013).
The unweighted graph,PU, does not need nor-malization. Hence the results for the entity graph and the normalized entity graph are identical. Nor-malization improves the results for the weighted graphs PW and PAcc with PAcc outperforming B&L considerably and closely approaching E&L.
Sentence insertion is more difficult than dis-crimination. Following Elsner and Charniak (2011), we use two measures for evaluation: Ac-curacy (Acc.) and the average proportion of cor-rect insertions per document (Ins.).
Acc. Ins. Random 0.028 0.071 E&C 0.068 0.167
Entity graph, G&S
PU,Dist 0.062** 0.101**
PW,Dist 0.075 0.114**
PAcc,Dist 0.071 0.102**
Normalized entity graph
PU,Dist 0.062** 0.101**
PW,Dist 0.085 0.154
[image:3.595.77.290.68.163.2]PAcc,Dist 0.077 0.157
[image:3.595.339.491.616.726.2]Acc. F B&L 0.833
Entity graph, G&S
PU 0.800 0.815
PW 0.613 0.613*
PAcc 0.700 0.704
Normalized entity graph
PU 0.800 0.815
PW 0.775 0.775
[image:4.595.336.498.61.184.2]PAcc 0.788 0.788
Table 3: Summary Coherence Rating, B&L and entity graph vs. normalized entity graph
Table 2 shows that the normalized entity graph outperforms the entity graph for PW and PAcc (again, no difference for PU). The normalized entity graph outperforms E&C in Acc. and ap-proaches it in Ins. The high value for Ins. shows that if the normalized entity graph makes false de-cisions they are closer to the original ordering than the mistakes of the entity graph.
4.2 Summary Coherence Rating
We follow Barzilay and Lapata (2008) for evalu-ating whether the normalized entity graph can de-cide whether automatic or human summaries are more coherent (80 pairs of summaries extracted from DUC 2003). Human coherence scores are as-sociated with each pair of summarized documents (Barzilay and Lapata, 2008).
Table 3 displays reported results of B&L and reproduced results of the entity graph and our nor-malized entity graph. Normalizing significantly improves the results forPW andPAcc. PU is still slightly better than both, but in contrast to the en-tity graph, this difference is not statistically signif-icant. We believe that better weighting schemes based on linguistic insights eventually will outper-formPU and B&L (left for future work). Distance information always degrades the results for this task (see Guinaudeau and Strube (2013)).
4.3 Readability Assessment
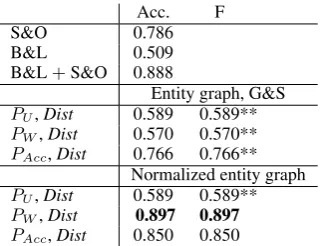
Readability assessment aims to distinguish texts which are difficult to read from texts which are easier to read. In experiments, Barzilay and La-pata (2008) assume that articles taken from Ency-clopedia Britannica are more difficult to read (less coherent) than the corresponding articles from En-cyclopedia Britannica Elementary, its version for children. We follow them with regard to data (107 article pairs), experimental setup and evaluation.
Table 4 compares reported results by Schwarm
Acc. F
S&O 0.786 B&L 0.509 B&L+S&O 0.888
Entity graph, G&S
PU,Dist 0.589 0.589**
PW,Dist 0.570 0.570**
PAcc,Dist 0.766 0.766**
Normalized entity graph
PU,Dist 0.589 0.589**
PW,Dist 0.897 0.897
[image:4.595.116.244.61.164.2]PAcc,Dist 0.850 0.850
Table 4: Readability assessment, baselines and en-tity graph vs. normalized enen-tity graph
and Ostendorf (2005), S&O, Barzilay and Lapata (2008), B&L, a combined method, B&L+S&O, reproduced results for the entity graph, G&S, and our normalized entity graph. Distance information always improves the results.
Sentences in the Britannica Elementary are simpler and shorter than in theEncyclopedia Bri-tannica. The entity graph does not take into ac-count the effect of entities not shared between sen-tences while the normalized entity graph assigns a lower weight if there are more of these entities. Hence, Britannica Elementary receives a higher cohesion score than Encyclopedia Britannica in our model. Adding grammatical information, does not help, because of the influence of the number of entities (shared and not shared) outweighs the influence of syntactic roles. The normalized en-tity graph (PW, Dist) does not only outperform the entity graph (significantly) and B&L but also S&O and the combination B&L+S&O.
5 Conclusion
We proposed a normalization method for the en-tity graph (Guinaudeau and Strube, 2013). We compared our model to the entity graph and to the entity grid (Barzilay and Lapata, 2008) and showed that normalization improves the re-sults significantly in most tasks. Future work will include adding more linguistic information, stronger weighting schemes and application to other readability datasets (Pitler and Nenkova, 2008; De Clercq et al., 2014).
Acknowledgments
References
Regina Barzilay and Mirella Lapata. 2005. Model-ing local coherence: An entity-based approach. In Proceedings of the 43rd Annual Meeting of the As-sociation for Computational Linguistics,Ann Arbor, Mich., 25–30 June 2005, pages 141–148.
Regina Barzilay and Mirella Lapata. 2008. Modeling local coherence: An entity-based approach. Compu-tational Linguistics, 34(1):1–34.
Orph´ee De Clercq, V´eronique Hoste, Bart Desmet, Philip Van Oosten, Martine De Cock, and Lieve Macken. 2014. Using the crowd for readability pre-diction. Natural Language Engineering, 20(3):293– 325.
Micha Elsner and Eugene Charniak. 2011. Extending the entity grid with entity-specific features. In Pro-ceedings of the 49th Annual Meeting of the Associa-tion for ComputaAssocia-tional Linguistics (Volume 2: Short Papers), Portland, Oreg., 19–24 June 2011, pages 125–129.
Barbara J. Grosz, Aravind K. Joshi, and Scott Wein-stein. 1995. Centering: A framework for model-ing the local coherence of discourse. Computational Linguistics, 21(2):203–225.
Camille Guinaudeau and Michael Strube. 2013. Graph-based local coherence modeling. In Proceed-ings of the 51st Annual Meeting of the Association for Computational Linguistics (Volume 1: Long Pa-pers),Sofia, Bulgaria, 4–9 August 2013, pages 93– 103.
Mark E.J. Newman. 2004. Analysis of weighted net-works. Physical Review E, 70(5):056131.
Mark E.J. Newman. 2010. Networks: An Introduction. Oxford University Press, New York, N.Y.
Emily Pitler and Ani Nenkova. 2008. Revisiting readability: A unified framework for predicting text quality. In Proceedings of the 2008 Conference on Empirical Methods in Natural Language Pro-cessing,Waikiki, Honolulu, Hawaii, 25–27 October 2008, pages 186–195.
Sameer Pradhan, Alessandro Moschitti, Nianwen Xue, Olga Uryupina, and Yuchen Zhang. 2012. CoNLL-2012 Shared Task: Modeling multilingual unre-stricted coreference in OntoNotes. InProceedings of the Shared Task of the 16th Conference on Com-putational Natural Language Learning,Jeju Island, Korea, 12–14 July 2012, pages 1–40.
Henning Rode. 2008. From document to entity re-trieval: Improving precision and performance of fo-cused text search. Ph.D. thesis, Enschede, June. Sarah E. Schwarm and Mari Ostendorf. 2005. Reading
level assessment using support vector machines and statistical language models. In Proceedings of the
43rd Annual Meeting of the Association for Compu-tational Linguistics,Ann Arbor, Mich., 25–30 June 2005, pages 523–530.
Sally Stoddard. 1991. Text and Texture: Patterns of Cohesion. Ablex, Norwood, N.J.
Song Yang and David Knoke. 2001. Optimal connec-tions: Strength and distance in valued graphs. Social networks, 23(4):285–295.
Tao Zhou, Jie Ren, Mat´uˇs Medo, and Yi-Cheng Zhang. 2008. Bipartite network projection and personal rec-ommendation. Physical Review E, 76(4). 046115. Katharina A. Zweig and Michael Kaufmann. 2011. A