CUSTOMER PERCEIVED VALUE AND CUSTOMER LOYALTY IN RETAIL BANKING IN KENYA
Department of Business
ARTICLE INFO ABSTRACT
The main aim of this study is to determine the influence perceived customer value on customer loyalty in retail
attributes and customer loyalty. To achieve this purpose, data was collected from a sample of 384 current customers of commercial banks on perceived customer benefits and perce
monetary and non monetary costs.
regression analyses were used to determine the The results indicate that customer perceived value h customer loyalty in retail banking
emphasis on the attributes that create favorable customer perceptions of value in order to build and maintain customer
Copyright©2016, Daniel Onwonga Auka.Thisis an open access article distributed under the Creative Commons Att use, distribution, and reproduction in any medium, provided the original work is properly cited.
INTRODUCTION
Globalization has led to many changes in the business environment and the financial sector is one of the sectors affected by this trend (Rehman and Ahmed, 2008). The last few decades have witnessed internationalization of the financial sector (Herrero and Simon (2006) and evidenced by many of major banks having expanded their business into the international market place and cross border operations. The key reasons of expanding operations into the international market are to achieve competitive advantage, ef
geographical risk diversification. In order to survive in this competitive market, banks have to differentiate themselves from their competitors as a means of attracting customers (Blankson et al., 2007). Customer loyalty has been defined by Oliver (1997) as a deeply held commitment to patronize or purchase a preferred good or service consistently in the future, despite situational influences and marketing efforts with the potential to cause switching behavior. Consequently, loyalty includes behavioral, as well as cognitive and attitudinal elements (Jones and Taylor, 2007; Taylor, Hunter and Longfellow, 2007). The behavioral perspective appears to be a more short-term and sales-directed perspective. Conversely, the combined attitudinal-cognitive loyalty can be characterized as a more defensive alternative that presupposes the efficacy of
*Corresponding author: Daniel Onwonga Auka,
Department of Business Administration, Egerton University, Kenya
ISSN: 0975-833X
Article History:
Received 21st March, 2016
Received in revised form 10th April, 2016
Accepted 25th May, 2016
Published online 30th June,2016
Key words:
Customer perceived value, Benefits, costs,
Social exchange theory and Equity theory, customer loyalty.
Citation: Daniel Onwonga Auka.2016. “Customer perceived value and customer loyalty in retail banking in Kenya Research, 8, (06), 33703-33715.
RESEARCH ARTICLE
CUSTOMER PERCEIVED VALUE AND CUSTOMER LOYALTY IN RETAIL BANKING IN KENYA
*Daniel Onwonga Auka
Department of Business Administration, Egerton University, Kenya
ABSTRACT
The main aim of this study is to determine the influence perceived customer value on customer loyalty in retail banking in Kenya. It examines the relationship between perceived customer value attributes and customer loyalty. To achieve this purpose, data was collected from a sample of 384 current customers of commercial banks on perceived customer benefits and perce
onetary and non monetary costs. A questionnaire was used to gather data regression analyses were used to determine the relationship between perceived
The results indicate that customer perceived value has a positive and significant influence on tomer loyalty in retail banking. This finding reinforces the need for bank managers to put emphasis on the attributes that create favorable customer perceptions of value in order to build and maintain customer loyalty
is an open access article distributed under the Creative Commons Attribution License, which use, distribution, and reproduction in any medium, provided the original work is properly cited.
Globalization has led to many changes in the business environment and the financial sector is one of the sectors affected by this trend (Rehman and Ahmed, 2008). The last few decades have witnessed internationalization of the Simon (2006) and evidenced by many of major banks having expanded their business into the international market place and cross border operations. The key reasons of expanding operations into the international market are to achieve competitive advantage, efficiencies and geographical risk diversification. In order to survive in this competitive market, banks have to differentiate themselves from their competitors as a means of attracting customers Customer loyalty has been defined by Oliver (1997) as a deeply held commitment to patronize or purchase a preferred good or service consistently in the future, despite situational influences and marketing efforts with the potential to cause switching behavior. Consequently, loyalty behavioral, as well as cognitive and attitudinal elements (Jones and Taylor, 2007; Taylor, Hunter and Longfellow, 2007). The behavioral perspective appears to be a directed perspective. Conversely, ve loyalty can be characterized as a more defensive alternative that presupposes the efficacy of
,
Department of Business Administration, Egerton University, Kenya
customer-relationship management initiatives (Taylor 2007). Loyalty in service businesses refers to the customer’s commitment to do business with a particular organization, purchasing their products repeatedly and recommending others to the organization’s products. Anderson and Jacobson (2000) say that customer loyalty is actually the result of an organization creating a benefit for customer so that they will maintain or increase their purchases from the organization. They indicate that true loyalty
becomes an advocate for the organization without incentives. The need for creating and maintaining customer loyalty is based on fact that it costs 25 % more to acquire new customers than to retain existing loyal customers (Par
Grewal, 2000; Bansal et al
behavioral and attitudinal dimensions. The behavioral repurchase consists of repeated purchase of product while attitudinal loyalty refers to attitudinal commitment or favorable attitude toward a product resulting in repeat purchasing behavior. It is a biased purchase response resulting from an evaluative attitude favoring the purchase. Loyalty is thus viewed as the customer’s demonstration of faithful adherence to an organization despite its
services. Dick and Basu (1994) conceptualize loyalty as the strength between repeat patronage and relative attitude which results from comparing a particular brand with competing brands. Customer loyalty is strong when a hi
leads to repeat buying. A low relative attitude leads to low repeat purchase which equals no loyalty.
International Journal of Current Research
Vol. 8, Issue, 06, pp.33703-33715, June, 2016
INTERNATIONAL
Customer perceived value and customer loyalty in retail banking in Kenya
CUSTOMER PERCEIVED VALUE AND CUSTOMER LOYALTY IN RETAIL BANKING IN KENYA
Administration, Egerton University, Kenya
The main aim of this study is to determine the influence perceived customer value on customer banking in Kenya. It examines the relationship between perceived customer value attributes and customer loyalty. To achieve this purpose, data was collected from a sample of 384 current customers of commercial banks on perceived customer benefits and perceived customer onnaire was used to gather data. Correlation and relationship between perceived and customer loyalty. as a positive and significant influence on This finding reinforces the need for bank managers to put emphasis on the attributes that create favorable customer perceptions of value in order to build and
ribution License, which permits unrestricted
relationship management initiatives (Taylor et al., 2007). Loyalty in service businesses refers to the customer’s commitment to do business with a particular organization, purchasing their products repeatedly and recommending others ation’s products. Anderson and Jacobson (2000) say that customer loyalty is actually the result of an organization creating a benefit for customer so that they will maintain or increase their purchases from the organization. They indicate that true loyalty is created when the customer becomes an advocate for the organization without incentives. The need for creating and maintaining customer loyalty is based on fact that it costs 25 % more to acquire new customers than to retain existing loyal customers (Parasuraman and
et al., 2005). Loyalty has both behavioral and attitudinal dimensions. The behavioral repurchase consists of repeated purchase of product while attitudinal loyalty refers to attitudinal commitment or favorable ard a product resulting in repeat purchasing behavior. It is a biased purchase response resulting from an evaluative attitude favoring the purchase. Loyalty is thus viewed as the customer’s demonstration of faithful adherence occasional error or indifferent services. Dick and Basu (1994) conceptualize loyalty as the strength between repeat patronage and relative attitude which results from comparing a particular brand with competing brands. Customer loyalty is strong when a high relative attitude leads to repeat buying. A low relative attitude leads to low repeat purchase which equals no loyalty.
INTERNATIONAL JOURNAL OF CURRENT RESEARCH
The marketing literature is embracing customer relationship– based research due to the overwhelming evidence that the acquisition of new customers is a far more expensive process than retaining current customers (Berry, 1995). Service firms and in particular, commercial banks are interested in building and maintaining long-term relationships with their customers (Gwinner et al, 1998). In addition, strong customer relationships are shown to lead to increased sales, lower operating expenses and predictable profit streams (Reichheld, 1996). The literature identifies several behavioral and attitudinal outcome behaviors firms can attain by having loyal customers. These loyalty outcomes include repurchase , less switching intentions and actions, positive word of mouth or recommendations, identification with service providers through exclusive affiliation, a willingness to pay a premium price for a given service, customer citizenship behavior, co-production by customers, social benefits to other customers in the form of friendships, mentoring other less experienced customers by helping them to understand explicitly or implicitly stated rules of conduct (Bolton and Lemon, 1999, Dick and Basu, 1994, Rust and Zahorik, 1993, Gruen, 1995, Goodwin and Gremler, 1996, Zeithaml et al., 1996). Loyalty can be of substantial value to both customers and the firm. Customers are willing to invest their loyalty in business that can deliver superior value relative to the offerings of competitors (Reichheld, 1996). When they are loyal to a firm, consumers may minimize time expended in searching and in locating and evaluating purchase alternatives. Also, customers can avoid the learning process that may consume the time and effort needed to become accustomed to a new vendor. Loyal customers often will, over time, bring in substantial revenues and demand less time and attention from the firms they patronize. Many customers are inclined to forgive customer-service mishaps, display decreasing sensitivity to price, and disseminate positive word-of-mouth about the business to others. As a result, customer loyalty can be a major source of sustained growth and profit and a strong asset (E.W. Anderson and Mittal, 2000).
Customer perceived value
Customer perceived value can be defined as the customer’s overall assessment of the utility of a product based on perceptions of what is received and what is given (Zeithaml, 19988). Customer perceived value has also been defined as the difference between the prospective customers' evaluation of all the benefits and costs of an offering versus perceived alternatives (Kotler and Keller, 2006), and also as perceived quality compared with perceived sacrifice (Storbacka, Strandvik and Gronroos, 1994). Thus customer perceived value (CPV) is the difference between the prospective customer’s evaluation of all the benefits and all the costs of an offering and the perceived alternatives. Total customer valueis the perceived monetary value of the bundle of economic, functional, and psychological benefits customers expect from a given market offering because of the products, services, personnel, and image involved. Total customer cost is the perceived bundle of costs that customers expect to incur in evaluating, obtaining, using, and disposing of the given market offering, including monetary, time, energy, and psychic costs. For the extended-service experience, consumers are motivated
by the realization of values, which in turn, affects patronage decisions (de Ruyter and Bloemer, 1999). This conceptualization suggests that customers have a “give and get” mentality when it comes to perceptions of value. Zeithaml’s (1988) seminal research further alludes to perceived service value as being the difference between the benefits received from using a service and the monetary and nonmonetary cost of receiving the service. Perceived value is thus viewed as a summary evaluation of costs versus benefits. This means that perceived value resembles equity, where perceived value increases positively if the imbalance favors benefits and negatively if the imbalance favors cost. Likewise, perceived value is the degree to which perceived benefits exceed sacrifices when purchasing a product (Mazumdar, 1993). Perceived value concept has its root in equity theory, which considers the ratio of the consumer’s outcome/input to that of the service provider’s outcome/input (Oliver and DeSarbo, 1988). The equity concept refers to customer evaluation of what is fair, right, or deserved for the perceived cost of the offering (Bolton and Lemon, 1999). Perceived costs include monetary payments and nonmonetary sacrifices such as time consumption, energy consumption, and stress experienced by consumers. In turn, customer-perceived value results from an evaluation of the relative rewards and sacrifices associated with the offering. Customers are inclined to feel equitably treated if they perceive that the ratio of their outcome to inputs is comparable to the ratio of outcome to inputs experienced by the company (Oliver and DeSarbo, 1988). And customers often measure a company’s ratio of outcome to inputs by making comparisons with its competitors’ offerings.
response to the value proposition offered in specific products (Reichheld, 1995). Perceived value may be key to enhancing customer loyalty (Lam et al., 2004, Neal, 1999, Zeithaml, 1988). However, studies have not focused on how customers define value and how organizations can provide added value services. In this study customer perceived value has been conceptualized as consisting of: Monetary value, emotional value, customization value and relational value. The components are explained below:
The first component of customer perceived value is monetary value. Monetary value is “a form of perceived value that is measurable in terms of the monetary benefits and costs involved in purchasing or using products and services” (Lee et al., 2007, p. 20). Monetary benefit is regarded as the perceived monetary savings in the form of price reduction when purchasing a product or service, while monetary cost is considered as a type of sacrifice, that is, all the costs the consumers have to bear in exchange for the product or service acquisition (Alsheikh and Bojei, 2012; Gwinner et al., 1998; Zeithaml, 1988). When monetary benefit exceeds monetary cost, monetary value is perceived as high. In contrast, when monetary cost exceeds monetary benefit, monetary value is perceived as low (Matzler et al., 2006).
Generally, any attempt to improve customer relationships should be implemented with the purpose of increasing customer loyalty. Loyal customers buy more, are willing to spend more, are easier to reach, and act as advocates of the firm (Harris and Goode, 2004). Therefore, loyalty is the most important outcome of relationship marketing efforts. The second component of customer perceived value is emotional value. Emotional value may be viewed as “the utility derived from the affective states that a product or service generates” (Wang et al., 2004). Similarly, Lai (1995) described emotional value as “the perceptual benefit acquired from a product’s capacity to arouse feelings or affective states”. Based on a synthesis of previous definitions, the present study defines emotional value in retail banking as “the customer perception of enjoyment, pleasure, and fun gained by doing business a particular service provider” (developed from Gummerus and Pihlström, 2011; Turel et al., 2007).
In the customer-centric era, the competitive battleground of differentiator is gradually shifting from the physical attributes of the product to render customers an exceptional experience through enhancing the emotional aspect of value (Mascarenhas
et al., 2006; Sandström et al., 2008). This is because the emotional bonds formed between companies and customers are difficult for competitors to emulate. Thus, firms nowadays are striving to achieve sustainable competitive advantage by adding emotional value to their core offerings (Freemantle, 1999; Mascarenhas et al., 2006).Previous studies in retail banking have demonstrated that emotional value has a significant effect on customer loyalty (e.g. Deng et al., 2010; Kumar and Lim, 2008; Lim et al., 2006). A recent study by Karjaluoto et al. (2012) showed that emotional value has a positive effect on trust, which, in turn, results in customer loyalty in the service industry. The third component of customer perceived value is customization value. Customization value is defined as the benefits customers attain
from the tailored-made products or services that can fulfill their particular needs and preferences (Gwinner et al., 1998; Thirumalai and Sinham, 2011). Providing a customized product or service to the marketplace is increasingly being perceived as a key competitive differentiator and an important source of switching costs. This is because the product or service is designed specifically to meet the particular needs of customer, and, hence, cannot be easily duplicated by rivals (Duray and Milligan, 1999; Lee, 1998, Piller et al., 2004).
Driven by the fast-evolving business environment and increasing demands of customers for personalized products and services, most of the marketing strategies of service firms are becoming more customer-orientated, and they start looking for a way to introduce, provide, and deliver customized products or services that can meet the specific needs and preferences of customers perfectly. In general, products can be customized by firms following one of two options: (i) they can offer a purely customized product that meets the specific needs of the customers, or (ii) they can offer a standard but customizable product that can be altered by the customers themselves (Logman, 1997). A host of scholars (Gilmore and Pine, 1997; Riihimaa et al., 2004; Sigala, 2006; Simonson, 2005) remarked that firms that pursue the customization strategy and deliver tailor-made products or services will lead to greater customer perceived value, because customized products or services can serve the unique needs of customers better than the standard products or services.
In response to the intense competition, the dynamic change of the market condition, and the heterogeneity of customer needs, banks have begun to incorporate some elements of customization into the design of products, and offered various standard but customizable products that can be chosen flexibly by customers based on their usage preferences. In the context of this study, customization value is defined as “the value customers derive from the product that is tailored to their individual needs” (developed from Gwinner et al., 1998; Thirumalai and Shinha, 2011). According to Coelho and Henseler (2012), customization (value) is positively related to customer loyalty in the banking and cable TV industries. This is because a highly customized product or service will create switching costs and diminish the attractiveness of competing alternatives, which, in turn, foster greater customer loyalty. The final component of customer perceived value is relational value. Relational value is regarded as “the benefits customers receive beyond the core offering of the company and that are derived from an established, long-term relationship with their regular service providers” (Dimitriadis, 2010, p. 298). Relational value has been an important subject for marketing, which aims at establishing, developing, maintaining successful relationships (Grönroos, 1994; Morgan and Hun, 1994; Weng
et al., 2010).
2011; Martin-Consuegra et al., 2006). These relationship exchanges can create value (hereafter termed as relational value), and, therefore, assist firms in building an insurmountable competitive edge (Marzo-Navarro et al., 2004; Su et al., 2009). In fact, relational value has been viewed as an important constituent of switching barrier, because all benefits accruing to regular customers will be lost once they switch to a new service provider (Chang and Chen, 2007). In a broad spectrum of service industries, Gwinner et al. (1998) found that relational value is positively associated with customer loyalty. Despite the fact that the nature of relational value can vary considerably across service industries (Chang and Chen, 2007), there has hitherto been no study that investigates the influence of relational value on customer loyalty in retail banking in Nakuru, Kenya.
Customer perceived value and loyalty
Perceived value has an enormous influence on customer behaviour, because it influences his decisions on product choice, purchase intentions and repeat purchasing. . There is a strong support for the positive relationship between customer perceptions of value and customer loyalty (Cronin et al, 2000). Sweeney and Soutar (2001) in a study, find a significant relationship between customer value and attitudinal and behavioral intentions in retail context. More recently in a tourism based setting, Duman and Mattila (2005) find that perceived value is a strong predictor of behavioral intentions when measuring the holistic service experience for cruise vacation travelers. Hansen et al. (2008) indicated customer perceived value had a positive effect on search for alternatives (loyalty measures) in business-to-business context.
The value construct can help explain different areas of consumer behaviour: product choice, purchase intention and repeat purchasing. Value is very often related to customer loyalty (Parasurman, Grewal, 2000). As Neal (1999) said, value predicts choice, thus loyalty. Buyers who are considering a purchase in a particular product or service category scan their product/service options and develop a consideration set. Within the consideration set, they develop a hierarchy of products based on their assessment of value. They can choose the product at the top of their value hierarchy, if available. This may be a conscious, cognitive process or a subconscious process with some emotional elements. If one can accurately measure a purchaser’s relative value structure for product or service category, then one can accurately predict that purchas-er’s choice among a set of competing products/services or brands in that category (Neal, 1999). Oliver and DeSarbo (1998) state that customers are motivated to feel justifiably treated if they perceive that the ratio of their outcome to input is comparable to the ratio of outcome to input experienced by the company. In the other words, customers often measure a company’s ratio of outcome to input by making comparisons with its competitors’ offers in the market. Holbrook (1994) states customer value as the fundamental basis for all marketing activities.
The higher the customer value, the higher the chances of a customer repurchasing the product or services because a high perceived value is one of the primary motivations for patronage.
Theoretical Foundations
The study on the relationship between customer perceived value and loyalty in retail banking was based on two theories. The first theoretical foundation that explained the relationship between customer loyalty and perceived value was drawn from the social exchange theory. The theoretical model adopted for this study was derived from the social exchange theory (Homans, 1958), which posits that all human relationships are formed by the use of cost-benefit analysis and comparisons of alternatives. Homans suggested that when an individual perceives the cost of a relationship outweighs the perceived benefits, then the person will choose to leave the relationship. The Theory further states that persons that give much to others try to get much from them, and persons that get much from others are under pressure to give much to them. The social exchange relationships between two parties develop through a series of mutual exchanges that yield a pattern of reciprocal obligations to each party. Social exchange theory indicates that individuals are willing to maintain relationships because of the expectation that to do so will be rewarding. Individuals voluntarily sacrifice their self- benefits and contribute these benefits to other individuals with the expectation for more future gains. Thibaut and Kelly (1959) propose that whether an individual retains a relationship with another one depends on the comparison of current relationship, past experience and potential alternatives. The constant comparison of social and economic outcomes between a series of interactions with current partners and available alternatives determines the degree of an individual’s commitment to the current relationship.
relative rewards and sacrifices associated with the offering. Customers are inclined to feel equitably treated if they perceive that the ratio of their outcome to inputs is comparable to the ratio of outcome to inputs experienced by the company (Oliver and DeSarbo, 1988). And customers often measure a company’s ratio of outcome to inputs by making comparisons with its competitors’ offerings.
Statement of the problem
Financial institutions are continually experiencing pressure to increase their profitability as a result of low growth and strong competition in the market. This aggressive competition has weakened the relationships between the customers and the financial institutions. Hence, offensive strategies for acquiring new customers and defensive strategies in strengthening customer loyalty become important (Miles, 1994). It is crucial to develop and maintain customer loyalty in the service industry because loyalty has a strong correlation with increased sales and profit through repeat patronage of the services or products, positive word-of-mouth to the public and less price sensitivity (Thomas et al., 2009). Banks have introduced Automated Teller Machines (ATMs), internet banking and other e-banking services as well as customer care services in order to create a competitive edge. However, these changes are easily imitated by other banks and thus no differential advantage. It is thus of paramount importance for the banks to develop and sustain customer loyalty in order to create and maintain a competitive advantage.
The success of firm performance is affected by the level of customer loyalty because acquiring new customers is far more expensive that maintaining existing ones. Therefore, firms that desire to remain competitive need to build and enhance relationships with loyal customers because of its benefits that include profitability, business referral and publicity and competitive positioning (Hennigh-Thurau et al.., 2002). Given that it is increasingly becoming difficult to achieve customer loyalty in a competitive environment and that it remains ambiguous regarding its underlying determinants (Liang and Wang, 2005), researchers have attempted to develop models suited to investigate customer loyalty in a variety of contexts. In reviewing these models, it has been established that customer perceived value is one of the most critical variables in creating and maintaining customer loyalty (Gwinner et al.., 1998, Kim and Cha, 2002, Liang and Wang, 2005, Palmatier et al., 2006). However, there is little agreement about which determinants explain the most effective way of creating and maintaining customer loyalty. Whilst there are a number of variables that could be useful as determinants of customer loyalty, researchers have considered customer perceived value as the cornerstone in relational exchanges between service providers and customers (Lin et al., 2003, Hsieh et al., 2005, Liang and Wang 2005, Palmatier et al., 2006, Wang et al., 2006). Despite the recognition that customer perceived value is an important determinant of customer loyalty, critical research gaps remain regarding its influence on customer loyalty in retail banking in Nakuru county. This study, therefore, sought to determine the extent to which customer perceived value contributed to the development and maintenance of customer loyalty in retail banking
Research Objectives
The general objective of the study was to determine the influence of customer perceived value on customer loyalty in retail banking in Kenya. The study was guided by the following specific objectives:
To determine the influence of monetary value on customer loyalty in retail banking in Kenya
To determine the influence of emotional value on customer loyalty in retail banking in Kenya
To determine the influence of customization value on customer loyalty in retail banking in Kenya
To determine the influence of relational value on customer loyalty in retail banking in Kenya’
To determine the combined influence of monetary value, emotional value, customization value and relational value on customer loyalty in retail banking in Kenya.
Research Hypotheses
The study tested the following hypotheses:
HO1There is no significant relationship between monetary value and customer loyalty in retail banking
HO2There is no significant relationship between emotional value and customer loyalty in retail banking
HO3There is no significant influence between customization value and customer loyalty in retail banking
HO4There is no significant relationship between relational value and customer loyalty
HO5There is no significant relationship between monetary , emotional value , customization value and relational value and customer loyalty in retail banking
MATERIALS AND METHODS
Research Design
A simple randomized ex-post facto design was used to determine the relationship between customer perceived value and customer loyalty (McMillan and Schumacher, 1989). Ex post facto design is a form of survey research where independent variables are selected rather than being manipulated and observations and analyses of relationships among the variables carried out in their natural settings. The method was preferred because it allows ascertaining wide spread opinions under natural conditions. The design also allows investigating possible relationships between variables. The design was chosen because other similar studies on customer service have successfully usedin the past (Masinde, 1986, and Mwendwa, 1987). Cross - sectional data were collected.
Sample Size and Sampling Procedure
categorization was to assist in investigating whether the type of bank influenced service quality, customer satisfaction, and customer value and customer loyalty. Drawing a sample from across these categories of commercial banks ensured adequate representativeness of the various characteristics Stratified random sampling was used to obtain the sample size. The sampling technique was selected because it ensures that all the groups (categories of banks) were adequately sampled and this facilitated comparison among the groups. The population was stratified according to ownership (public sector, private sector and foreign), market share and period of operation within the Municipality. A sub-sample size was determined for each stratum. The total sample size for the study was obtained using the following formula:
Where
S = Sample size required
N = Number of people in the population
P = preliminary estimate of percentage of people in the
population who possess attributes of interest. The conservative estimate and one that is often used is 50%. (0.5 will be used in this formula)
A= Accuracy (or precision) desired, expressed as a decimal (.05 for 5% is used in this formula)
Z = The number of standard deviations of the sampling
distribution (Z units) that corresponds to the desired confidence level , 1.96 for 95% confidence level , 1.6449 for 90% confidence level and 2.5758 for 99%.
The total sample size of 381 respondents was determined. The sub-sample size for each bank was determined using the formula by Krejcie and Morgan (1970) given as:
s= pS P
Where
s = Sub-sample size for each bank
p = Sub population of customers in each bank S = Total sample size for the study
P = Total population for all the banks
The formula was also preferred for its acceptable level of accuracy in generating a representative sample size at 0.05 level of confidence. After the population was stratified and the sample size for each stratum determined, individual respondents were selected through systematic sampling. This was achieved by picking the kth customer from each stratum coming to the bank, which is an acceptable method according to Zikmund (2003). This technique was preferred because it ensured representative coverage of all elements being considered in the study. The data collection period covered one month to ensure inclusiveness of customers who come to the bank on different dates of the month.
Instrumentation
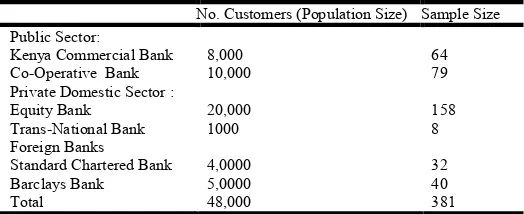
[image:6.595.302.564.178.285.2]Data were collected using a questionnaire. It was chosen because it was easy to administer in the on-the-spot- collection of information approach used in this study. The technique also facilitated confidentiality of customers’ personal information because they did not have to disclose their identity when filling out the questionnaire.
Table 1. Sample Size Determination
No. Customers (Population Size) Sample Size Public Sector:
Kenya Commercial Bank 8,000 64
Co-Operative Bank 10,000 79
Private Domestic Sector :
Equity Bank 20,000 158
Trans-National Bank 1000 8
Foreign Banks
Standard Chartered Bank 4,0000 32
Barclays Bank 5,0000 40
Total 48,000 381
The questionnaires were administered in January 2011 during working hours from 9a.m to 3 p.m., Monday through Friday. This is the period when the banks have peak traffic and hence it was easier to get customers to respond to the questionnaires. It is also the time when banks experience long queues and the respondents are likely to give more “true” and “rational” assessment of the quality of service received, level satisfaction and value for their money. The total number of items that measured the criterion (dependent) variable were 64 and were operationalized using a five – point likert scale, ranging from (1= strongly disagree) to (5 = strongly agree). The scale was useful in measuring the strength of the respondents’ responses on these items. The items were constructed based on the literature on service quality, satisfaction, perceived value, customer social capital and loyalty. Customer loyalty (dependent variable) items were selected based on observable behavior characteristics that included repurchase, referrals, citizenship behavior, co-production, willingness to pay premium price, less switching behavior, mentoring other customers and advocacy or word of mouth. The selection of these items ensured completeness in covering all the key aspects of loyalty outcome behaviors. Three items were used to measure customer perceived value in terms of benefits and costs associated with the services they received.
Validity and Reliability of the study
the instruments measured special respondent attributes like perceptions, attitudes and opinions towards the effect of service quality, customer satisfaction and customer value on customer loyalty. Cronbach’s coefficient alpha was used to test reliability or to assess the quality of the measurement (Churchill, 1979). An acceptance level of .70 of Cronbach’s alpha tested for internal consistency for each of the constructs as recommended by McMillan (1992). The internal reliability test results were for service quality (0.918) which was high enough to ensure the internal consistency as this was higher than the recommended 0.7 threshold (Hair et al., 2006).
Data Collection Methods
Data was collected using questionnaires that were administered by research assistants outside the entrance to the banks. The research assistants waited for the respondents to fill out the questionnaires. Before proceeding to the field, necessary letters of authority were obtained from. The participants were assured that any data collected was to be kept confidential and was to be used strictly for academic purposes only.
Operationalization of the Study Variables
Customer perceived value was operationalized in terms of monetary value, emotional value, customization value and relational value . Index values or averages were computed to represent each independent variable. Perceived value was measured in terms of the trade-off between the costs (monetary and nonmonetary) and benefits customers derived from their bank. The dependent variable was customer loyalty and was measured in terms of outcome behaviors. The outcome behaviors of loyal customer considered in this study were repurchase, advocacy (word-of-mouth), less switching behavior, citizenship behavior, mentoring other customers, willingness to pay more and business referrals. The individual measures were ordinal but were weighted to yield the total loyalty score or index, which represented a measure of loyalty on an interval scale.
Data Analysis
The study used both descriptive and inferential analyses. Descriptive analysis involved the computation of frequency distribution, mean, and standard deviation, which were useful to identify differences among groups. Inferential analysis assisted in understanding relationships between the study variables. In order to meet the research objectives of this study, all valid responses were assessed using a variety of statistical techniques: Pearson’s Correlation, analysis of variance and regression analysis.
Pearson’s Correlation and regression analyses were used to establish the degree of relationship between perceived value and customer loyalty. Regression analysis describes the way in which a dependent variable is affected by a change in the value of one or more independent variable. This technique was preferred because it tests the relative contribution of the independent variables on customer loyalty was achieved through multiple regression. Regression helps to predict the value of a dependent variable using one or more independent
variables (Kometa (2007) and is used for the investigation of relationships between variables (Sykes (1993). This analysis was also useful in quantifying the influence of various simultaneous effects on a single dependent variable (Sykes, 1993). In order to test the strength of the relationship between the dependent and independent variables, regression coefficients were used to evaluate the strength of the relationship between the independent variables and the dependent variable. Chu (2002) claims that the beta coefficients of the independent variables can be used to determine its derived importance to the dependent variable compared with other independent variables in the same model. Chu (2002) indicates that the beta coefficients of the independent variables can be used to determine their derived importance to the dependent variable compared with other independent variables in the same model. In general, the relationship of the independent variable with the dependent variable will be positive if the beta coefficient is positive. In contrast, if the beta coefficient is negative, the relationship between the independent and dependent variables will become negative. Of course, the beta coefficient equaling zero implies that there is no relationship between both of the independent and dependent variables. R2 was the multiple correlation, which represented the percent of variance in the dependent variable (customer loyalty) explained collectively by all of the independent variables (Garson, 2008). Thus the R2 value in the model provided a measure of the predictive ability of the model. The close the value to 1, the better the regression equation fit the data. The following study multiple linear regression model was tested
CL = βo + β1MV + β2EV + β2CV+ β4RV+ e
Where:
βo = Intercept or constant
β1 to β4 = Regression coefficients or slope of the regression line of the independent variables 1 to 4. They indicate the relationship between the independent variables and the dependent variable
MV= Monetary value EV= Emotional value CV=Customization value RV= Relational value ε= Error or random term.
In regression analysis, the decision rule is: Reject null hypothesis if F calculated > F critical at α = 0.05 (5% level of significance). However, if F calculated < F critical, we do not reject the null hypothesis. Another way of drawing conclusion on the significance of the regression is that if the p-value (probability) calculated by the regression is less than our significance level (0.05) then it
RESULUTS AND DISCUSSIONS
Influence of customer perceived value on Customer Loyalty
index and the perceived value dimension indices were used to test the relationship between them. Correlation analysis was used to test the relationship between perceived value dimensions and customer loyalty.
HO1There is no significant relationship between monetary
value and customer loyalty in retail banking in Kenya.
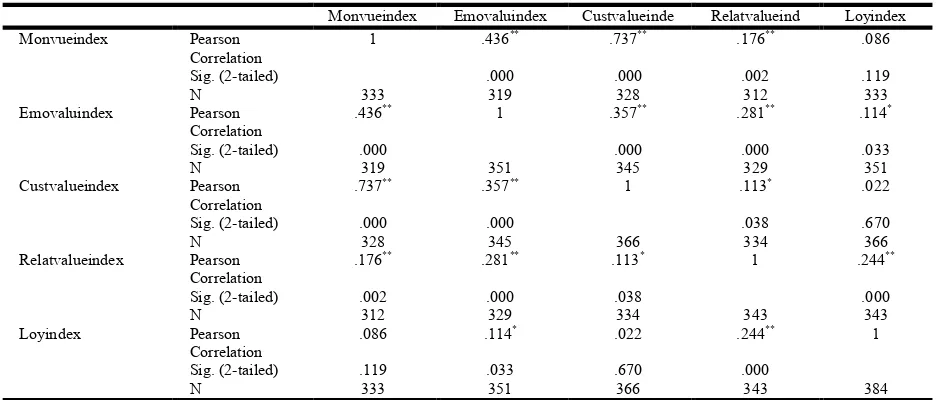
The result of Pearson correlation analysis provided in table 2 shows that monetary value is significantly, positively correlated to customer loyalty. The result shows a coefficient of .086** at p =0.01 (r =. 086**, p< 0.01) which shows that the
two constructs, customer perceived value and customer loyalty are positively related. Therefore, the hypothesis should be rejected.
HO2 There is no significant relationship between emotional
and customer loyalty in retail banking in Kenya
[image:8.595.68.538.133.333.2]The result of Pearson correlation analysis provided in table 2 shows that emotional value is significantly, positively correlated to loyalty. The result shows a coefficient of .114** at p =0.01 (r =. 114**, p< 0.01) which shows that the two Table 2. Correlation matrix for the customer perceived value and customer loyalty
Monvueindex Emovaluindex Custvalueinde Relatvalueind Loyindex
Monvueindex Pearson
Correlation
1 .436** .737** .176** .086
Sig. (2-tailed) .000 .000 .002 .119
N 333 319 328 312 333
Emovaluindex Pearson Correlation
.436** 1 .357** .281** .114*
Sig. (2-tailed) .000 .000 .000 .033
N 319 351 345 329 351
Custvalueindex Pearson Correlation
.737** .357** 1 .113* .022
Sig. (2-tailed) .000 .000 .038 .670
N 328 345 366 334 366
Relatvalueindex Pearson Correlation
.176** .281** .113* 1 .244**
Sig. (2-tailed) .002 .000 .038 .000
N 312 329 334 343 343
Loyindex Pearson
Correlation
.086 .114* .022 .244** 1
Sig. (2-tailed) .119 .033 .670 .000
N 333 351 366 343 384
**. Correlation is significant at the 0.01 level (2-tailed). *. Correlation is significant at the 0.05 level (2-tailed).
Table 3. Regression results
Model R R Square Adjusted R Square
Std. Error of the Estimate
Change Statistics
Durbin-Watson R Square Change F Change df1 df2 Sig. F Change
1 .329a .109 .096 9.31754 .109 8.918 4 293 .000 1.917
a. Predictors: (Constant), Relatvalueindex, custvalueindex, emovaluindex, monvueindex b. Dependent Variable: loyindex
Table 4. Anova
Model Sum of Squares Df Mean Square F Sig.
1 Regression 3096.865 4 774.216 8.918 .000b
Residual 25437.232 293 86.816
Total 28534.097 297
a.Dependent Variable: loyindex
[image:8.595.127.478.568.649.2]b.Predictors: (Constant), Relatvalueindex, custvalueindex, emovaluindex, monvueindex
Table 5. Coefficientsa
Model
Unstandardized Coefficients
Standardized
Coefficients t Sig.
B Std. Error Beta
1 (Constant) 16.036 4.276 3.750 .000
monvueindex 2.096 1.205 .149 1.740 .083
emovaluindex .221 1.051 .013 .210 .834
custvalueindex -2.043 1.096 -.153 -1.865 .063
Relatvalueindex 4.453 .857 .298 5.198 .000
constructs, customer perceived value and customer loyalty are positively related. Therefore, the hypothesis should be rejected.
HO3 There is no significant relationship between
customization value and customer loyalty in retail banking in
Kenya
The result of Pearson correlation analysis provided in Table 2 shows that customization value is significantly, positively correlated to loyalty. The result shows a coefficient of.244** at p =0.01 (r =. 244**, p< 0.01) which shows that the two constructs, customer perceived value and customer loyalty are positively related. Therefore, the hypothesis should be rejected.
HO4 There is no significant relationship between relational
value and customer loyalty in retail banking in Kenya
The result of Pearson correlation analysis provided in Table 2 show that relational value is significantly, positively correlated to loyalty. The result shows a coefficient of .022** at p =0.01 (r =. 022**, p< 0.01) which shows that the two constructs, service quality and customer loyalty are positively related. Therefore, the hypothesis should be rejected.
HO5 There is no significant combined influence of the
dimensions of perceived value (monetary, emotional, customization and relational values) on customer loyalty in retail banking in Kenya
The results of the regression analysis in table 3 indicate that R2 was .109 or 10.9 %. This shows that the four independent variables of monetary value, emotional value, customization value and relational value explain only 10.9 % of the factors that influence customer loyalty in banking. The statistical F test is used to determine how well the regression equation fits the data. In this study, the F value of 8.918 was significant at the 1% level, indicating that at least one of the independent variables helped to explain some of the variation in customer loyalty. Further, the adjusted coefficient of determination revealed that 9.6% of the variance in loyalty was explained by the regression model. The result in the ANOVA table 4 also shows that there is a significant relationship between dimensions of the customer perceived value and customer loyalty in retail banking.
Thus, the R2 in this regression model points to other factors not included in the model that account for loyalty in the bank. For instance, loyalty is affected by factors such as the bank’s image, complaint management capabilities, the quality of communication between the firm and the customer, and trust (Keaveney 1995; Ball et al., 2006), demographic factors such as age, gender, ethnicity, and income (Van Pham and Simpson 2006), and prior experience with the service industry in general (Parasuraman et al., 1991; Gilbert and Veloutsou 2006) which are beyond the scope of this study. The value of the Beta coefficients in table 6 showed that relational value contributed the most (.298) to customer loyalty, followed by customization value (.153), monetary value (.149) and emotional value (-.013) respectively. Therefore, the hypothesis that no one significant factor influences customer loyalty is rejected. The study established that customer perceived value influences
customer loyalty.This concurs with the finding by Reichheld (1996) that value creation is linked with customer loyalty. Lifetime value is the total return earned (after recruitment cost) over the length of time the customer stays with a company or balancing the long-term commitment against the period spent with the company. These findings are also consistent with those ofPark et al. (2006) which find that in deciding whether to return to service provider or not, a consumer always considers the extent to which he received ‘value for money’. They concluded that customer perceived value is associated with the loyalty intention with regards to the services rendered by commercial banks. This means that loyalty is greatly dependent on customer value in the commercial banks. Hence, it was concluded that there is strong link between perceived value and future intention to stay with the bank. Previous studies by Jamal and Kamal (2004) also established that the level of satisfaction is always high when the customer gives minimum price and gets maximum of usage and profit and that dissatisfaction usually occurs when the pricing issues are not suiting the needs of the customers. Fox and Poje (2002) found that when customers think that the charges are perceived to be higher, they churn or defect to other banks .If a customer is satisfied, then loyalty injects automatically and the customer remains with the current providers for a longer and longer period of time.
Managerial Implication of Study
This study established a direct and positive relationship between perceived value and customer loyalty. It was found that the extent to which customers perceive the fees charged as reasonable, fair and not expensive as well as giving good value for their money contributes to creating customer value. This implies that banks need to demystify their bank statements so that customers can see exactly what they are being charged for so as to create customer and consequently customer loyalty. ustomers have found it easy to open accounts and switching cost from one bank to another is minimal. All these are factors contribute to customers switching from the current bank. If a customer gets value for their money, then he/she will become satisfied and this injects loyalty automatically and the customer remains with the current providers for a longer and longer period of time. The study has among other things, looked at how the different dimensions of customer perceived value are related with customer loyalty. By taking this disaggregated approach focusing on how all four dimensions rather than just looking at how overall perceived value influences customer loyalty , the study has shown that not all fours antecedents of customer perceived value (monetary, emotional, customization and relational values ) contribute diversely to customer loyalty in retail banking customers in Kenya. This should provide a more useful and practical information for managers in improving customer perceived value that will eventually lead to customer loyalty (Wang et al., 2004).
management to take a look at strategies that emphasise relationship creation in service delivery which lead to stronger customer loyalty in retail banking. The study further shows that customers who perceive their bank staffs to give caring, customized service and individualised attention) tend to be more loyal than those who perceive their banks to be investing more in tangibles. Put another way, providing customers with care and individualised attention is more important than providing a conducive business environment to the customer that appeals emotional aspects of the service experience. Therefore, bank managers would be well advised to focus on the employee training programmes so that they can offer personalized or customized service. This will result in the development and maintenance of a long-term relationship with the customers. Customer perceived value one of the critical success factors that influence the competitiveness of retail banking organizations. A bank can differentiate itself from competitors by providing high customer perceived value. The findings of the study showed that the dimensions of customer perceived value can be used by banks to attract and maintain their customers. To survive in the competitive banking industry, banks have to develop new strategies which will satisfy their customers. Since it is impossible to have product differentiation in a competitive environment like the banking industry (Ioanna, 2002) as all banks are delivering the same products, bank management should try to differentiate their firm from competitors through service delivery. Today’s customers have more choices for their financial needs than ever before (Harwood, 2002).
REFERENCES
Ananth, A., Ramesh, R. and Prabaharan, B., 2011. “Service Quality GAP Analysis in Private Sector Banks A Customer Perspective”, Internationally Indexed Journal, Vol. II, Issue.1 pp., 245-252.
Anderson, D.R., Sweeney, D.J. and Williams, T.A. 2009. Statistics for Business and Economics Revised tenth
edition, Thomson, South-Western, USA. 1018pp
Anderson, H. and Jacobsen, P.Q. 2000. Creating Loyalty: Its strategic importance in your customer strategy. S.A., 55-67 Angur, Madhukar G., Nataraajan, Rajan and Jahera Jr, John S.,
1999. Service Quality in the Banking Industry: An Assessment in A Developing Economy. International Journal of Bank Marketing, 17 (3):116-123.
Asubonteng, P., McCleary, K.J., and Swan, J. 1996. “SERVQUAL revisited: a critical review of service
quality,” Journal of Service Marketing, Vol. 10, No. 6, pp 62-81.
Baker, J., and M. Cameron. 1996. The effects of the service environment on affect and consumer perception of waiting time: an integrative review and research propositions. Journal of the Academy of Marketing Science, 24 (4), 338 Beerli, A., Martin J.D., and Quintana A. 2004. A model of
customer loyalty in the retail Banking market. European Journal of Marketing, 38(1/2), 253-275.
Bellini, C.G.P., Lunardi, G.L. and Henrique, J.L. 2005. Service quality in banks: Insights from the Brazilian Experience.
Journal of Internet Banking and Commerce, 10(3).
Berry, L. L. 1995. Relationship marketing of services— growing interest, Emerging Perspectives. Journal of the Academy of Marketing Science, 23(4), 236-245.
Berry, L. L., Seiders, K., and Grewal, D. 2002. Understanding
service convenience. Journal of Marketing, 66, 1–17,
(July).
Berry, L., Parasuraman, A. and Zeithaml, V., 1994, “Improving service quality in America: lessons learned”,
Academy of Management Executive, Vol. 8, pp. 32–45 Berry, L., Zeithaml, V. and Parasuraman, A., 1988 “The
service-quality puzzle”, business Horizons, Vol.31 No.5, pp.35-43.
Berry, L.L., and Parasuraman, A. 1991. Marketing Services: Competing through Quality. (New York, Free- press) Best, R. 2009. “Market-Based Management: Strategies for
growing customer value and profitability”. 5thedition. Pearson, Prentice Hall
Bitner and Hubbert, A.R. 1994. Encounter Satisfaction versus Overall Satisfaction Versus Quality: The Customer’s Voice .In R.T. Rust and R. L. Oliver (Eds.), Service Quality: New Directions in Theory and Practice (pp. 72-94). Thousand Oaks, CA: SAGE Publications.
Bitner, M.J. 1992, “Servicescapes: the impact of physical surroundings on customers and employees”, Journal of Marketing, Vol. 56, pp. 57-71.
Bitner, M.J. 1992. “Servicescapes: the impact of physical Marketing, Vol. 56, pp. 57-71.
Blanchard, R.F and Galloway, R.L 1994, “Quality in Retail Banking”, International Journal of Service Industry Management, Vol. 5 (4), pp. 5-23.
Bolton, R. and Drew, J.H. 1991. A multistage model of consumers’ assessment of service quality and value.
Journal of Consumer Research, 17(4), 375-384.
Bonn, M.A., and Joseph-Mathews, S.M. 2007. Heritage/cultural attraction atmospherics: Creating the right environment for the heritage/cultural visitor. Journal of Travel Research, 45(3), 345-354.
Brady M., Cronin J.J., Brand R.R. 2002. Performance-only Measurement of Service Quality: A Replication and Extension, Journal or Business Research, 55, 7-3.
Brady, M.K. and Cronin, J.J. Jr 2001, “Some new thoughts on conceptualizing perceived service quality: a hierarchical approach”, Journal of Marketing, Vol. 65, pp. 34-49. Butcher, K., Sparks, B., and O’Callaghan, F. 2001. Evaluative
and relational influences on service loyalty. International Journal of Service Industry Management, 12(3/4), 310-327. Carman, J.M. 1990. Consumer Perceptions of Service Quality: an assessment of the SERVQUAL dimensions. Journal of Retailing, 66(1), 33-5
Caruana, A. 2002. Service Loyalty: The Effects of Service Quality and the Mediating Role of Customer Satisfaction.
European Journal of Marketing, 36(7/8), 811–828.
Choi, K.S., Cho, W.H., Lee, S.H., Lee, H.J, Kim, C.K. 2004. The Relationships among Quality, Value, Satisfaction and Behavioral Intention in Health Care Provider Choice: A South Korean Study. J. Bus. Res. 57(8):913-921.
Chu R. 2002. Stated-Importance Versus Derived-Importance Customer Satisfaction Measurement. J. Serv. Mark. 16(4): 285-301
Cronin, J. and Taylor, S. 1992. Measuring Service Quality: A Re-examination and Extension. Journal of Marketing, 56(3): 55-68.
Dabholkar, P.A., Thorpe, D.I. and Rentz, J.O. 1996. "A measure of service quality for retail stores: scale
development and validation", Journal of the Academy of Marketing Science, Vol. 24, Winter, pp. 3-16.
De Ruyter, K. Wetzels, M., and Bloemer, J. 1998. “On the Relationship between Perceived Service Quality, Service Loyalty and Switching Costs,” International Journal of Service Industry Management, Vol.9, pp. 436-53.
Dick, A. S., and Basu, K. 1994. Customer loyalty: toward an
integrated conceptual framework. Journal of the Academy
of Marketing Science, 22, 99–113, (Spring).
Douglas, L. and Connor, R. 2003. Attitudes to service quality- the expectation gap, Nutrition and Food Science, Vol. 33 Number 4, p.165-172.
Dube, L., and Menon, K. 2000. Multiple roles of consumption emotions in post-purchase satisfaction with extended service transactions. International Journal of Service Industry Management, 11(3), 287-304.
Eagly, A.H., and Chaiken, S. 1993. The nature of attitudes,
The psychology of attitudes. Harcourt Brace Jovanovich College Publishers, Fort Worth, TX.
Ehigie, B. O. 2006. Correlates of customer loyalty to their banks: a case study in Nigeria. International Journal of
Bank Marketing ,24 (7), 494-508.
Eisingerich, Andreas B., and Bell, Simon J. 2006. Analysis paper Relationship marketing in the financial services industry: The importance of customer education, participation and problem management for customer loyalty. Journal of Financial Services Marketing, 10 (4), 86 – 97.
Eisingerich, Andreas B., and Bell, Simon J. 2007. Maintaining customer relationships in high credence services. Journal
of Services Marketing, 21 (4), 253-262.
Ennew, C. T., and Bink, M. R. 1999. The Impact of Participative Service Relationships on Quality, Satisfaction and Retention: An Exploratory Study. Journal of Business Research, Vol.46, pp.121-132.
Finn, D.W. and Lamb, C.W., An evaluation of the SERVQUAL scale in a retailing setting, in Holman, R. and Solomon, M.R. (Eds), Advances in Consumer Research, Association for Consumer Research, Provo, UT, pp. 483-90, 1991. Fournier, S. 1998. Consumers and their brands: developing
relationship theory in consumer research. Journal of Consumer Research, 24 (March), 343–373.
Fullerton, G. 2005. The service quality–loyalty relationship in retail services: Does commitment matter? Journal of Retailing and Consumer Services, 12(2), 99-111.
Glaveli, N., Petridou, E; Liassides, C., and Spathis, C. 2006. Bank Service Quality: evidence from five Balkan countries.
Managing Service Quality: Global Trends and Challenges in Services, 16(4), 380-394.
Gremler, D.D. and Brown, S.W. 1996. “Service loyalty: Its nature, importance, and implications”. In: B. Edvardsson, S.W. Brown and R.E. Johnston, Editors, Advancing service quality: a global perspective, International Service Quality 1996. pp. 171–180
Gruen T.W., 1995. The Outcome Set of Relationship Marketing in Consumer Marketing. International Business Review, 4, 447-469
Gwinner, K. P., Gremler, D. D., and Bitner, M. J. 1998. Relational benefits in service industries: the customer’s
perspective. Journal of the Academy of Marketing Science,
26, 101–114, (Spring)
Hair, J., Black, W., Babin, B., Anderson, R., and Tatham, R. 2007. Multivariate Data Analysis. 6th ed. New Jersey: Pearson Education, Inc.
Hair, J.F. Jr, Bush, R. and Ortinau, D. 2006. Marketing Research(3rd edn). Boston: McGraw-Hill.
Hallowell, R. 1996. “The relationships of customer satisfaction, customer loyalty, and profitability: an empirical study”, International Journal of Service Industry Management,
Harris, L.C. and Goode, M.M.H. 2004. “The 4 levels of loyalty and the pivotal roles of trust: A study of online service dynamics”. Journal of Retailing, Vol.80, pp.139-158. Heskett, J.L., Sasser, W.E., and Schlesinger, L.A. 1997. “The
Service Profit Chain”, New York: Free Press, pp 302 Hirschman, E. C., and M. B. Holbrook. 1982. Hedonic
consumption: emerging concepts, methods and propositions. Journal of Marketing, 46 (3), 92.
Jiang, Y., and C. L. Wang. 2006. the impact of affect on service quality and satisfaction: the moderation of service contexts. Journal of Services Marketing 20 (4): 211. Kaltcheva, V. D., and B. A. Weitz. 2006. When should a
retailer create an exciting store environment? Journal of Marketing, 70, 107
Kandampully J., Menguc B. 2000. Managerial Practices to Sustain Service Quality: An Empirical Investigation of New Zealand Service Firms, Marketing Intelligence and Planning, 18(4), 175- 184.
Kang, G.-D. and James, J. 2004. “Service quality dimensions: an examination of Gro¨nroos’s service quality model”.
Managing Service Quality, 14 (4), 266-77.
Keiningham, T., Zahorik, A.J., and Rust, R.T. 1995. “Getting return on equity”, Journal of Retail Banking, 16 (4), 7-13. Kim, S., and Jin, B. 2002. Validating the retail service quality
scale for US and Korean customers of discount stores: An exploratory study. Journal of Services Marketing, 16(2/3), 223-237.
Knight, G. 1999. “International services marketing: review of research, 1980-1998” International Journal of Services Marketing, Vol. 13 (4/5), pp. 347-360
Kometa, S. 2007. How to Perform and Interpret Regression Analysis. from http:// www.ncl.ac.uk/iss/statistics/docs /regression.php
Kumar, S. A., Mani, B. T., Mahalingam, S., and Vanjikovan, M., 2010. Influence of Service Quality on Attitudinal Loyalty in Private Retail Banking: An Empirical Study. IUP Journal of Management Research, 9(4): 21-38.
Kunst, P. and Lemmink, J., 2000, “Quality management and business performance in hospitals: A search for success parameters”, Total Quality Management, Vol.11 No.8, pp.1123–1133.